Food Deserts: How to Make Them Green
by Minoo Tehrani1*, Andreas Rathgeber2, Lawrence Fulton3 Bryan Schmutz4
1Gabelli School of Business, Roger Williams University, Bristol, RI 02809, USA
2Institute of Materials Resource Management, University of Augsburg, 86159 Augsburg, Germany
3Boston College, Woods College of Advance Studies, Chestnut Hill, MA 02467, USA
4Western New England University, Springfield, MA, 01119, USA
*Corresponding author: Minoo Tehrani, Gabelli School of Business, Roger Williams University, Bristol, RI 02809, USA.
Received Date: 23 June 2025
Accepted Date: 28 June 2025
Published Date: 02 July 2025
Citation: Tehrani M, Rathgeber A, Fulton L, Schmutz B (2025) Food Deserts: How to Make Them Green. Food Nutr J 10: 326. https://doi.org/10.29011/2575-7091.100226
Abstract
Despite tremendous progress in addressing food insecurity, hunger and malnutrition are still widespread across the globe. Different factors, such as low levels of income and education, lack of access to food markets and transportation, high unemployment and population rates, and abandoned homes in a neighborhood, are among the factors that have been attributed to the creation of food deserts in emerging and developed countries. Some of the leading causes of death in the U.S. are heart attack, obesity, and diabetes. These major causes of death have a higher rate among the Black, Latin, and Hispanic populations. Access to healthy and nutritious food is imperative to enhance the health and the welfare of the communities that are considered food desert areas, the areas that are denoted as insecure food areas with poor access to nutritious and healthy foods. The Greater Springfield Area, the 4th largest city in the northeast part of the U.S., with high Black and Hispanic populations, was selected for conducting this research. This study provides the demographic information of the Greater Springfield Area. Furthermore, the research provides nutritional information regarding some easily available fast food items in the Springfield urban area in addition to some vegetables that can grow in Massachusetts. The study compares the minerals, vitamins, and other nutrient contents in the selected vegetables and compares them to the selected fast food items in the area under study. The research provides information regarding the available urban areas under study that vertical agriculture can be implemented with the potential of turning food deserts into green neighborhoods and providing nutritious, healthy, and accessible food sources with the potential of enhancing the health of the communities under study.
Keywords: Food Desert; Health Issues; Nutritious Food; Vertical and Urban Agriculture
Introduction
Food deserts are communities where the populations do not have access to nutritious, fresh, and affordable food items due to low income, lack of access to transportation, and unavailability of healthy food stores. Such food insecurity and the lack of availability and access to nutritious and healthy food for lowincome populations in food desert areas, manifested by the creation of health issues such as heart attack, obesity, and diabetes that contribute to the lower life expectancy, have been the focus of different studies [1-8]. Several factors, such as lack of access to stores with nutritious and healthy food items, lack of availability of transportation to such stores, lack of adequate income and education, high unemployment rate, highly populated neighborhoods, and the number of abandoned buildings that create food desert neighborhoods all contribute to malnutrition and health disparities in these communities [1-3].
Heart attack, obesity, and diabetes are three of the leading causes of death in the U.S. [9].
According to the U.S. Department of Health and Human Resources Office of Minority Health, such causes of death are 30% more prevalent among the Black population [10].
The focus of this study is on the U.S., a developed country, to explore the existence of food deserts, the relationship with the health issues, and strategies to address these issues. The selected area for this study, the Greater Springfield Area, is located in the northeast part of the U.S. The city of Springfield is the fourth largest city in the states of New England.
This study investigates the demographic characteristics of the urban areas under study and explores the relationship with different health issues in these areas. The study expands upon the current literature on food deserts by evaluating the nutrient contents of some nutritious and healthy vegetables and some popular and easily available fast food items. In addition, the areas under study, where vertical and urban agriculture can be implemented, are measured with the potential of turning food deserts into green and nutritious food areas.
Different sections of this research highlight the demographic profiles and the housing building units of the studied areas. In addition, information regarding the yield per acre of the selected vegetables, price per package, and nutrients per 100 grams of each vegetable is provided. Furthermore, the nutrients per 100 grams of the selected fast food items are presented. Monte Carlo simulation is utilized to calculate the yields per acre of areas suitable for vertical and urban agriculture.
The results of this research highlight how the implementation of vertical and urban agriculture can enhance the health and the welfare of the population in the food desert areas.
Literature Review and the Goals of the Study
Studies on food deserts and related issues
Different studies on food desert areas where populations do not have access to nutritious and healthy food have explored such disparities across different countries, cities, and states, such as the U.S. [1,2], Minnesota [3], New York City [4], Chicago [5], Canada [6], Nitra [7], and Amsterdam [8].
Walker et al. [1] reviewed different studies in regard to the Black population across the U.S. According to their study, the higher density of Black population in different areas of the U.S. was associated with more access to fast food [1]. James et al. [2] studied the U.S. national data in the Black neighborhoods. A finding of their study indicates that the Black population had higher access to fast food, a cause of obesity [2]. Hendrickson et al. [3] studied access to fruit and vegetables in the urban and rural communities of Minnesota inhabited by low-income populations. According to their study, higher costs of nutritious and healthy food, in addition to low quality and lack of diversity in available food, contribute to the health issues in the studied communities [3]. Gordon et al. [4] studied different neighborhoods in New York City that are inhabited mostly by Black and Latino populations. The findings of their study show the existence of food deserts, unhealthy food stores, and high populations in these areas that can result in serious health disparities [4]. The research by Kolak et al. [5] indicates the existence of food deserts in the low-income areas in Chicago. According to this research, Black and low-income neighborhoods do not have access to nutritious and healthy food. In addition, economic recession can amplify this issue [5].
McPhil et al. [6], in their study conducted across the rural areas of Canada, argue that the relationship between obesity and food in rural regions and the types of available food items (fresh fruits and vegetables) are important topics to be further researched to clarify the relationship between obesity, race, class, and gender. Trembošová and Jakab [7] studied the presence of food deserts in the city of Nitra, Slovakia. The results of their research indicate food deserts in the areas of the city with aging populations and residents moving to new areas with reduced access to grocery shops have increased the food desert areas since 2008 [7]. Meanwhile, Helbich et al. [8], investigating access to stores with nutritious and healthy food across different neighborhoods in Amsterdam, Netherlands, did not find “inequalities” as far as access to nutritious and healthy food.
According to De Anda and Shear [11], the increase in Mexico’s population to 150 million by the year 2050, resulting in overcrowded urban areas and the lack of availability of water and agricultural land, makes it imperative to concentrate on vertical agriculture to address the increase in population and greenhouse gas emissions. McLaina et al. [12] explored the potential of cultivating the urban forests in Seattle, Washington, to enhance sustainability and interaction of the area population with the urban forest areas. Tanoh and Hashemi-Beni [13], in their study of the socioeconomic status of the population in North Carolina dealing with the food desert and lack of access to nutritious and healthy food, conclude that mapping such areas is important to develop strategies and policies to improve access to healthy and nutritious food for low-income and minority counties.
Steenkamp et al., in their study [14], propose that urban agriculture is a solution to address food insecurity for the urban population at risk and to decrease unemployment and food deserts. According to Benedetta et al. [15], in order to reduce the land and water use for farming, vertical agriculture has been the focus of attention, and there is a need for key performance indicators to fully evaluate vertical agriculture. Siregar et al. [16] reviewed the literature on vertical agriculture. According to the authors, there are several advantages of vertical agriculture that can enhance sustainability and address the socioeconomic issues in dealing with food insecurity [16]. Al-Kodmany’s research [17] examines the growth of population in urban areas, lack of land for agriculture, and the potentials of vertical farming. According to the author, there is a need for research regarding the types of technologies needed for vertical agriculture and also the affordability of such technologies for emerging countries [17].
Besthorn [18] investigated the issue of food insecurity and urban agriculture. According to the author, the issue of food insecurity can be addressed by the engagement of communities in vertical farming. The research by Benke and Tomkins [19] examined the benefits of vertical farming and urban agriculture, year-round food availability, and less need for water. The research also discusses some of the issues in the implementation of urban agriculture, such as the high cost of urban lands [19]. The authors conclude that more research is needed to clarify the types of crops, requirements for energy and water, and CO2 emissions [19].
Goals of the Current Research
Based on the reviewed research, the issues of food insecurity and the existence of food deserts and their relationship to the health issues need further study. The results of the research in this area in developed countries, the U.S., Canada, and the Netherlands, are not consistent [1,6,8]. In different areas of the U.S., the negative impact of food deserts on the health of the communities, specifically minority populations, is supported through different studies [2,4,5,13]. The research by McPhil et al. [6] also supported the impact of food deserts on the obesity of the rural population in Canada. However, the research in Amsterdam, Netherlands, did not find “inequalities” in access to nutritious and healthy foods in different neighborhoods [8]. There are some discrepancies in the results of the research in this area in the developed countries, and further research is needed.
The focus of this study is on the U.S., a developed country, to further explore the existence of food deserts, the relationship with health issues, and strategies to address these issues. Our study explores the strategies for how to turn food deserts into areas that can provide nutritious and healthy food for the population that does not have access to nutritious food through the implementation of urban vertical and urban agriculture.
This research concentrates on the northeast of the U.S., the Greater Springfield Area in the states of New England. The city of Springfield is the fourth largest city in the states of New England. The main goals of this study are to explore the following questions:
- Are there any health issues related to the demographic characteristics of the urban population in the studied area?
- Are there any relationships between the health of the studied population and appropriate food availability or the food deserts in these areas?
- How can we turn the food deserts into nutritious and healthy food environments through the implementation of vertical and urban agriculture to turn food deserts into green horticultural gardens?
Data and Methodology
Data
The first set of collected data in the Greater Springfield Area included the demographic information as shown below in Table 1. Table 1 presents the size and the ethnic diversity of the population in each city/town in the Greater Springfield Area [20].
|
City |
Size of the Population |
White |
Black |
Latino and Hispanic |
Southeast Asian |
Indigenous American and Alaskan |
Multiracial |
|
Agawam |
28,406 |
88.0% |
2.4% |
5.7% |
2.0% |
0.10% |
3.3% |
|
Chicopee |
54,838 |
67.7% |
5.7% |
24% |
2.2% |
0.0% |
8.0% |
|
East Longmeadow |
16,378 |
85.1% |
2.6% |
8.0% |
1.3% |
0.0% |
5.3% |
|
Holyoke |
37,628 |
43.3% |
4.6% |
51.7% |
0.08% |
0.5% |
19.01% |
|
Longmeadow |
15,621 |
86.6% |
1.3% |
3.5% |
5.9% |
0.0% |
4.3% |
|
Springfield |
153,672 |
28.2% |
20.5% |
48.3% |
2.9% |
0.4% |
18.5% |
|
West Springfield |
28,424 |
76.3% |
3.5% |
5.80% |
5.3% |
0.2% |
6.9% |
Table 1: Demographic profile of the population in the Greater Springfield Area.
As presented in Table 1 [20], the city of Springfield has the highest population in the Greater Springfield Area in Hampden County. Table 1 indicates that the cities of Chicopee, Holyoke, and Springfield have the highest percentage of Black and Latino and Hispanic populations. The city of Springfield represents the most ethnically diverse city in the Greater Springfield Area.
Table 2 presents the demographic profile of the population as far as median income per household, per capita income, persons in poverty, and the percentage of the population with a high school diploma and bachelor’s degree in the Greater Springfield Area [20].
|
City |
Median Income/ Household |
Per Capita Income |
Persons in Poverty |
High School Grad (25+) |
Bachelor’s degree (25+) |
|
Agawam |
$80,809 |
$45.172 |
6.5% |
94.9% |
34.5% |
|
Chicopee |
$63,866 |
$34,719 |
15.5% |
86.10% |
20.00% |
|
East Longmeadow |
$101,570 |
$47,194 |
3.5% |
90.40% |
32.80% |
|
Holyoke |
$49,007 |
$27,972 |
26.0% |
79.40% |
21.50% |
|
Longmeadow |
$138,218 |
$64,358 |
3.8% |
95.30% |
65.10% |
|
Springfield |
$47,677 |
$25,669 |
11.5% |
80.20% |
16.80% |
|
West Springfield |
$67,297 |
$41,129 |
10.5% |
83.70% |
21.60% |
Table 2: Demographic profile of the population in the Greater Springfield Area.
As shown in Table 2 [20], Springfield, Chicopee, and Holyoke have the lowest median household and per capita incomes and the highest percentage of persons in poverty.
Furthermore, these cities indicate the lowest percentage of population with tertiary degrees among other cities and towns in the Greater Springfield Area.
According to Massachusetts diabetes data, one of the leading causes of death in Massachusetts is heart disease, which is higher among the Black and Hispanic populations compared to the white population [21]. In addition, obesity in Massachusetts is high. One out of four high and middle school students and half the adults are obese [22].
As presented in Table 3, based on Massachusetts diabetes statistics, the diabetes rates among Black (11.8%) and Hispanic populations (13.8%) are higher than the diabetes rate for the white population (9.15) [21]. In addition, in Massachusetts, the obesity rates for Black (37%) and Hispanic (30.6%) populations are higher than the obesity rate for the white population (27.5%) [22]. Both diabetes and obesity are major underlying causes of cardiac arrest. Furthermore, the premature mortality rate (<75 years old) in Massachusetts is higher for Black (431.3) and Hispanic (338) than for the white population (314.4) [23].
|
Massachusetts Population |
Diabetes% |
Obesity % |
Premature Mortality Rate |
|
Black |
11.8 |
37.6 |
431.3 |
|
Hispanic |
13.8 |
30.6 |
338 |
|
White |
9.1 |
27.5 |
314.4 |
Table 3: Diabetes and obesity rates among the population of Massachusetts [23].
Different reviewed studies [3,6-8] report that the lack of access to good food, transportation, and health insurance are the major causes of health issues for the Black and Hispanic populations. A major goal of this study is to explore how we can turn the food deserts into healthy and nutritious food environments through the implementation of vertical and urban agriculture to address the health disparity among the minority population.
In order to explore the possibility of the implementation of vertical and urban agriculture, we used the number of household building units in the selected areas under study to estimate the acreage of the areas for vertical and urban agriculture [24].
Table 4 provides the information regarding the number of household building units in the Greater Springfield Area [24].
|
City |
Number of Household Building Units |
|
Agawam |
11,577 |
|
Chicopee |
23,732 |
|
East Longmeadow |
6,008 |
|
Holyoke |
15,122 |
|
Longmeadow |
5,811 |
|
Springfield |
58,448 |
|
West Springfield |
12,691 |
|
Total Number of Household Units |
133,389 |
Table 4: Number of household units per each city/town of the Greater Springfield Area.
For the areas under study, we selected four types of crops: kale, tomatoes, green beans, and broccoli that have nutritional values and can be grown in Massachusetts. Based on the data from the Northeast Regional Field Office of the U.S. Department of Agriculture, the selected crops can be produced in the State of Massachusetts [25].
Table 5 presents the yield per pound of each selected vegetable per acre of land. The calculation of the yield per pot of about 1.21 square feet is also presented in Table 6 [25].
|
Vegetable |
Yield/Acre |
Yield/Pot (1.21 sq ft) |
|
Kale |
12,940 lb |
0.3594 lb |
|
Tomatoes |
11440 lb |
0.3178 lb |
|
Green Beans |
2740 lb |
0.0761 lb |
|
Broccoli |
2,950 lb |
0.0819 lb |
Table 5: Vegetable yield in Massachusetts: tomatoes, kale, green beans, and broccoli.
Table 6 provides information as to the price and the number of seeds per pack for each selected vegetable and the distance that is needed for planting them. The price information was provided to us by a plant garden shop in the City of Springfield [26].
|
Product |
Number/ Plant Pack |
Price/Pack |
Planting Distance/Inches |
Sq Foot/Plant |
|
Kale |
6 |
$3.77 |
24 |
|
|
Cherry Tomatoes |
6 |
$3.77 |
18-24 |
|
|
Green Beans |
4 |
$3.77 |
24 |
|
|
Broccoli |
6 |
$5.98 |
16-18 |
Table 6: Number and price per package of seeds and the required planting distance per selected vegetable.
Method
In this study, Monte Carlo simulation is used to estimate one-year cost, yield, and environmental impact for growing cherry tomatoes, kale, green beans, and broccoli. Monte Carlo simulation allows utilization of several independent variables to predict a range of the outcomes. Monte Carlo simulation has been used in several research studies regarding vertical and urban agriculture and other agriculture-related research [27-29].
Chen et al. [27] used Monte Carlo simulation to calculate the harvest in farm areas that could be small or have different and irregular shapes in China. According to the authors, the results based on utilization of the simulation indicate accurate information regarding the harvest in the studied areas [27]. Racz and Benedek [28] assessed the risks of investments in pieces of land in Romania, copying the cultivation standards of Western Europe using Monte Carlo simulation. According to the authors, using Monte Carlo simulation allows analysis of complex random systems and provides a mathematical modeling of the variables under study [28]. Martin [29] studied the U.S. soybean farmers and their options due to uncertainties related to soybean export and exploring the corn cultivation. The author utilized Monte Carlo simulation to develop strategies using different uncertain variables, such as weather, risk, and tariffs [29]. The results of the Monte Carlo simulation provided information for the farmers as far as planning for the cultivation [29].
In this study, Monte Carlo simulation provides an appropriate model considering several independent and random variables, such as yield for cherry tomatoes, kale, broccoli, and green beans. The code used for the simulation is available [30-33]. The assumptions used in the analyses include:
- The surface area of 0.23 acres per household building unit was leveraged for vertical agriculture for the analysis.
- Community areas in and around the buildings and Greater Springfield Area are assumed to be used for urban farming at a 10% to 20% rate. These estimates are intended to be conservative so as not to underestimate yield and overestimate costs.
- Yield calculations for each plant are considered to be normally distributed based on empirical mean data presented in Table 5 for traditional farming with the standard deviation equal to 20% of the mean. A multiplier for vertical farming of (3,5) is applied to the building surface area used, as this is a highly conservative estimate suggesting 3 to 5 times the yield for vertical farming versus traditional agricultural methods. The Statista Research Department suggests that this multiplier should be as high as 10 [34].
- The costs were modeled as a uniform distribution with the minimum set at the costs presented in Table 6, and due to the expected inflation, the costs were set at 20% higher.
- Carbon emission (CO2) pounds per kilogram equivalent is about 0.31 [35] and assumed to be distributed normally with a standard deviation equal to 0.1. Yield in pounds is converted to kilograms (0.45 pounds per kilogram) for this calculation.
- Water (H2O) consumption is estimated to be uniform for each crop [36].
Results
Descriptive Statistics
On average, 0.23 acres per household building unit (30,679.47 acres total) were leveraged for vertical farming over all calculations, while an additional of approximately 1,721 acres of community area (vacant space in and around buildings) were assumed to be cultivated. Planting solely cherry tomatoes produced a mean annual yield of 24.6 million pounds. For green beans, broccoli, and kale, these values were 8.6 million pounds, 6.3 million pounds, and 27.8 million pounds, respectively.
Average annual CO2 emissions for cherry tomatoes, green beans, broccoli, and kale were estimated to be 3.4 million pounds, 1.2 million pounds, 884 thousand pounds, and 3.9 million pounds, respectively. The average CO2 across possible crop options was 0.586 million pounds. Estimated annual H2O usage was 8.3 million gallons, 2.9 million gallons, 2.1 million gallons, and 9.4 million gallons for these plants, respectively.
Estimated Mean Yield Results
Yields for the used surface area are 3 to 5 times higher than would be expected from traditional agriculture. Yields per iteration and the means are shown in the panel series, Figure 1. In all images, the 95th percentile confidence limits are shown in blue (upper) and red (lower).
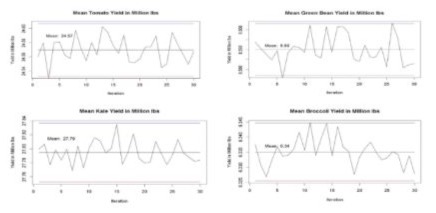
Figure 1: Estimated Yields for Selected Vegetables.
Figure 2 illustrates both the CO2 and H2O estimates across all plant types. The carbon footprint and water consumption are estimated to be much lower than traditional farming.
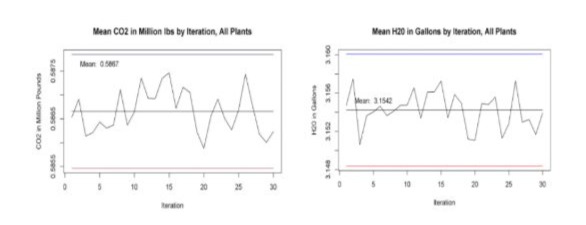
Figure 2: CO2 and H2O estimates.
The next panel series provides the cost estimates (Figure 3). Green beans are the most expensive option due to planting distance requirements and cost per plant ($3.77/4), nearly a dollar on average.
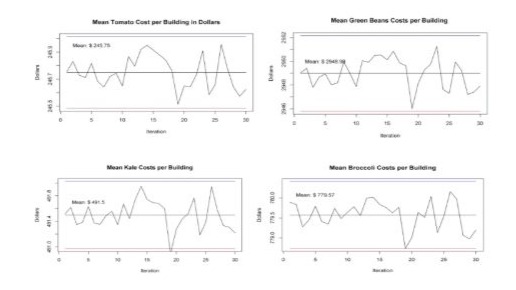
Figure 3: Per-building plant costs for each product.
Table 7 provides results of the analyses for the selected product yield in millions of pounds (lb) versus product costs.
|
Product |
Mean Yield (mi lb) |
Cost/ Building |
|
Kale |
27.70 |
$491.5 |
|
Cherry Tomatoes |
24.57 |
$245.75 |
|
Green Beans |
8.59 |
$2948.98 |
|
Broccoli |
6.34 |
$779.57 |
Table 7: per million pounds and the estimated cost.
As indicated in Table 7, the yield per selected vegetable is high, and the price per pound is very low.
Table 8 indicates nutritional values, calcium, vitamin C, iron, and potassium per 100 grams of the selected vegetables [35] and cherry tomatoes [36].
Vegetable/100gr | Calcium | Iron | Potassium | Vitamin C | Protein |
Kale | 210mg | 1.9mg | 500mg | 95mg | 4.3g |
Cherry Tomatoes | 10mg | 0.27mg | 237mg | 12.7mg | .88g |
Green Beans | 40mg | 0.5mg | 250mg | 10mg | 2.0g |
Broccoli | 105mg | 1.3mg | 464mg | 80mg | 3,3g |
Table 8: Nutritional values - calcium, vitamin C, iron, and potassium - per 100 grams of the selected vegetables.
As presented in Table 8, the selected vegetables can provide high amounts of essential minerals, potassium, iron, and calcium that are very important for health and proper bodily functions in addition to vitamin C.
Calcium is an essential mineral for the health of bones and teeth in addition to blood vessels, muscle building, blood pressure, and other bodily functions [37]. Iron is an important mineral for tissue building, and it is part of hemoglobin that is essential for oxygen transportation in the body [37]. Potassium is essential for the healthy function of muscles, cells, and the nervous system. In addition, potassium supports regular heart pace and digestion [37]. Vitamin C is essential for the health of the muscles and tissues, and it is an antioxidant. Vitamin C is very important in healing the wounds [38].
Table 9 provides the amount of the same minerals and vitamin C in the selected fast food items that are easily available in the food desert areas [37] and potassium for hot dogs [36].
|
Product/100gr |
Calcium |
Iron |
Potassium |
Vitamin C |
Protein |
|
Hot dogs |
78mg |
1.5mg |
146mg |
10mg |
10.2g |
|
French Fries |
10mg |
0.9mg |
700mg |
3mg |
4.5g |
|
Cola |
5mg |
0.1mg |
0mg |
0mg |
0.0g |
|
Cookies |
45mg |
0.7mg |
112mg |
0mg |
7.9g |
|
Potato Chips |
35mg |
1.7mg |
1,300mg |
8mg |
5.5g |
Table 9: The amount of calcium, vitamin C, iron, and potassium per 100 grams of the easily available foods in the food desert areas.
As indicated in Table 9, all the selected items provide a source of calcium. The amount of iron per 100 grams of hot dogs, French fries, cola, cookies, and potato chips is low (0.1mg - 1.7mg). Table 10 shows that the selected fast food items indicate potassium levels between 1,300 and 343 milligrams, except for cola. The potassium content of hot dogs, French fries, cookies, and potato chips is high, except for cola, which has no potassium content. Cola and cookies have zero vitamin C content. Hot dogs, French fries, and potato chips contain some amount of vitamin C, but much less than kale, green beans, and broccoli. Cola has the lowest nutrients essential for a healthy diet.
The next table, Table 10, shows the amount of other minerals and ingredients, sodium, lipids, sugar, and cholesterol, per 100 grams of the selected vegetables [35,36].
|
Vegetable/100 gr |
Sodium |
Fat |
Sugar |
Cholesterol |
|
Kale |
40mg |
0.9g |
0.0g |
0.0mg |
|
Cherry Tomatoes |
5mg |
0.2g |
2.63g |
0.0mg |
|
Green Beans |
2mg |
0.2g |
0.0g |
0.0mg |
|
Broccoli |
13mg |
0.2g |
1.5g |
0.0mg |
Table 10: The amount of sodium, fat, carbohydrates, sugar, and cholesterol per 100 grams of selected vegetables.
As indicated in Table 10, the amount of sodium per 100 grams of the selected vegetables ranges from 0.05 to 282 milligrams, which is very low. The daily consumption of sodium should be less than 2,300 milligrams per day [38]. As shown in Table 10, the levels of lipids and sugar are also low, and none of the selected vegetables contains any cholesterol; that is an important nutritious fact.
Table 11 indicates the amount of sodium, lipids, sugar, and cholesterol per 100 grams of the easily available fast foods in the food desert areas [38].
|
Product/100 gr |
Sodium |
Fat |
Sugar |
Cholesterol |
|
Hot dog |
860mg |
11.4g |
0.0g |
45mg |
|
French Fries |
40mg |
16.0g |
1.5g |
10mg |
|
Cola |
3mg |
0.0g |
11g |
0mg |
|
Potato Chips |
450mg |
39.5g |
2.6g |
0mg |
|
Cookie |
442mg |
23.7g |
10.0g |
72mg |
Table 11: The amount of sodium, lipids, sugar, and cholesterol per 100 grams of the easily available foods in the food desert areas.
As shown in Table 11, 100 grams of hot dogs, French fries, potato chips, and cookies all have a high amount of sodium, much more than 100 grams of kale, cherry tomatoes, and broccoli. Sodium is necessary for bodily function, nerves, and muscles. However, a high volume of sodium in food can result in high absorption of water, resulting in high blood pressure and heart attack in addition to damaging other organs [39].
In addition, the lipid content of the selected products, except cola, is high. Cola and potato chips contain high sugar levels. In comparison, the selected vegetables do not contain any cholesterol, while hot dogs, French fries, and cookies are high in cholesterol. As indicated in Table 11, the fast foods with high levels of sodium, lipids, sugar, and cholesterol can all contribute to obesity, diabetes, and heart attacks.
If we make a lunch menu from the selected vegetables and food items, the levels of lipids, sugar, cholesterol, and sodium are very different. As presented in Table 12, a meal of 100 grams of three of the selected fast food items, hot dog, French fries, and a cookie, will contain 1,342 milligrams of sodium, 51.1 grams of fat, 11.5 grams of sugar, and 127 milligrams of cholesterol. While making a salad of 100 grams of three of the selected vegetables, kale, cherry tomatoes, and broccoli will contain 85 milligrams of sodium, 2.0 grams of fat, 2.63 grams of sugar, and zero cholesterol.
|
Menu/100 gr |
Sodium |
Fat |
Sugar |
Cholesterol |
|
Hot dogs |
860mg |
11.4g |
0.0g |
45mg |
|
French Fries |
40mg |
16.0g |
1.5g |
10mg |
|
Cookie |
442mg |
23.7g |
10.0g |
72mg |
|
Total |
1,342mg |
51.1g |
11.5g |
127mg |
|
Menu/100 gr |
Sodium |
Fat |
Sugar |
Cholesterol |
|
Kale |
40mg |
0.9g |
0.0g |
0.0mg |
|
Cherry Tomatoes |
5mg |
0.2 g |
2.63g |
0.0 mg |
|
Broccoli |
13mg |
0.2g |
1.5g |
0.0mg |
|
Total |
58 mg |
1.3 g |
4.13 g |
0.0 g |
Table 12: The menu for a meal made of 100 grams of three of the selected vegetables and 100 grams of three of the selected fast food items.
High levels of sodium, fat, sugar, and specifically cholesterol for a meal made of 100 grams of the easily available selected fast food versus a salad made of 100 grams of the selected vegetables are obvious. High levels of sodium, fat, sugar, and cholesterol are major causes of high blood pressure, obesity, diabetes, and heart attack, which, based on the discussed research, impact the minorities at a higher rate than the white population.
Conclusion
Vertical and urban agriculture can address the health issues in poor neighborhoods across the globe in the developed and emerging countries. According to World Economic Forum [40], the farmlands across the globe use 70% of the world’s water for the crops. With the global increase in the world population, more crowded urban areas, and global warming, vertical and urban agriculture can have a positive impact by enhancing the health and the welfare of the populations and decreasing the CO2 emissions and water usage in communities across the globe.
As discussed previously, heart attack, obesity, and diabetes are major causes of death in the U.S., with a higher rate among the Black, Latino, and Hispanic populations. The selected food items, hot dogs, French fries, potato chips, cola, and cookies, are readily available in the convenience stores and fast food restaurants in different food desert urban neighborhoods.
The novel approach to deal with the food deserts in our study is to use the number of buildings in the areas under study and the estimates of the community lands for urban and vertical agriculture to provide the estimates of the amount of harvests regarding the selected healthy vegetables. In addition, the results of our study provide nutritional contents of some of the most readily available fast food items in urban, highly populated areas versus the nutritional values of selected vegetables. Furthermore, the results of this study provide the nutritional values of a meal of 100 grams of the selected fast food items and the healthy vegetables that manifest the nutritional differences between a meal made of these food items. The results of this research provide a solution in addressing the food insecurity in the food desert communities.
To address these socio-economic barriers and make the food deserts green, we need to create Private-Public Partnerships (PPPs). Different official community agencies and non-governmental organizations (NGOs) need to develop plans, policies, and strategies to turn the food desert areas into vertical and urban agriculture and green areas. In addition, through educational and training programs for the community, we need to be able to grow healthy and nutritious vegetables on the side of the buildings, on top of the buildings, and in front of the buildings.
Future Research
With a growing global population, specifically in the emerging countries, future research should explore the idea of vertical and urban agriculture in different communities. In addition, more studies are needed to examine different types of vegetables for their minerals, vitamins, and nutritional content to ensure the health and welfare of the population across the globe for the years to come. Future studies are needed to focus on how to develop private-public partnerships among different governmental and private agencies. Schools and universities can be the starting points for providing education and cultivating the lands in the schools and universities with the involvement of the students. Such partnerships need to be developed to overcome the costs and other barriers to turning the food deserts into green areas and contribute to the health and the welfare of different communities across the globe.
References
- Walker, R.; Keane, C. R.; Burke, J. G. Disparities and access to healthy food in the United States: A review of food deserts literature. Health & Place, 2010 (16). DOI: 10.1016/j.healthplace.2010.04.013.
- James, P., Arcaya, M. C., Parker, D. M.; Tucker-Seeley, R. D.; Subramanina, S. V. Do minority and poor neighborhoods have higher access to fast-food restaurants in the United States? Helath & Place, 2014 (29). doi: 10.1016/j.healthplace.2014.04.011.
- Hendrickson, D.; Smith, C.; Eikenberry, N. Fruit and vegetable access in four low-income food deserts communities in Minnesota. Agriculture and Human Values, January 2006: 23(3). DOI: 10.1007/s10460-006-9002-8.
- Gordon, C.; Purciel-Hill, M.; Ghai, N. R.; Kaufman, L.; Graham, R.; Van Wye, G. Measuring food deserts in New York City's low-income neighborhoods. Health & Place, 2011 (17). https://doi.org/10.1016/j.healthplace.2010.12.012.
- Kolak, M.; Bradley, M.; Block, D. R.; Pool, L.; Garg, G.; Kelly Toman, C.; Boatright, K.; Lipiszko, D.; Koschinsky, J.; Kershaw, K.; Carnethon, M.; Isakova, T.; Wolf, M. Urban foodscape trends: Disparities in healthy food access in Chicago, 2007–2014. Health & Place, 2018 (52). https://doi.org/10.1016/j.healthplace.2018.06.003.
- McPhail, D.; Chapman, G. E.; Beagan, B. L. The rural and the rotund? A critical interpretation of food deserts and rural adolescent obesity in the Canadian context. Health & Place, 2013 (22). doi: 10.1016/j.healthplace.2013.03.009.
- Trembošová, M.; Jakab, I. Spreading of food deserts in time and space: The case of the city of Nitra (Slovakia). Sustainability, 2021, 13(13). doi.org/10.3390/su13137138.
- Helbich, M.; Schadenberg, B.; Hagenauer, J.; Poelman, M. Food deserts? Healthy food access in Amsterdam. Applied Geography, 2017 (83). doi.org/10.1016/j.apgeog.2017.02.015.
- CDC National Center for Health Statistics. Health, United States, 2023. https://www.cdc.gov/nchs/hus/topics/heart-disease-deaths.htm.
- U.S. Department of Huma Services Office of Minority Heath. 2019. https://minorityhealth.hhs.gov/heart-disease-and-african-americans
- De Anda, J.; Shear, H. Potential of vertical hydroponic agriculture in Mexico. Sustainability, 2017, 9 (1). DOI: 10.3390/su9010140.
- McLaina, R.; Poea, M.; Hurley, P. T.; Lecompte-Mastenbrookc, J.; Emery, M. R. Producing edible landscapes in Seattle’s urban forest. Urban Forestry& Urban Greening, 2012 (11). doi.org/10.1016/j.ufug.2011.12.002.
- Tanoh, V.; Hashemi-Beni. L. Spatial analysis of socioeconomic factors contributing to food desert in North Carolina. Sustainability 2023, 15(10), 7848; doi.org/10.3390/su15107848.
- Steenkamp, J.; Cilliers, E. J.; Cilliers, S. S.; Lategan, L. Food for thought: Addressing urban food security risks through urban agriculture. Sustainability, 2021, 13 (3). doi.org/10.3390/su13031267.
- Benedetta, F; Mekki Awouda A. H.; Grasso, N.; Bruno, G.; Chiabert, P.; Lombardi, F. An evaluation of research interests in vertical farming through the analysis of KPIs adopted in the literature. Sustainability 2024, 16(4), 1371. https://doi.org/10.3390/su16041371.
- Siregar, R. R.A.; Seminar, K.B.; Wahjuni, S.; Santosa, E. Vertical farming perspectives in support of precision agriculture using artificial intelligence: A review. Computers 2022, 11(9), 135. https://doi.org/10.3390/computers11090135.
- Al-Kodmany, K. The vertical farm: A review of s\developments and implications for the vertical city. Buildings 2018, 8(2), 24. https://doi.org/10.3390/buildings8020024.
- Besthorn, F. H. Vertical farming: social work and sustainable urban agriculture in an age of global food crises. Australian Social Work, 2013 66(2). https://doi.org/10.1080/0312407X.2012.716448.
- Benke, K.; Tomkins, B. Future food-production systems: Vertical farming and controlled- environment agriculture. Sustainability: Science, Practice and Policy 2017, 13(1).
- United States Census Bureau: https://www.census.gov/quickfacts/. Accessed November 2024.
- Mass.gov: Massachusetts Diabetes Data. 2024. https://www.mass.gov/info-details/massachusetts-diabetes-data?_gl=1*1wajh8i*_ga*NzkyNDg4NDE0LjE3MjA2MTQ3OTQ.*_ga_MCLPEGW7WM* MTcyMDg3MTMxNi41LjEuMTcyMDg3MjA4My4wLjAuMA. Accessed November 2024.
- Mass.gov. 2024. Massachusetts Obesity Statistics. https://www.mass.gov/info-details/massachusetts-obesity-statistics?_gl=1*152ms9o*_ga*NzkyNDg4NDE0LjE3MjA2MTQ3OTQ.*_ga_MCLPEGW7 WM*MTcyMjYxNDgxNi4xNC4xLjE3MjI2MTUyNjkuMC4wLjA. Accessed November 2024.
- Mass.gov. Mortality. 2021. https://www.mass.gov/info-details/mortality. Accessed November 2024.
- United States Census Bureau, 2023. https://www.census.gov/quickfacts/fact/. Accessed November 2024.
- United States Department of Agriculture: National Agricultural Statistics Services: Northeast Regional Field Office: U.S. Department of Agriculture: https://www.nass.usda.gov/Statistics_by_State/New_England_includes/Publications/CurrentNews_Release/2022/Feb2022-New-England-Vegetable-Report.pdf. Accessed November 2024.
- Sixteen Acres Garden Center, Springfield, MA. The information was provided by the Sixteen Acres Garden Center. 2023.
- Chen, M., Jin, C., Yang, T., and Liu, Z. A real-time measurement method and system for the harvesting area of a grain combine harvester. Sustainability 2023, 15(17), 12852; https://doi.org/10.3390/su151712852
- 28. Racz, B-G and Benedek, B. The use of Monte Carlo simulation in the assessment of an agricultural investment. Forum on Economics and Business. 2016/2, 9 (127), 79–112.
- 29. Martin, M. Uncertainty at the farm–level: Monte–Carlo simulations for farm planning. Office of Economics. Working Paper 2020–05–E, May2020. ttps://www.usitc.gov/publications/332/working_papers/monte_carlo_ 2020-05-e.pdf
- Vertical Ag. RPubs. https://rpubs.com/R-Minator/VertAg2
- Yield for indoor and outdoor farming worldwide 2015, by crop type. Statista Research Department, Sep 12, 2016. https://www.statista.com/statistics/752128/average-yield-for- indoor-and-outdoor-farming-worldwide-by-crop-type/
- Amidi-Abraham, D. Calculating the carbon footprint of vertical farming and traditional farming. Agriculture, Feb 18, 2021. https://agritecture.medium.com/calculating-the-carbon- footprint-of-vertical-farming-and-traditional-farming-e36ff5245d5f.
- The current water crisis and the need for alternative farming solutions. Sustainability & Food Security – Vertical Farming, Eden Green Technology, Oct 25, 2023. https://www.edengreen.com/blog-collection/water-crisis-drought.
- Tasgal, P. The economics of local vertical & greenhouse farming are getting competitive. AFN, April 3, 2019. https://agfundernews.com/the-economics-of-local-vertical-and- greenhouse-farming-are-getting-competitive.
- Nutrition table.com. 2024. https://www.nutritiontable.com/nutritions/. Accessed November 2024.
- Fatsecrets, United Kingdom, 2024. https://www.fatsecret.co.uk/calories-nutrition/ . Accessed November 2024.
- Definitions of health terms: Minerals. Medline Plus, March 2, 2022. https://medlineplus.gov/definitions/mineralsdefinitions.html.
- Vitamin C. National Institute of Health Office of Dietary Supplements, March 26, 2021. https://ods.od.nih.gov/factsheets/VitaminC-HealthProfessional/
- Nutrition Education Resources & Materials. Sodium in your diet. March 5, 2024. https://www.fda.gov/food/nutrition-education-resources-materials/sodium-your-diet
- World Economic Forum. How vertical farming can support food security. June 20, 2023. https://www.weforum.org/stories/2023/06/how-vertical-farming-can-save-water-and-support-food-security/
© by the Authors & Gavin Publishers. This is an Open Access Journal Article Published Under Attribution-Share Alike CC BY-SA: Creative Commons Attribution-Share Alike 4.0 International License. Read More About Open Access Policy.