Tumour Volume Analysis Applied to Clinical Oncology
by Angus B Gordon*, Suzy Cleator, Daniel Leff, Adrian Lim
Imperial College Healthcare Trust, Fulham Palace Road London W6 8RF, England, UK
*Corresponding author: Angus B Gordon, Imperial College Healthcare Trust, Fulham Palace Road London W6 8RF, England
Received Date: 02 October 2025
Accepted Date: 08 October 2025
Published Date: 10 October 2025
Citation: Gordon AB, Cleator S, Leff D, Lim A (2025) Tumour Volume Analysis Applied to Clinical Oncology. J Surg 10: 11464 https://doi.org/10.29011/2575-9760.011464
Keywords : Breast Cancer; Imaging; Tumor Volume
Introduction
The relationship between the diameter and volume of a sphere is complex and variable, it depends on the size increasing or decreasing and the extent of those changes. Longest Diameter (LD) Partial Response is -30% but is a -66% volume reduction and LD Progressive Disease +20% is a +73% volume increase (Figure 1).The volume of a sphere is calculated as V= 4/3 x Pi x radius cubed, 4/3 and 22/7 (Pi) are both constants, which multiplied = 4.188790 to six decimal places, to avoid the mathematical Propagation of Errors. An eight fold increase in volume occurs when the diameter is doubled. As most clinical tumours are an irregular mass not a sphere, the formula is modified with the radii a,b,and c where the diameters are 2A, 2B and 2C. Figure 1 and Figure 2 illustrate the scale of increasing or decreasing the diameter and volume. Tumour Volume Analysis (TVA) is a novel method of measuring tumour size, by three diameters in cubic centimetres [1]. Changes in tumour size are measured using the same percentages of the Longest Diameter (LD) as Response Evaluation Criteria In Solid
Tumours (RECIST), Partial Response (PR) >-30% , Progressive Disease (PD) >+20% and Stable Disease (SD) in between <-30% and <+20% [2]. Standardisation between RECIST and TVA is met as required in RECIST 1.1 [3]. The purpose of this study is to examine patient responses to treatment, using both RECIST and TVA methods. In particular to observe the differences this makes, to the clinical management of patients.
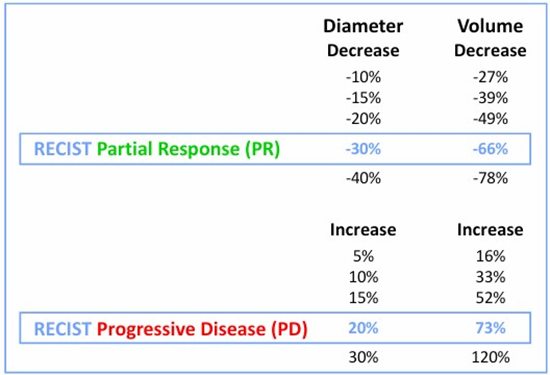
Figure 1: RECIST Relationship between Diameter and Volume.
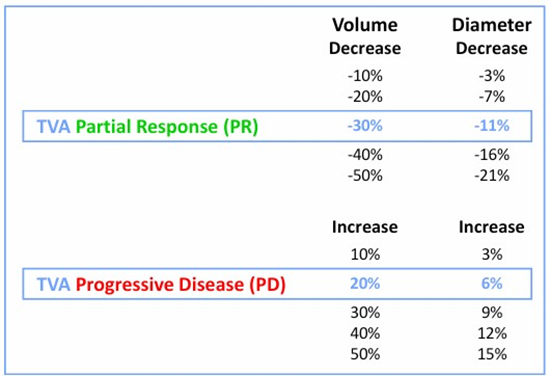
Figure 2: TVA Relationship between Volume and Diameter.
Method
All mathematical calculations have been made with the TuVol© algorithm,available through Googleplay ‘TuVol app’ © for Android mobile cellphones only. $5 U.S. The app is not available through Apple store iPhones. The pilot study of patients who underwent neoadjuvant breast cancer treatment, using RECIST with LD measurements and TVA, with three diametric measurements. Twenty eight eligible patients in the NEOCENT trial [4] were randomised to either 6 cycles of Chemotherapy or about 150 days of Letrozole treatment ( Ct 12 and En 16). According to TVA , RECIST miscategorised 7 of 28 patients (25%). The next study was of 145 patients ( San Fran + ICHT) who underwent baseline breast Magnetic Resonance Imaging (MRI), neoadjuvant chemotherapy (NACT), presurgical MRI, surgery and calculated LD and volume from all MRI examinations [1]. In this investigation a total of 173 patients 28 [4] and 145 [1], were included. The figure of 173 was reduced by 135 ,as these patients had similar RECIST and TVA response categories. This left the focus on the remaining 38 patients with different response categories (Tables 1,2).
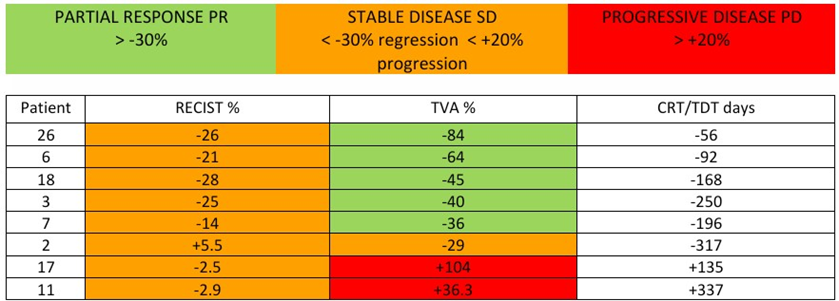
Table 1: Data 0f 8 from 28 patients NEOCENT Trial as the Pilot study Chemotherapy (12) Endocrine (16) that
show diameter and volume percentage changes in both RECIST and TVA terms.
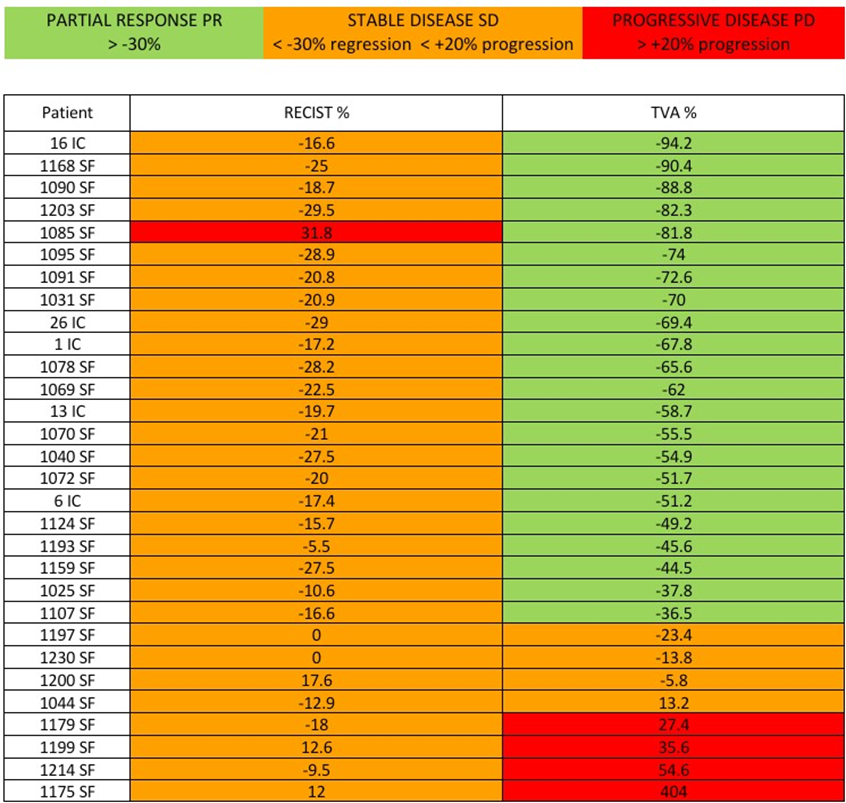
Table 2: Data of 30 from 145 patients University of California at San Francisco (SF 105) and Imperial College
Healthcare Trust (IC 40) that show diameter and volume percentage changes in both RECIST and TVA terms.
Results
The eight NEOCENT patients (8/28=28%) are shown in Table 1 with four columns; Treatment , four Chemotherapy (Ct) or four Endocrine treatment (En); Patient number; RECIST %; TVA%. Five patients were SD- by RECIST, but PR by TVA. One patient was SD+ by RECIST, but SD- by TVA. Two patients were SD- by RECIST, but PD by TVA. The thirty ( San Francisco + Imperial College Healthcare Trust (ICHT) patients (30/145=21%) are shown in Table 2 with three columns; Patient number; RECIST%; TVA%.Twenty one patients were SD- by RECIST, but PR by TVA. Two were SD- by RECIST, but PD by TVA. Two were SD0 neutral by RECIST but SD- by TVA. Two were SD+ by RECIST, but PD by TVA. One was SD+ by RECIST, but SD- by TVA and one was SD- by RECIST and SD+ by TVA. Importantly one was PD by RECIST, but PR by TVA.
Table 1 Eight patients RECIST, SD- TVA, PR =5. RECIST, SD- TVA, PD=2. RECIST, SD+ TVA, SD- =1 Summary. Sorted by RECIST. PR=Nil : SD- =7: SD+ =1 PD=Nil Sorted by TVA. PR=5: SD- =1: PD=2 Outcome of 28/28 patients PR by RECIST -44% and by TVA -81% p<0.0001 [5]
Table 2 Thirty patients RECIST, SD- TVA, PR =21: RECIST, SD- TVA, PD=2: RECIST, SD+ TVA, SD- =1: RECIST, SD0 TVA, SD- =2 : RECIST, SD+ TVA, PD =2: RECIST, SD- TVA, SD+=1: RECIST,PD TVA, PR=1.
Summary. Sorted by RECIST. PR=Nil: SD- =24: SD+ =3: SD0 =2: PD=1. Sorted by TVA. .PR=22: SD- =3: SD+ =1: PD=4
Outcome of 173 patients ,comparison of 30% PR on RECIST with 30% PR on TVA. RECIST : n=123 responders, Median = -57.1% (IQR: -75.7 to -43.5) TVA: n=150 responders, Median =
-89.7% (IQR: -97.6 to -74.8) Wilcoxon signed rank test p<0.0001 [1} Supplementary material Appendix A.1 The TVA advantages are, that patients are allocated to the appropriate response group and tumour size is correctly estimated. Conversely RECIST overestimates tumour size unless it is a sphere and underestimates both the treatment benefit and progression in PD [6,7]. Patient SF 1085 was PD +31.8% by RECIST but -81.8% PR by TVA, which is explained by the treatment causing a tumour change in shape, with a larger LD but much smaller lesser axes.. The baseline diameters in millimetres were 22x20x20=Volume 36.8 cubic centimetres and 22 the LD. After treatment the presurgical diameters were 29x11x 5=Volume 6.7 cubic centimetres and 29 the LD. The RECIST LD difference was 22 to 29 =+7 = +31.8% (PD). The TVA volume difference was 36.8 to 6.7= -30.1=.-81.8% (PR). Two patients SF1197 and SF1230 both calculated as a zero by RECIST but as SD - minus range by TVA ,which is accepted as similar in most cases. Some patients may progress to SD+, these subtle changes may develop over time and so become apparent with follow up imaging. All calculations in this series are based on a single measurement and so those two patients (SF1197 and and SF1230) are nominated as neutral/zero. Patients with PR and SD minus range are showing a benefit to treatment and should continue the current medication. .A change in treatment could be considered in SD plus range, as there is an increase in volume, e.g. a 5% volume enlargement equates to a 16% increased diameter. TVA identified six cases that were PD but SD by RECIST, these patients would be recommended to alter treatment, two patients in Table 1 appeared to have primary endocrine resistance to Letrozole. TVA identified the cases that progressed 7/173 = 5.8%. Seven patients were resistant to adjuvant medical treatment six were PD (range +27.4% to +404% ) one patient was SD+ ( +13.2%). An interval MRI, after about 5 or 8 weeks, is suggested to detect any evidence of progression.
Limitation of this study. Table 1 patients volume calculations were made by hand held ultrasound measurements in 3 planes. Table 2 patients volume calculations were made from MRI linear measurements in three planes sagittal, coronal, and axial.
Conclusion
- Measuring a solid mass by three diameters (TVA) is more accurate, more sensitive(100%) and stronger statistically( p<0.0001) than the longest diameter (RECIST) [1].
- This explains the different response categories and percentages of Tables 1 and 2, RECIST results in more SD cases, which most become PR but some become PD with TVA.
- The increase in PR categories with TVA demonstrates a treatment benefit to patients that was not apparent with RECIST. This could influence results in phases 2 and 3 of clinical trials.
- The SD patients have been split into minus and plus ranges. As demonstrated in Figure 1 and 2 any LD progression from SD+ 1-19% is associated with a larger volume increase. The SD- 1-29% range patients are demonstrating some response to treatment.The neutral group SD 0 could change with subsequent imaging, usually but not always to PR.
Acknowledgements: Stephen Kean. Science studio, TuVol algorithm © desk top calculator. Joshua Carlin. Android Googleplay TuVol app©. Copyright 30406051025S042.
References
- Gordon AB, Sheeka A, Cleator S, Leff D, Lim A, et al. (2025) Tumour Volume Analysis applied to imaging and histological examinations in breast cancer. Euro J Surg Onco 2025: 109578.
- Therasse P, Arbuck S, Eisenhauer E (2000) New guidelines to evaluate the response to treatment in solid tumours J. Natl Cancer Inst 92: 205-216.
- Eisenhauer E, Therasse P, Bogaerts J (2009) New Response Evaluation Criteria In Solid tumours: Revised RECIST Guideline, version1.1 Eur J Cancer 45: 229-247.
- Palmieri C, Cleator S, Kilburn LS (2014) NEOCENT: a randomised feasibility and translational study comparing neoadjuvant endocrine therapy with chemotherapy. Breast Cancer Res.Treat 148: 581-590.
- Gordon AB, Morden J, Lim A, Cleator S (2016) Tumour Volume Analysis TVA versus RECIST.
- Gordon AB, Lim A (2025) Tumour volume analysis TVA compared with RECIST J.Surg 10: 11348.
- Gordon AB, Cleator S, Leff D, Lim A (2025) Tumour Volume Analysis applied to the Residual Cancer Burden J.Surg 10: 11426.
© by the Authors & Gavin Publishers. This is an Open Access Journal Article Published Under Attribution-Share Alike CC BY-SA: Creative Commons Attribution-Share Alike 4.0 International License. Read More About Open Access Policy.