Tumour Volume Analysis applied to the Residual Cancer Burden
by Angus B Gordon*, Suzy Cleator, Daniel Leff, Adrian Lim
Imperial College Healthcare Trust, Fulham Palace Road London W6 8RF, England, UK
*Corresponding author: angusgordon123@btinternet.com
Received Date: 19 August 2025
Accepted Date: 25 August 2025
Published Date: 27 August 2025
Citation: Gordon AB, Cleator S, Leff D, Lim A (2025) Tumour Volume Analysis applied to the Residual Cancer Burden. J Surg 10: 11426 https://doi.org/10.29011/2575-9760.011426
Introduction
Tumour Volume Analysis (TVA) is a novel method of measuring tumour size and response to treatment. TVA is more accurate, more sensitive (100%) and statistically superior ( p<0.0001) to Response Evaluation Criteria In Solid Tumours (RECIST) [1]. The advantages of TVA (three diameters volume calculation) and disadvantages of RECIST (longest diameter only) have been reported [2]. Residual Cancer Burden (RCB) following Neo Adjuvant Chemotherapy (NACT), is determined by histological examination after surgical excision. This is considered the gold standard and can be correlated with MRI, where a good overall accuracy was found in 17 of 35 studies [3]. Although MRI was better than alternative methods, over and under estimation, of residual disease was reported [4]. RCB provides an indication of residual risk after NACT and prognostic information in all subtypes of breast cancer. The purpose of this study is to examine the volume based measurements of the RCB and presurgical MRI, additionally to compare the baseline and presurgical MRI volumes.
Method
Forty patients with histologically proven primary breast cancer, from Imperial College Healthcare Trust, were treated with NACT. Large tumours, young patients, those with involved lymph nodes, Grade 3 tumours and other indications were eligible for NACT .Those with Inflammatory and locally advanced cancers were excluded . All patients had three diameter volume calculations, in cubic centimetres, of the baseline and presurgical MRIs, sixteen patients had evidence of cancer on the presurgical MRI and confirmed on the surgical excision histological specimen. Two of the sixteen had scant isolated tumour cells only and were excluded as there was no measurable disease, leaving fourteen patients for analysis.
Four groups of RCB have been described, to stratify the degree of residual disease, with two cut off points, first RCB 111 versus RCB 1/11 and second RCB 1 versus RCB 11 [5].
RCB 0 = No Residual Disease
RCB 1 = Minimal Residual Disease
RCB 11 = Moderate Residual Disease
RCB 111 = Extensive Residual Disease
The greatest risk group is Hormone Positive/Her 2 negative at approximately 70% RCB-11 and RCB-111. The least risk at 20% of RCB-11 and RCB-111 is with Hormone negative/Her 2 positive. With approximately 40% RCB-11 and RCB-111, are the two remaining subtypes of Hormone negative with Her 2 negative and Hormone positive with Her2 positive. In that intermediate group, about 60 % are the pCR/RCB-0 cases [6]. It has been reported that event free survival is improved where there is an increase of pCR [6].
In this series, the volume of the RCB in cubic centimetres has been calculated from a single histologic Longest Diameter (LD), which results in a larger figure, unless the RCB is a sphere [2]. There is no retrospective classification of the RCB, into a Syman’s residual disease group,1,11,or 111 [5]. As no patient was reported as pCR (pathology Complete Response), so the measured LD in centimetres of fourteen patients, is included in the Table . The interval between the baseline and presurgical MRI was recorded in days, as part of the novel volume based parameter, Complete Response Time in days (CRT) as demonstrated. This formula allows for exponential changes in tumour size and assumes a constant rate of response (TuVol algorithm) [1].
Results
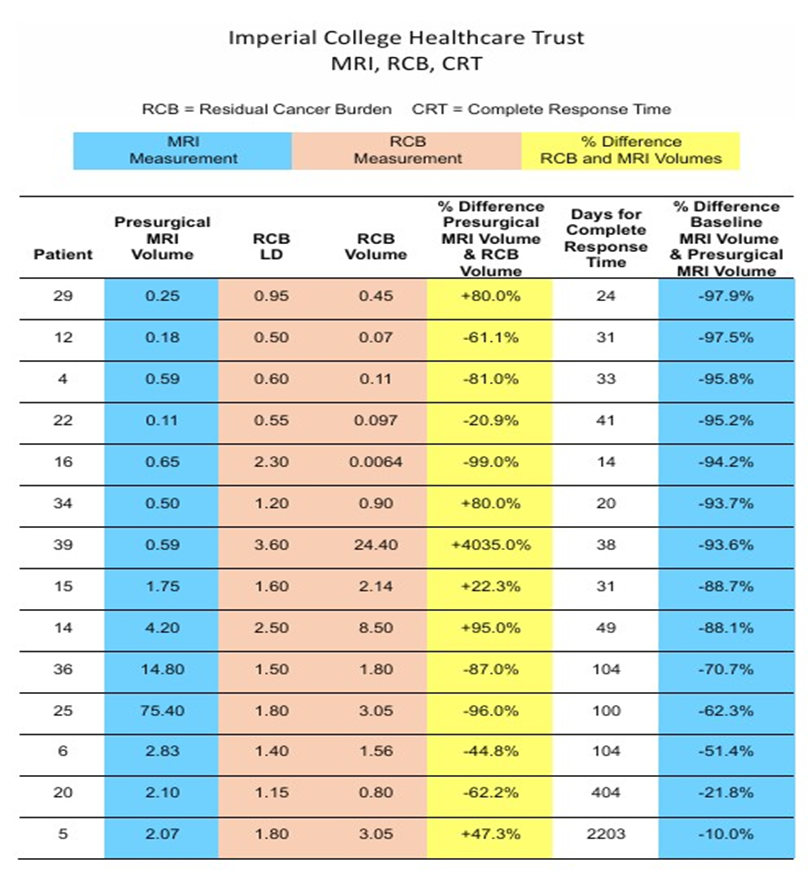
see Table. TVA utilises the same percentages for response as RECIST, that is >-30% Partial Response (PR), >+20% Progressive Disease (PD) and Stable Disease (SD) in between PR and PD.
As demonstrated in the Table,12 of 14 patients had a PR of >-30%, the last two 20 and 5 had response rates of <-21.8% and <-10.0% respectively, classified as SD. In eight patients 11426 DOI: 10.29011/2575-9760.011426 (4,16,25,36,20,12,6,and 22) the volume of the RCB was smaller than the presurgical MRI volume (range -20.9% to - 99.0%). In six patients (15,5,34,29,14 and 39) the volume of the RCB was larger than the presurgical MRI volume ( range +22.3% to +4,035.0%).
Patient. Age. Grade. Histology; Invasive Ductal Carcinoma, IDC/ Invasive Lobular carcinoma, ILC. Nodes, ER/PR, Her-2.
29. 49 G2. IDC. N-ve. ER+ve. HER-2+ve.
12. 62 G3. IDC. N-ve. ER+ve. HER-2-ve.
4. 74 G3. IDC. N-ve. ER-ve. HER-2+ve.
22. 58 G2. ILC. N-ve. ER-ve. HER-2-ve.
16. 73 G3. IDC. N-ve. ER-ve. HER-2+ve.
34. 44 G3. IDC. N-ve. ER+ve. HER-2-ve.
39. 47 G3. Medullary. N-ve. ER-ve. HER-2-ve.
15. 73 G3. IDC. N+ve. ER-ve. HER-2+ve.
14. 39 G2. IDC. N+ve. ER+ve. HER-2+ve.
36. 49 G3. IDC. N-ve. ER-ve. HER-2+ve.
25. 41 G1. Cribiform. N+ve. ER+ve. HER-2-ve.
6. 75 G2. IDC, N-ve. ER+ve. HER-2+ve.
20. 34 G2. IDC, N+ve. ER+ve. HER-2-ve.
5. 54 G2. IDC, N+ve. ER+ve. HER-2-ve.
Limitations of this study relate to RCB three diameter measurements. It was not possible to obtain the in vivo volume diameters of the pre treatment cancer as a baseline, to compare with the RCB.
Conclusion
- Measurement and comparison of the baseline MRI with the presurgical MRI volumes, stratifies patients into PR and SD response categories of TVA.
- There is a weak correlation between the volume of the presurgical MRI and the volume of the RCB. About 60 % (actual 57%)of patients had a larger MRI volume than RCB volume. About 40% (actual 43%) had a larger RCB volume than presurgical MRI volume.
- A strong correlation of the CRT with PR and SD response groups was noted.
References
- Gordon AB, Sheeka A, Cleator S, Leff D, Lim A (2025) Tumour Volume Analysis applied to imaging and histological examinations in breast cancer. Eur J Surg Oncol 51: 109578.
- Gordon AB, Lim A (2025) Tumour Volume Analysis TVA compared with RECIST. J Surg 10: 11348.
- Lobbes MB, Nelemans PJ (2013) Good correlation does not automatically imply good agreement. Eur J Radiol 83: e 906-e907.
- Lobbes MB, Prevos R, Smidt M (2013) The role of magnetic resonance imaging in assessing residual disease and pathologic complete response in breast cancer. Insights imaging 4: 163-175.
- Symans WF, Peintinger F, Hatzis C (2007) Measurement of residual cancer burden to predict survival after neoadjuvant chemotherapy. J Clin Oncol 25: 4414-4422.
- Symans WF, Yau C, Chen YY (2021) Assessment of residual cancer burden and event free survival in Neoadjuvant treatment in high risk breast cancer. JAMA Oncol 7: 1654-1663.
The median age of the 40 patients from the ICHT cohort was 47.5 years (range: 28-75 years), and the mean age ± standard deviation was 50.1±12.6 years. Of the 40 patients, 20 each underwent mastectomy and 20 wide local excision of the marked tumour bed. Moreover, 12 showed ER positive and HER2-positive phenotypes, whereas 11 had ER-negative and HER2-negative phenotypes. Ten patients showed ER-negative and HER2-positive phenotypes, 6 showed ERpositive and HER2-negative phenotypes, and 1 exhibited ER-positive and HER2-borderline phenotypes. Histopathological results indicated 36 cases of ductal carcinoma, 2 of lobular carcinoma, 1 of ductal carcinoma with lobular carcinoma, and 1 of medullary carcinoma.
© by the Authors & Gavin Publishers. This is an Open Access Journal Article Published Under Attribution-Share Alike CC BY-SA: Creative Commons Attribution-Share Alike 4.0 International License. Read More About Open Access Policy.