Enhancing Efficiency in Home-Based Subcutaneous Immunoglobulin Therapy: A Comparative Analysis of Supply Selection for Infusion Time Optimization
by Christopher J Pratt1, Brent Rutland2, Carleton Southworth2, Devin Wall2*
1CVS Specialty 2100 E. Lake Cook Rd. Buffalo, Grove, IL 60089, USA
2KORU Medical Systems, 100 Corporate Dr Mahwah, NJ 07430, USA
*Corresponding author: Devin Wall, KORU Medical Systems, 100 Corporate Dr Mahwah, NJ 07430, USA
Received Date: 29 July 2025
Accepted Date: 05 August, 2025
Published Date: 08 August, 2025
Citation: Pratt CJ, Rutland B, Southworth C, Wall D (2025) Enhancing Efficiency in Home-Based Subcutaneous Immunoglobulin Therapy: A Comparative Analysis of Supply Selection for Infusion Time Optimization. Int J Nurs Health Care Res 8: 1657. https://doi.org/10.29011/2688-9501.101657
Abstract
Background: Home-based subcutaneous immunoglobulin (SCIg) therapy is the standard of care for patients with primary immunodeficiency, offering convenience and cost-effectiveness. Optimizing infusion time is critical to improving patient experience, but comparisons of supply selections used in infusion protocols remain limited. Objective: This study aimed to evaluate and compare the performance of select supplies from two different subcutaneous infusion pump manufacturers (referred to as KORU and EMED) in optimizing infusion time for patients undergoing SCIg therapy. Method: Data from 103 patient protocols were analysed, with 97 using KORU devices and 6 using EMED devices. Infusion times were estimated using both original and optimized protocols for each brand’s supplies. Optimizations involved adjusting needle sites and tubing while ensuring adherence to drug dose and manufacturer-specified limits. Results: The KORU device protocols showed a significant reduction in mean infusion time, decreasing from 87.77 minutes to 41.04 minutes (p < 0.001), saving patients an average of 1 day, 15 hours, and 22 minutes annually. EMED protocols reduced infusion time from 125.00 to 64.80 minutes (p = 0.067), with an annual savings of 2 days, 5 hours, and 59 minutes. A second optimization for EMED protocols allowed for additional needle sites, further reducing infusion time. The difference in time reduction between KORU and EMED was statistically significant (p = 0.012). Conclusion: Optimization of infusion protocols can significantly reduce infusion time for patients. KORU devices demonstrated superior time saving compared to EMED devices. Further research is necessary to explore the factors influencing the differences in performance between the two systems.
Keywords: Subcutaneous; Infusion; SCIg; Immunoglobulin; Immunodeficiency
Introduction
Background/rationale
Home-based subcutaneous immunoglobulin therapy has been gaining popularity among patients with primary immunodeficiency. This treatment modality is trending toward being the standard of care for maintenance therapy for primary immunodeficiency diseases [1]. Patients choose this IgG administration route over intravenous administration due to several factors, including poor venous access, systemic adverse reactions to IV therapy, and patients with anti-IgA antibodies thought to be a risk factor for more severe generalized reactions [2]. Home-based subcutaneous therapy also reduces treatment cost [3,4,5]. In a 2023 study of Hizentra the estimated cost savings was $32,447 per annum per patient in the United Sates, compared to IVIG [6]. Subcutaneous home-based IgG treatment also provides quality of life benefits such as autonomy, participation, and perceived health [7,8].
Mechanical, non-programmable subcutaneous infusion pumps are frequently chosen for SCIg therapy due to their portability, ease of use, and the fact that they do not require an external power source, making them highly convenient for patients. These pumps rely on simple mechanical principles and, therefore, do not provide programmable control over infusion rates. Instead, clinicians must manage the infusion rate through external factors. Although powered, programmable pumps are chosen based on the clinical needs and preferences of a subset of patients on subcutaneous immunoglobulin therapy (i.e. pediatric patients prescribed low volume doses and patients generally expressing strong preference for even greater portability), non-programmable infusion pumps are most often chosen preferentially for the majority of patients [11].
A variety of elements affect the overall infusion rate when using non-programmable pumps, including the use of flow rate tubing (also known as fixed-rate tubing) or flow control devices. Additional factors such as atmospheric pressure, ambient temperature, tubing diameter, pump elevation, and the viscosity of the medication can all impact the infusion rate [13,14,16]. To aid clinicians in determining the optimal infusion protocol for each patient, manufacturers of mechanical infusion pumps have made flow rate data based on validated bench testing methods available to clinicians. This information allows clinicians to estimate infusion times based on the combination of medication properties, pump characteristics, and ancillary supplies like tubing and needle sets [15,17].
These validated flow rate data, publicly available, provide clinicians with nominal infusion rates derived from bench testing under controlled conditions [12]. Clinicians can use these tools to compare infusion times across different pumps and devices [15,17]. Given that SCIg infusions typically take 1 to 2 hours and are often required weekly or more, it is the responsibility of clinicians to select equipment that minimizes the infusion time without compromising patient outcomes, as reducing time burden is critical for patients with already significant medical needs [18].
In summary, reliable and accessible flow, rate data is essential to support pharmacy staff and clinicians in optimizing infusion protocols for patients receiving SCIg therapy. Such data must be designed and presented with relevance to specific clinical cases, allowing for selection of appropriate products tailored to each patient's therapy. This ensures that pharmacy staff can provide accurate, efficient infusion protocols without the barriers of limited product options or usability constraints. An intuitive and comprehensive interface helps streamline decision-making and minimizes manual flow rate calculations, thereby reducing clinician time burden, ensuring adherence to quality standards, and ultimately enhancing the patient’s infusion experience by optimizing or reducing the patient’s infusion time.
Objectives
The objectives of the study were to 1) evaluate and compare the effectiveness supply selection and infusion protocols for two subcutaneous infusion pumps, KORU and EMED, in optimizing infusion time for home-based subcutaneous immunoglobulin (SCIg) therapy in patients with primary immunodeficiency; 2) determine the extent to which infusion times could be reduced through protocol optimization by selecting alternate supplies; 3) assess the annual time savings achieved by optimizing protocols with the KORU and EMED infusion systems; and 4) explore any significant differences in the performance of the two systems when making supply changes, including the effect of adding additional needle sites during optimization. The Freedom60 and Freedom EDGE pumps, manufactured by KORU, are designed with a negator spring that applies a nearly constant force over the entire range of motion. The SCIg60 and Versa Pump devices, manufactured by EMED, are designed with a compression spring which applies greater force with greater levels of compression. It is theorized that since KORU pumps apply a nearly constant force to the syringe plunger during subcutaneous infusions, it will enable end-users of KORU’s system to achieve a greater degree of infusion time optimization when compared to EMED when selecting different combinations of infusion supplies.
Hypotheses
- Protocols optimized using the KORU infusion system would result in significantly shorter infusion times compared to those optimized using the EMED infusion system.
- Optimization of infusion protocols would lead to a significant reduction in infusion time across both systems.
- The KORU system would demonstrate superior performance in time optimization due to its simpler data interface input and the higher number of needle sites used in the original protocols.
Methods
Cross-sectional data were collected in the form of maintenance infusion protocols from active patients provided by a large specialty pharmacy in June of 2022. A total of 250 protocols were collected. Protocols utilizing exclusively KORU or EMED supplies (syringe driver, tubing sets, and needle sets) were included in the study to ensure that valid supply configurations corresponded with KORU’s or EMED’s infusion system, respectively. In total, 103 protocols utilizing exclusively KORU or EMED supplies (syringe driver, tubing sets, and needle sets) were included. Manufacturer-provided flow rate data sets are specifically designed to provide infusion rate results that have been validated exclusively for use with the respective manufacturer’s supplies, including pumps, flow tubing, needle sets, and flow controllers. Although it is common practice in many clinical settings for pharmacy providers to combine supplies from various manufacturers to meet patient needs, these mixed-product configurations have not undergone the necessary validation testing to be represented accurately in the use of manufacturer-specific flow rate data sets. As a result, infusion rates calculated using these manufacturer-specific tools may not accurately reflect the performance of such mixed configurations, potentially compromising the precision of infusion time estimates. There were 147 protocols that used a combination of pumps, tubing sets, and needle sets from different manufacturers, which could not be accurately evaluated using the respective validated data sets for either KORU or EMED and were subsequently excluded from the study. One protocol was excluded from the optimization phase that evaluated annual timesaving, as the dose frequency for this protocol was not specified.
This study has three result sections. All three sections report infusion time simulations using the drug and dose prescribed to the patient in their original protocol. In Section 1, protocols that included exclusively KORU devices were first evaluated, then optimized using the KORU flow rate data set to achieve a shorter overall infusion time where possible. Infusion time optimization was performed by adjusting the number of infusion sites, the needle gauge, and the tubing set. Where applicable, an additional subcutaneous infusion site was added to the optimized protocol unless this surpassed the maximum number of allowable sites for the infusion parameters outlined in the full prescribing information of the respective drug. In instances where the original protocol exceeded the recommended volume per infusion site per the full prescribing information of the drug manufacturer, the new optimized protocol was permitted to exceed the recommended site volume by an amount less than or equal to the original protocol. At the time of the study, an adjustable flow rate controller was not available for KORU supply configurations. The specific pump used in the protocol was not permitted to change during optimization.
Section 1 describes the devices used and presents simulated original infusion times, optimized infusion times, and the total time saved per infusion, per year, and per drug, using the number of infusions required annually for each individual infusion protocol.
Section 2 presents analogous results for protocols using exclusively EMED device configurations. The original protocols were evaluated and optimized in these simulations using the EMED flow rate data set. Where possible, the same approach as KORU protocol optimization was used for EMED, with minor differences arising from the different inputs required by the respective data set interfaces. Infusion time optimization was performed by adjusting the number of infusion sites, the needle gauge, and the tubing set. Where applicable, an additional subcutaneous infusion site was added to the optimized protocol. As an adjustable flow rate controller is available for use with EMED, the maximum allowed flow rate option on the flow rate controller was selected for both the original and optimized protocols. The manufacturer of EMED offers two product lines for tubing sets; the tubing set product line was not permitted to change during optimization. The pump was not permitted to change during optimization for EMED.
Section 3 compares KORU and EMED flow rate results using a subset of 55 KORU protocols and 5 EMED protocols using Hizentra. Mean infusion times are presented and compared before and after optimization. Optimization results are also presented and compared. Statistical analyses were performed to evaluate the KORU and EMED protocols before and after optimization. Considering the reduction in mean infusion time after optimization for KORU and EMED results individually, the reduction for KORU from 87.71 minutes to 41.04 minutes was statistically significant (p < 0.001, two-tailed paired t-test). The reduction for the EMED results from 125.00 minutes to 64.80 minutes yielded a p value of 0.067 with a two-tailed paired t-test. A two-tailed t-test was performed to compare original protocol results between KORU device patients and EMED device patients. The result was not statistically significant (p = 0.102). The same test was performed between optimized results. The KORU mean after optimization was superior (shorter infusion time) than the EMED mean (p = 0.012). A two-tailed t-test was also performed on minutes per milligram infused on the original protocol and the optimized protocol. This test yielded a probability of p = 0.0712. To adjust for potential differences between the original protocols for all-EMED and all-KORU configurations, as well as the relatively low number of all-EMED protocols represented in this analysis, a second optimization calculation was made for the all-EMED device patients. This second optimization allowed two additional needle sites instead of one; but otherwise following the strategy identified in Table 2. These results were compared to the all-KORU optimized results using only one additional needle site. A discussion and conclusion follow the three result sections.
Results
Section 1. KORU Flow Rate Protocol Simulation Results
Demographics and the number of drug infusion protocols (Drugs Infused) are shown in Table 1. Tube sets and needle sets used to simulate the original protocol and the ‘optimized’ protocols are shown in Tables 2 and 3, respectively.
|
Drugs Infused |
||
|
Drug |
N |
% |
|
Xembify |
3 |
0.031 |
|
Hizentra |
55 |
0.567 |
|
Gammagard |
4 |
0.041 |
|
Cuvitru |
33 |
0.34 |
|
Cutaquig |
2 |
0.021 |
|
Total |
97 |
1 |
|
Demographics |
N = 97 |
|
Male, N (%) |
26 (26.8) |
|
Age, years, mean (SD) |
59.4 (19.8) |
|
Height, cm, mean (SD) |
164.6 (15.2) |
|
Weight, kg, mean (SD) |
75.3 (22.7) |
Table 1: KORU Demographics and Drugs Infused.
|
Tube Set |
Original |
Optimized |
|
F180, N (%) |
2 (2.1) |
0 (0.0) |
|
F275, N (%) |
6 (6.2) |
2 (2.1) |
|
F420, N (%) |
9 (9.3) |
1 (1.0) |
|
F500, N (%) |
1 (1.0) |
1 (1.0) |
|
F600, N (%) |
16 (16.5) |
0 (0.0) |
|
F900, N (%) |
14 (14.4) |
15 (15.5) |
|
F1200, N (%) |
29 (29.9) |
9 (9.3) |
|
F2400, N (%) |
20 (20.6) |
69 (71.1) |
|
Total |
97 |
97 |
Table 2: KORU Original Tube Sets and Optimized Tube Sets.
Infusion time saving by infused drug after optimization are presented in Table 4. Results range from 17.00 minutes to 46.67 minutes, with a weighted mean of 38.94 minutes. The different number of patients taking each of the different drugs is accounted for in the weighted mean. The mean dose, mean number of sites, and mean time saving with optimization listed in Table 4 are results per infusion.
|
24G Needle Set |
Original |
Optimized |
|
24G 1 Needle, N (%) |
4 (4.1) |
0 (0) |
|
24G 2 Needle, N (%) |
20 (20.1) |
4 (4.1) |
|
24G 3 Needle, N (%) |
9 (9.3) |
35 (36.1) |
|
24G 4 Needle, N (%) |
2 (2.0) |
14* (14.4) |
|
Total 24G, N (%) |
35 (36.1) |
53 (54.6) |
|
26G Needle Set |
Original |
Optimized |
|
26G 1 Needle, N (%) |
0 (0) |
0 (0) |
|
26G 2 Needle, N (%) |
16 (16.5) |
0 (0) |
|
26G 3 Needle, N (%) |
15 (15.5) |
1 (1.0) |
|
26G 4 Needle, N (%) |
20 (20.1) |
12 (12.4) |
|
26G 5 Needle, N (%) |
8 (8.0) |
20 (20.6) |
|
26G 6 Needle, N (%) |
3 (3.1) |
8 (8.3) |
|
26G 7 Needle, N (%) |
0 (0) |
3 (3.1) |
|
Total 26G, N (%) |
62 (63.9) |
44 (45.4) |
Table 3: KORU Original Needle Sets and Optimized Needle Sets.
In nine of 97 patients the original protocol yielded values that exceeded the drug manufacturer’s recommendations for site flow rate or site volume, or both. In these cases, warnings were indicated in the flow rate data set interface for KORU’s system. Optimizations either eliminated these warnings or yielded site volume values equal to or less than the outputs in the original protocol, making the optimized values either within or closer to the infusion parameters outlined in the full prescribing information for the medication.
|
KORU Optimized Protocol Allowing One Additional Site |
||||
|
Drug |
N |
Mean Dose, grams |
Mean Number of Sites, Original Protocol |
Mean Time Savings with Optimization, Minutes |
|
Xembify |
3 |
15 |
3 |
17 |
|
Hizentra |
55 |
13.7 |
3.4 |
46.7 |
|
Gammagard |
4 |
16 |
4.8 |
12 |
|
Cuvitru |
33 |
15 |
2.2 |
31.7 |
|
Cutaquig |
2 |
14 |
3 |
32.5 |
|
Total |
97 |
Weighted Mean |
38.9 |
|
Table 4: KORU Time Savings Achieved with Optimization, by Drug.
A comparison of KORU tube sets selected before and after optimization is presented in Figure 1. A substantially larger proportion of the highest flow-rate tube set was selected in the optimization phase of the simulation (70.10% versus 20.62%, respectively).
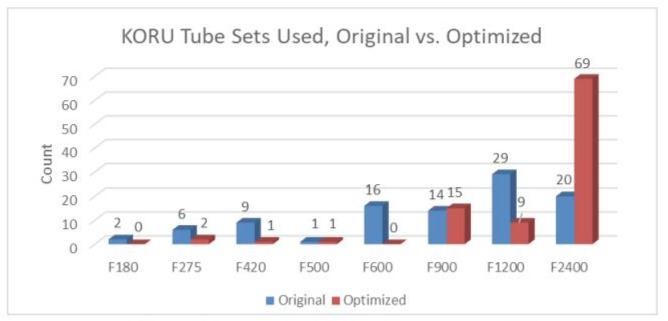
Figure 1: KORU Tube Sets Used, Original vs. Optimized.
Needle sets selected before and after optimization are presented in Figure 2. A higher proportion of protocols included 24 Gauge needles after optimization than with the original protocols (54.64% versus 36.08%, respectively).
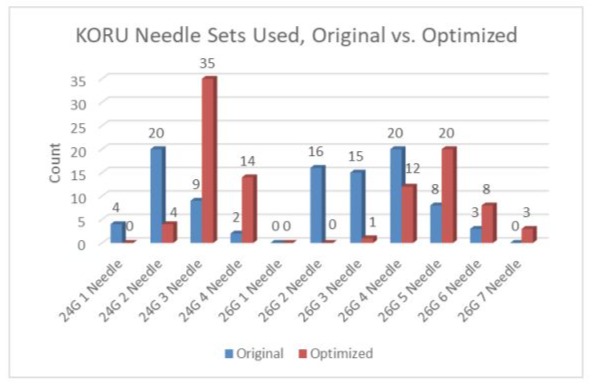
Figure 2: KORU Needle Sets Used, Original versus Optimized.
Mean infusion time by drug is presented in Figure 3, before and after optimization. All drug infusions were faster after optimization.
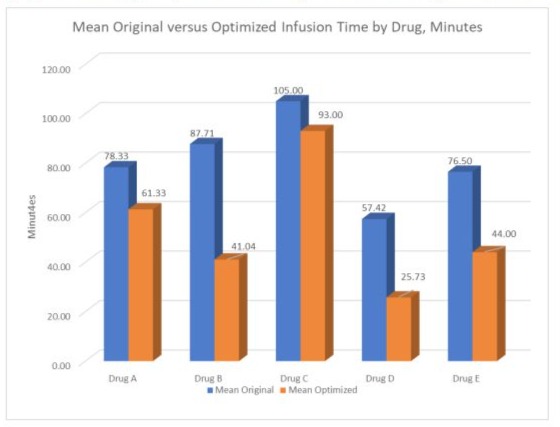
Figure 3: KORU Infusion Time by Drug, Original versus ‘Optimized.
Mean infusion time saving over a one-year period following optimization are presented in Table 5 by drug. These results were calculated by multiplying the time saving for a single infusion by the total number of infusions per year originally prescribed for the patient.
|
Range and Mean of Time Savings Over 1 Year with Optimization by Drug, KORU Protocols |
||||
|
Drug |
N |
Lowest Savings (h) |
Highest Savings (h) |
Mean Savings per Year (h) |
|
Xembify |
3 |
2.6 |
31.2 |
13.9 |
|
Hizentra |
54* |
6.1 |
214.9 |
39.4 |
|
Gammagard |
4 |
1.7 |
26.9 |
10.4 |
|
Cuvitru |
33 |
0.9 |
143 |
25.1 |
|
Cutaquig |
2 |
9.5 |
46.8 |
28.2 |
|
*One of the 55 patients who was prescribed Hizentra was excluded because the dose frequency was unspecified in the original protocol |
||||
Table 5: Range and Mean of Time Savings Over 1 Year with Optimization by Drug, KORU Protocols.
Section 2. EMED Flow Rate Protocol Simulation Results
In addition to the 97 protocols using exclusively KORU devices, there were 6 protocols using exclusively EMED devices, and eligible for evaluating the estimated infusion times of the original protocols against protocols optimized by using the EMED flow rate data set. Demographics are presented in Table 6. Five of these patients were treated with Hizentra and one was treated with Cuvitru. Three of these patients exceeded dose per site per the EMED flow rate data set interface, using their original protocol. Times per infusion, along with the original protocol tube sets and needle sets, are presented in Table 7. In protocols using the adjustable flow rate controller, the highest flow rate presented in the drop-down menu was always selected when calculating the original protocol and the optimized protocol infusion times.
|
Demographics |
N = 6 |
|
Male, N (%) |
1 (0.2) |
|
Age, years, mean (SD) |
63.2 (16.6) |
|
Height, cm, mean (SD) |
168.4 (7.6) |
|
Weight, kg, mean (SD) |
87.3 (27.3) |
Table 6: EMED Demographics.
|
Infusion Time by EMED Flow Rate Data Set, Original Protocol |
||||||
|
Patient |
Dose (gm) |
Drug |
Original Tube Set |
Original Flow Rate Controller Position |
Original Needle Set, Including Needle Gauge |
Infusion Time (min) |
|
1 |
7 |
Hizentra |
SCIg VersaRate Plus Variable Set |
Open |
9 mm, 27g, 1-needle set |
109.0* |
|
2 |
14 |
Hizentra |
SCIg VersaRate Plus Variable Set |
3 |
9mm, 24g, 4-needle set |
55 |
|
3 |
3 |
Hizentra |
SCIg VersaRate Plus Variable Set |
Open |
12 mm, 27g, 2-needle set |
27 |
|
4 |
16 |
Hizentra |
SCIg Infuset Tubing 930 mL/hr |
930 mL/hr |
9 mm, 27g, 2-needle set |
192.0* |
|
5 |
13 |
Cuvitru |
SCIg VersaRate Plus Variable Set |
Open |
9 mm, 27G, 3-needle set |
66 |
|
6 |
30 |
Hizentra |
SCIg VersaRate Plus Variable Set |
2 |
12 mm, 24G, 3-needle set |
242.0* |
|
Mean |
115.2 |
|||||
|
*Exceeds Drug Manufacturer’s Recommended Volume Per Site |
||||||
Table 7: Original Protocol Infusion Time, Determined by the EMED Flow Rate Data Set.
Table 8 presents infusion times that were optimized using the strategy presented in Tables 2 and 3, on a patient-by-patient basis. Table 8 also shows the tube sets and needle sets selected for the optimized protocol. Time saving per infusion are shown in the right-most column. Where infusion volume exceeded the drug manufacturer’s recommendations with the original protocol, the optimized protocol either did not exceed the limit or exceeded the limit by an equal or smaller amount compared to the original protocol.
|
Infusion Time by EMED Flow Rate Data Set, Optimized |
|||||
|
Patient |
Optimized Tube Set |
Optimized Flow Controller Position |
Optimized Needle Set, Including Needle Gauge |
Optimized Infusion Time, Minutes |
Time Savings Per Infusion, Minutes |
|
1 |
SCIg VersaRate Plus Variable Set |
Open |
SCIg EMED 2-site 9mm 27G SUB260 |
57 |
52 |
|
2 |
SCIg VersaRate Plus Variable Set |
3 |
SCIG EMED 5-site 9 mm 26G OPT52609 |
50 |
5 |
|
3 |
SCIg VersaRate Plus Variable Set |
3 |
SCIg EMED 3-site 12mm 24G SUB312 |
14 |
13.0. |
|
4 |
SCIg Infuset Tubing 930 mL/hr |
930 mL/hr |
SCIG EMED 3 site 9 mm 26G OPT32609 |
87 |
105 |
|
5 |
SCIg VersaRate Plus Variable Set |
Open |
SCIG EMED 5-site 9 mm 26G OPT42509 |
18 |
48 |
|
6 |
SCIg VersaRate Plus Variable Set |
3 |
SCIG EMED 4-site 12mm 27G SAF-Q-412 |
116 |
126 |
|
Mean |
57 |
58.2 |
|||
Table 8: Time per Infusion Post Optimization, EMED Flow Rate Data Set.
Table 9 shows the yearly time saving per patient that could be achieved by optimizing protocols as indicated by the EMED flow rate data set. These results were calculated by multiplying the savings for a single infusion by the total number of infusions per year originally prescribed for the patient. The five patients administered Hizentra had a mean yearly savings of 2 days, 5 hours and 59 minutes. This result excludes patient 5, who was prescribed Cuvitru (see Table 7).
|
Yearly Time Saved Per Patient Via Optimization Per Year, EMED |
|||
|
Patient |
Time Savings Per Infusion (min) |
Doses Per Year |
Approximate Yearly Time Saved (h) |
|
1 |
52 |
52 |
45.1 |
|
2 |
5 |
26 |
2.2 |
|
3 |
13 |
104 |
22.5 |
|
4 |
105 |
52 |
92 |
|
5 |
48 |
52 |
41.6 |
|
6 |
126 |
52 |
109.2 |
|
Mean |
51.9 |
||
Table 9: Yearly Time Saving Achieved by Optimization, EMED Flow Rate Data Set.
Section 3. Comparison of KORU and EMED Flow Rate Data Sets with Hizentra: Results
There were 55 protocols using exclusively KORU devices to administer Hizentra and 5 protocols using exclusively EMED devices to administer Hizentra. Demographics are provided in Table 10. There were four pediatric patients in the KORU group (14, 19, 20 and 20 years old) and no pediatric patients in the EMED group.
Table 11 shows the inputs required for the KORU data set interface and the EMED data set interface. The KORU interface required five different variable inputs, whereas the EMED interface required ten separate entries of information to obtain an estimated infusion time. Moreover, three of the five data entry variables required by the KORU interface are selected by pointing and clicking on an image. In the case of needle gauge, needle set code and number of needles, all three variables are selected by pointing on the image containing the desired selection. These three variables must be entered individually in the EMED interface.
|
KORU |
EMED |
|
|
Demographics |
N = 55 |
N = 5 |
|
Male, N (%) |
17 (30.9) |
0 (0) |
|
Age, years, mean (SD) |
58.0 (20.0) |
59.8 (16.2) |
|
Height, cm, mean (SD) |
164.8 (6.2) |
165.6 (3.3) |
|
Weight, kg, mean (SD) |
77.1 (21.5) |
80.2 (23.6) |
Table 10: Demographics.
|
Input Required, KORU versus EMED Flow Rate Data Set Interfaces |
||
|
Variable |
KORU Data Set |
EMED Data Set |
|
Tube Set /Flow Controller |
1. Required, Point and Click |
1. Required, Drop Down Menu |
|
Country/Region |
Not Required |
2. Required, Drop Down Menu |
|
Drug |
2. Required, Drop Down Menu, 14 Options |
3. Required, Drop Down Menu, 8 Options |
|
Dose |
3. Required, mL or mg |
4. Required, mL Only |
|
Infusion Type, Initial or Maintenance |
Not Required |
5. Required, Drop Down Menu |
|
Infusion Pump |
4. Required, Point and Click |
6. Required, Drop Down Menu |
|
Needle Gauge |
5. Required, Needle Gauge, Needle Set, and Number of Needles all Selected Simultaneously by Point and Click |
7. Required, Drop Down Menu |
|
Needle Set |
8. Required, Drop Down Menu |
|
|
Number of Needles |
9. Required, Drop Down Menu |
|
|
Flow Controller Setting |
Not Applicable |
10. Required, Drop Down Menu |
Table 11: Required Input Comparison of KORU and EMED Data Set Interfaces.
The KORU and EMED flow rate data sets have been validated for use with specific drugs. At the time of cross-sectional data analysis and protocol optimization, the KORU data set had been validated for use with 14 immunoglobulins, whereas the EMED data set had been validated for 8 immunoglobulins. See Table 12. Each immunoglobulin has a different viscosity and may have other differing properties that affect flow rate; accordingly, it is important to select the correct drug when using either data set interface. As Hizentra has different infusion parameters depending on the indicated condition, a separate entry for Chronic Inflammatory Demyelinating Polyneuropathy (CIDP) and Primary Immune Deficiency (PID) are included in each data set interface. This study examines flow rate data set use for PID only.
|
Comparison Between KORU and EMED Protocol Results, Hizentra Infusion, Original Protocol vs. Optimized Protocol Plus One Additional Needle Site |
|||
|
Variable |
KORU |
EMED |
Difference (CI = 95%) |
|
N |
55 |
5 |
|
|
Mean Minutes, Original Protocol |
87.7 |
125 |
37.3 |
|
Mean Minutes, Optimized Protocol |
41.0* |
64.8* |
23.8 |
|
Difference, Original vs. Optimized, Minutes |
46.7 |
60.2 |
13.5 |
|
Minutes Per mg Infused, Original Protocol |
6.4 |
8.9 |
2.5 |
|
Minutes Per mg Infused, Optimized Protocol |
3.0** |
4.6** |
1.6 |
|
Difference, Original vs. Optimized, Minutes |
3.4 |
4.3 |
0.9 |
|
Mean Number of Needle Sites, Original Protocol |
3.4 |
2.4 |
-1 |
|
Mean Number of Needle Sites, Optimized Protocol |
4.4 |
3.4 |
-1 |
|
Difference, Original vs. Optimized, # Sites |
1 |
1 |
0 |
|
Mean mg Hizentra Infused, Original and Optimized |
13.7 |
14 |
0.3 |
|
Percent Outside of Drug Manufacturer’s Recommended Flow Rate Per Site, Original Protocol |
8/55 (14.6%) |
3/5 (60.0%) |
|
|
* Difference between KORU and EMED ‘Optimized’ minutes is statistically significant, p = 0.012. **Difference between KORU and EMED ‘Optimized’ minutes per mg is statistically Significant, p = 0.00067. |
|||
Table 12: Comparison of KORU Original and ‘Optimized’ Protocol to EMED Protocol Results.
Simulated Results with Hizentra from Field-Practice Protocols
In field use, protocols using exclusively KORU devices had faster simulated infusion times than protocols using exclusively EMED devices. Results are shown in Figure 4 and Table 12. All results are for Hizentra infusions. In addition, protocols using exclusively KORU devices had greater time saving after optimization calculations when compared to protocols using exclusively EMED devices. It was noted upon review of the original protocols that KORU device protocols generally utilized one additional needle site compared to the original EMED protocols. The reason for this discrepancy is unknown. The difference between the number of sites used in KORU and EMED original protocols was not statistically significant; but may be considered a statistical trend (p = 0.072; means are presented in Table 12).
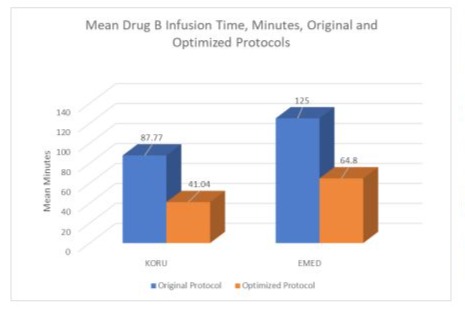
Figure 4: Comparison between KORU and EMED Infusion Protocol Results Before and After Optimization.
Another finding is that 3 out of 5 of the original EMED protocol infusion time results exceeded the drug manufacturer’s recommended limit for volume of drug per site, compared to 8/55 (14.55%) for KORU protocols. These findings may reflect the small number of patients in this study using all-EMED devices. Another possibility is that practitioners may find it harder to approach an optimal protocol using the EMED data set because the EMED data set interface requires more complicated input compared to the KORU data set interface ( Table 11). A comparison between KORU protocol results and EMED protocol results is shown in Figure 4 and Table 12. In both the KORU and EMED ‘optimized’ results, one additional site over the original protocol was allowed. In instances where the original protocol exceeded the drug manufacturer’s recommended drug volume per site, the ‘optimized’ protocol was selected that delivered a drug volume per site that was ≤ than the original protocol.
There was no statistically significant difference between means for the original protocols; the optimized protocols yielded a statistically significant difference (p = 0.0000067). This comparison removes the small difference between the mean milligrams infused between the means compared.
The mean number of needle sites was 4.40, slightly higher than the all-KORU device patients (Table 12). A t-test between the mean simulated infusion times for both all-KORU and all-EMED devices with the additional infusion site optimization was not significant (55.00 minutes EMED versus 41.04 Minutes KORU, p = 0.136); however, a t-test between these groups on mean minutes for mg infused (2.99 for KORU, 4.10 for EMED) was statistically significant (p = 0.013).
Annual time saving for optimized all-KORU device patients on Hizentra is 1 day, 15 hours and 19 minutes. The annual time saving for ‘optimized’ all-EMED device patients is 2 days, 5 hours and 59 minutes when ‘optimized’ according to the method in Table 2. These results are based on the annualized number of infusions prescribed.
Discussion
A body of literature exists addressing methods for minimizing the cost of IgG therapy in terms of currency expenditure [3-6,9]. The preference patients have for home therapy versus therapy performed in a clinic where travel has also been studied and verified in adults [9] and in pediatric patients [10]; but the cost to patients in time spent during infusions has received little attention. This study begins to address the lack of information on what can be done to save patients’ time. The utilization of flow rate protocol optimization tools with the objective of minimizing infusion time presents a clear benefit to patients and providers who desire to decrease infusion time. This study highlights specific strategies for achieving this goal, such as increasing the needle site count and maximizing tube set flow rates. Flow rate data sets and their interfaces also play a critical role in ensuring adherence to the drug manufacturer’s specified volumes and flow rate limits, promoting both safety and efficacy in infusion administration. One contributing factor to the identified differences may be that EMED device patients originally utilized approximately one fewer needle site than KORU device patients. This lower needle site count may be associated with the greater complexity of the EMED data set interface, potentially limiting its efficient use. Nevertheless, even when the number of needle sites was standardized between groups, KORU device patients continued to exhibit shorter simulated infusion times. Further research comparing estimated infusion times with actual clinical infusion times is recommended to validate these tools. Additionally, the impact of minimizing infusion time on patient quality of life warrants in-depth exploration.
Limitations
This study is limited by several factors, including a small sample size of patients using exclusively EMED devices, its retrospective nature, and reliance on simulated rather than actual infusion times. Additionally, the study does not consider the acclimation period that may be required when patients initiate immunoglobulin (IgG) therapy. Infusion times for some patients may have been extended by practitioners to mitigate adverse events or to adopt a more cautious approach (such as in the case of the pediatric population), but relevant data to account for such adjustments were not available and, thus, are not reflected in this analysis. Furthermore, this study examines infusion times in isolation of the gathering, setup, assembly, and disposal of supplies, all of which may vary depending on individual patient and device characteristics such as device familiarity, device complexity, and manual dexterity.
Conclusion
Optimizing infusion duration offers substantial time saving for patients, particularly when considered on an annual basis. This observation applies to both KORU and EMED supply selection, with patients using exclusively EMED devices demonstrating longer simulated infusion times compared to those using KORU devices, in both original and optimized protocols. These findings suggest a potential advantage of KORU devices in cases where minimizing infusion time is a priority.
Acknowledgements
The authors would like to express their gratitude to the patients and healthcare providers who contributed their time and data to this study, as well as the respective agencies for their efforts to make the bench-tested flow rates and data used in this study available. Additionally, we are grateful to our colleagues and statistical consultants for their expertise in the analysis and interpretation of the data. Finally, we would like to thank Matthew Wilkinson, MD and the editorial and review teams for their valuable feedback, which helped enhance the quality of this manuscript.
Declaration of Conflicting Interest
Three of the four authors of this study are employees and contractors of KORU Medical Systems, the manufacturer of one of the devices evaluated in this research. This affiliation may represent a potential conflict of interest. However, every effort was made to ensure that the study design, data collection, analysis, and interpretation were conducted with objectivity and scientific rigor. The results and conclusions presented in this study reflect the data accurately and impartially, without bias toward any specific product or manufacturer. For any questions about data integrity because or potential conflicts of interest, please contact KORU Medical Systems at medicalaffairs@korumedical.com.
Funding Statement
This study received no external funding. The authors maintained full independence throughout the research process.
Ethical Approval and Informed Consent Statement
This study utilized anonymized, retrospective data collected from a specialty pharmacy, and no identifiable patient information was accessed by the researchers. As the data were anonymized and involved no direct interaction with patients, informed consent and formal ethical approval were not required according to applicable guidelines for human subjects research. The study adhered to ethical standards for the use of retrospective data and complies with relevant institutional and national regulations.
Data Availability Statement
The data supporting the findings of this study were obtained from a large specialty pharmacy and are not publicly available due to privacy and confidentiality agreements. Anonymized data used in the study may be available from the corresponding author upon reasonable request and with permission from the specialty pharmacy, subject to applicable data protection regulations.
References
- Epland K, Suez D, Paris K (2022) A clinician's guide for administration of high-concentration and facilitated subcutaneous immunoglobulin replacement therapy in patients with primary immunodeficiency diseases. Allergy Asthma Clin Immunol 18: 87.
- Skoda-Smith S, Torgerson TR, Ochs HD (2010) Subcutaneous immunoglobulin replacement therapy in the treatment of patients with primary immunodeficiency disease. There Clin Risk Manag 6: 1-10.
- Alsina L, Montoro JB, Moral PM, Neth O, Pica MO, et al. (2022) Cost-minimization analysis of immunoglobulin treatment of primary immunodeficiency diseases in Spain. Eur J Health Econ 23: 551-558.
- Gerth WC, Betschel SD, Zbrozek AS (2014) Implications to payers of switch from hospital-based intravenous immunoglobulin to home-based subcutaneous immunoglobulin therapy in patients with primary and secondary immunodeficiencies in Canada. Allergy Asthma Clin Immunol 10: 23.
- Ritchie B, Martins KJB, Tran DT, Blain H, Richer L, et al. (2022) Economic impact of self-administered subcutaneous versus clinic-administered intravenous immunoglobulin G therapy in Alberta, Canada: a population-based cohort study. Allergy Asthma Clin Immunol. 18: 99.
- Mallick R, Carlton R, Stiphout JV (2023) A Budget Impact Model of Maintenance Treatment of Chronic Inflammatory Demyelinating Polyneuropathy with IgPro20 (Hizentra) Relative to Intravenous Immunoglobulin in the United States. Pharmacoecon Open.7: 243-255.
- Zuizewind CA, Kessel PV, Kramer CM, Muijs MM, Zwiers JC, et al. (2018) Home-Based Treatment with Immunoglobulins: an Evaluation from the Perspective of Patients and Healthcare Professionals. J Clin Immunol 38: 876-885.
- Al-Saud B, AlRumayyan N, Alfattani A, Awwad SA, Saud DA, et al. (2023) Quality of Life Evaluation in Saudi Arabian Pediatric Patients with Primary Immunodeficiency Diseases Receiving 20% Subcutaneous IgG Infusions at Home. J Clin Immunol 43: 1360-1366.
- Windegger TM, Nghiem S, Nguyen KH, Fung YL, Scuffham PA (2019) Cost-utility analysis comparing hospital-based intravenous immunoglobulin with home-based subcutaneous immunoglobulin in patients with secondary immunodeficiency. Vox Sang. 114: 237-246.
- Pasquet M, Pellier I, Aladjidi N, Auvrignon A, Cherin P, et al. (2017) A cohort of French pediatric patients with primary immunodeficiencies: are patient preferences regarding replacement immunotherapy fulfilled in real-life conditions?. Patient Prefer Adherence. 11: 1171-1180.
- KORU Medical Systems. Market share of non-programmable subcutaneous infusion pumps. 2024. Unpublished internal data.
- KORU Medical Systems. Calculator validation processes. 2024. Unpublished internal data.
- KORU Medical Systems. FREEDOM60® Syringe Infusion System: Instructions for Use. KORU Medical Systems. 2023.
- KORU Medical Systems. FREEDOMEDGE® Syringe Infusion System: Instructions for Use. KORU Medical Systems. 2022.
- KORU Medical Systems. KORU Flow Rate Calculator [Internet]. KORU Medical Systems; [date unknown].
- EMED Technologies Corporation (2023) EMED Syringe Infusion: Instructions for Use. EMED Technologies Corporation.
- VersaRate. VersaRate Flow Rate Calculator [Internet]. VersaRate; [date unknown].
- Rutland B, Southworth C, Bosshard J (2025) Patient Preferences for Faster Home-Based Subcutaneous Immunoglobulin Infusion Therapy and the Effect on Adverse Events. Patient Prefer Adherence. 19: 615-621.
© by the Authors & Gavin Publishers. This is an Open Access Journal Article Published Under Attribution-Share Alike CC BY-SA: Creative Commons Attribution-Share Alike 4.0 International License. Read More About Open Access Policy.