Development and Validation of a Novel Nomogram to Screen for Liver Fibrosis in Individuals with Hepatitis B Core Antibody Seropositivity
by Jing Yuan1,2 †, Yiding Chen2 †, Ling Xiao2, Min Zhou2, Hu Zhang1-3*
1Department of Gastroenterology, West China Hospital, Sichuan University, Chengdu, China
2Department of Gastroenterology, West China Tianfu Hospital, Sichuan University, Chengdu, China
3Center for Inflammatory Bowel Disease, West China Hospital, Sichuan University, Chengdu, China
†Jing Yuan and Yiding Chen contributed equally to this work.
*Corresponding author: Hu Zhang, Department of Gastroenterology, West China Hospital, Sichuan University, No. 37 Guoxue Xiang, Chengdu, 610041, Sichuan Province, China
Received Date: 02 August 2024
Accepted Date: 06 August 2024
Published Date: 08 August 2024
Citation: Yuan J, Chen Y, Xiao L, Zhou M, Zhang H (2024) Development and Validation of a Novel Nomogram to Screen for Liver Fibrosis in Individuals with Hepatitis B Core Antibody Seropositivity. Ann Case Report. 9: 1925. https://doi.org/10.29011/2574-7754.101925
Abstract
Background and aim: Seropositive hepatitis B core antibody (HBcAb) could indicate hepatitis B virus infection. Individuals with positive HBcAb were reported to be more susceptible to liver disease than the general population. We aimed to create a new nomogram to screen for liver fibrosis in these individuals.
Materials and Methods: Individuals with seropositive HBcAb from the National Health and Nutrition Examination Survey (NHANES) were enrolled in this study and randomly assigned to training and validation cohorts. The nomogram was established based on the results of univariate analysis, least absolute shrinkage and selection operator (LASSO) regression, and multivariate analysis. The nomogram was further assessed by area under the receiver operator characteristic curve (AUC), net reclassification index (NRI), integrated discrimination improvement (IDI), calibration curve, and decision curve analysis (DCA) curve. We also compared our nomogram with three existing models concerning liver fibrosis.
Results: Our study enrolled 605 participants and collected 39 variables from NHANES data. Our nomogram was developed based on seven optimal predictors, including age, alanine aminotransferase (ALT), aspartate aminotransferase (AST), γ-glut amyl trans peptidase (GGT), albumin, body mass index (BMI), and hip circumference (HC). The AUC of the nomogram for liver fibrosis was 0.829 and 0.782 in training and validation cohorts, respectively. The evaluation of NRI, IDI, calibration curve, and DCA curve indicated the better performance of our nomogram compared with existing models.
Conclusion: The newly constructed nomograms could serve as a promising screening tool for identifying liver fibrosis in individuals with HBcAb seropositivity.
Keywords: Clinical Prediction Model; Nomogram; Liver Fibrosis; Risk Factor; Seropositive Hepatitis B Core Antibody.
Introduction
Chronic hepatitis B (CHB) is a major global health threat induced by hepatitis B virus (HBV) infection, and it results in significant worldwide socio-economic burdens [1]. Liver fibrosis is an inevitable stage of CHB development. The timely and accurate assessment of liver fibrosis, along with effective antiviral therapies, are essential to reduce the risk of cirrhosis, hepatic failure, and hepatocellular carcinoma (HCC) [2,3]. To improve the quality of life for CHB patients, it is crucial to screen the population vulnerable to liver decompensation-related morbidity and adopt beneficial interventions [4].
Several serological biomarkers can indicate the infection status of HBV infection. Hepatitis B core antibody (HBcAb) seropositivity reveals a previous HBV infection status [5]. Studies have shown that individuals with positive-HBcAb have a higher prevalence of advanced liver fibrosis or cirrhosis than the general population, highlighting the importance of liver fibrosis screening in these individuals [6-8]. Therefore, patients with HBcAb positivity require careful monitoring to prevent liver disease deterioration.
As for screening the liver fibrosis in CHB, liver biopsy is considered the gold standard for diagnosing and evaluating liver fibrosis. However, liver biopsy has several deficiencies, such as invasiveness, compliance, sampling error, and side effects [9,10]. Due to the invasive nature of the procedure and the numerous complications that can arise, repeated liver biopsy is impractical for screening liver fibrosis in patients [11,12]. Therefore, noninvasive tests are potential alternative methods for identifying liver fibrosis. These methods can efficiently monitor the dynamic progress of liver disease without any inevitable side effects [11]. Serological markers and complex models, such as platelets and hyaluronic acid, the aspartate transaminase to platelet ratio (APRI), fibrosis-4 score (FIB-4), γ-glutamyl trans peptidase to platelet ratio (GPR), Hui score, Forms Index, and King’s Score, appear to be reliable non-invasive methods for early and rapid assessment of liver fibrosis [13–16].
The imaging test also plays a crucial role in screening for liver fibrosis. In particular, vibration-controlled transient elastography (VCTE) has been recommended as a validated non-invasive standard for assessing liver fibrosis in patients with HBV infection [17–19]. This method mainly relies on ultrasound technology and can measure liver stiffness, which can reflect the severity of fibrosis [20,21]. Patients strongly prefer VCTE over liver biopsy, which is widely used in clinical practice to contribute significantly to the invasive screening of liver fibrosis [20,21].
However, most non-invasive models for predicting liver fibrosis focused on patients with CHB who had tested positive for hepatitis B surface antigen (HBsAg) or hepatitis B surface antibody (HBsAb). These models rarely considered the risk of liver fibrosis in individuals with HBcAb and have thus ignored the necessity of early screening and prevention of advanced fibrosis in these patients. Therefore, we developed a novel prediction model for liver fibrosis in individuals with seropositive HBcAb and created a visually representative nomogram of the model. We also compared our model’s efficacy for predicting liver fibrosis with other noninvasive models.
Materials and Methods
Data Source and Study Population
Our study collected data from the National Health and Nutrition Examination Survey (NHANES), which tracks the health and nutritional status of adults and children in the United States of America over time [22]. Before participating in the NHANES, all individuals gave written informed consent. Before participating in the NHANES, all individuals provided written informed consent. Our study complied with the TRIPOD (Transparent Reporting of a Multivariable Prediction Model for Individual Prognosis or Diagnosis) statement for reporting [23], and was conducted in accordance with the principles of the Helsinki Declaration.
NHANES data from cycle 2017.01-2020.03 were collected, and subjects with HBcAb seropositivity were enrolled in our study. A total of 641 subjects had seropositive HBcAb, but 34 subjects without valid VCTE data and two subjects under the age of 18 were excluded from our cohort. To investigate the correlation between liver fibrosis and various risk factors in patients with HBcAb seropositivity, participants with other risk factors for liver fibrosis, such as different hepatitis virus infections and obesity, were not excluded. Eventually, 605 individuals were enrolled. The number of outcome events per variable (EPV) in our study was greater than 10, which met the standard criterion for prediction model construction [24]. The enrolment process is presented in Figure 1.
Clinical Characteristics and Laboratory Tests
The definition of liver fibrosis in our study was based on the median liver stiffness (MS) obtained via VCTE (FibroScan®), with a threshold of MS ≥ 8.4 kPa indicating significant fibrosis. Various variables, including demographics (age, sex, race, and socioeconomic status), anthropometrics (hip circumference (HC), waist circumference (WC), arm circumference (AC), and body mass index (BMI)), lifestyles (alcohol consumption, smoking, and insomnia), comorbidities (hypertension, diabetes, and cardiac function), and laboratory examinations such as hemoglobin (HB), platelets (PLT), white blood cell (WBC), lymphocytes (LYM), neutrophils (NEU), monocytes (MON), alanine aminotransferase (ALT), aspartate aminotransferase (AST), γ-glut amyl trans peptidase (GGT), alkaline phosphatase (ALP), blood urea nitrogen (BUN), creatinine (CRE), albumin (ALB), globulin (GLB), triglycerides (TG), total cholesterol (TC), low-density lipoprotein cholesterol (LDL-C), high-density lipoprotein cholesterol (HDL-C), total bilirubin (TB), uric acid (UA), glycosylated hemoglobin, and high-sensitivity C-reactive protein (hs-CRP), were collected from NHANES database. Additionally, variables related to the immunity or infection of various hepatitis viruses, such as HBV vaccine status, hepatitis A antibody (HAAb), HBsAg, HBsAb, hepatitis C RNA (HCR), hepatitis D surface antibody (HDAb), and hepatitis E antibody (HEAb), were collected. The NHANES laboratory method manuals described laboratory methodology, quality assurance, and monitoring. Due to the high frequency of missing values, variables including socioeconomic status, LDL-C, cardiac function, and alcohol consumption were excluded. Finally, 39 clinically relevant variables related to liver fibrosis were analysed in our study. The proportion of missing values for each included variable was less than 5%, which were filled using multiple imputation methods in SPSS 26 software.
The existing non-invasive models
Our studies involved several efficient and widely applied noninvasive models for assessing liver fibrosis, including APRI, FIB4, and GPR. These three serological indexes were compared with our prediction model and were calculated as follows: APRI = AST (U/L) / upper limit of normal (ULN) (set at 40 U/L) × 100 / platelet count (×109/L),[25] FIB-4 = age (years) × AST (U/L)/[ALT (U/L)1/2 × platelet (×109/L)],[26] and GPR = [GGT (IU/L)/ULN (set at 50 U/L)]/platelet (×109/L) [27].
Data Analysis
Our study described continuous data using the median and interquartile range (IQR), while categorical data were described using counts and percentages. Since all continuous data had an abnormal distribution, we transformed them into categorical data based on respective criteria during the development of our clinical prediction model.
For model development, all 605 subjects were randomly divided into training and validation cohorts in a 7:3 ratio (425 and 180 subjects, respectively). Logistic regression was used to analyse the correlation between each variable and MS. We selected statistically significant variables (P<0.01) from the univariable logistic regression analysis. We performed the least absolute shrinkage and selection operator (LASSO) regression. Based on the optimal lambda.1se value in the LASSO regression, we selected variables with excellent performance to construct a multivariable logistic regression. Finally, a nomogram was developed to improve the visualisation of results and facilitate clinical application. We evaluated the odds ratio (OR) and 95% confidence interval (CI) for each variable in our model.
Regarding model validation, we performed receiver operating characteristic curve (ROC) analysis and calculated the areas under the ROC curve (AUROC). We used the net reclassification index (NRI) and integrated discrimination improvement (IDI) to compare our model with other models [28,29]. Additionally, we used the Brier score to assess the nomogram’s performance, with a lower score indicating better predictive ability. Decision curves were plotted to display the nomogram’s net benefit, reflecting the clinical benefits provided by the prediction model.
All statistical significance levels in our study were two-sided. The statistical analyses were carried out using R 4.2.2 software.
Results
Baseline demographic and clinical characteristics
Table 1 describes the baseline characteristics of our participants. The median age was 60.0 years. Based on the MS provided by VCTE, liver fibrosis was detected in 79 individuals (13.1%). Among these participants, 47 (59.5%) were male and 32 (40.5%) were female.
We randomly divided 425 participants into a training cohort and 180 into a validation cohort, using a ratio of 7:3 (Table S1). In the training cohort, 242 (56.9%) participants were male, and 58 (13.6%) had liver fibrosis. In the validation cohort, there were 96 (53.3%) male participants and 21 (11.7%) participants with liver fibrosis. The baseline characteristics of the two cohorts did not differ significantly (P > 0.05).
Identification of predictors and the construction of a nomogram
The correlation between each independent variable and MS was evaluated by univariate logistic regression in the training cohort (Table S2). Four-teen variables, including age, smoking, hypertension, ALT, AST, ALP, GGT, albumin, globulin, HDL-c, BMI, WC, HC, and hs-CRP, were found to be statistically significant (P<0.01) and were further analysed by LASSO regression (Figure 2). Among these variables, seven optimal predictors, including Age, ALT, AST, GGT, Albumin, BMI, and HC, were selected to develop a clinical prediction model for liver fibrosis through multivariate logistic regression. The logistic regression analysis results and OR values for these seven optimal predictors are shown in Table S3. These predictors were combined to develop a nomogram to quantify liver fibrosis risk (Figure 3).
Validation of the nomogram
To assess the discrimination of our model, we presented ROC curves and compared them with three other models in both training and validation cohorts. The performance of these models is exhibited in Figure 4 and Table 2.
In the training cohort, the nomogram’s AUC value for predicting liver fibrosis risk was 0.829 (95% CI 0.773-0.884), which was higher than that of APRI (0.724, 95% CI 0.650-0.798), FIB4 (0.695, 95% CI 0.619-0.772), and GPR (0.736, 95% CI 0.6690.802). The difference in AUC values between the nomogram and the other three models was statistically significant (all P < 0.05). The sensitivity and the specificity of the nomogram were 81.0% and 75.5%, respectively.
In the validation cohort, the AUC value of the nomogram was 0.782 (95% CI 0.670-0.894), while the AUC values of APRI, FIB4, and GPR were 0.660 (95% CI 0.520-0.799), 0.658 (95% CI 0.544-0.772), and 0.734 (95% CI 0.596 -0.872), respectively. The sensitivity of the nomogram was 66.7%, and the specificity was 79.9%.
Additionally, we calculated the NRI and IDI values, which showed that the nomogram had the highest NRI and IDI values among APRI, FIB4, and GPR in both training and validation cohorts, indicating that the nomogram had the best discrimination capability for identifying liver fibrosis in our participants.
The calibration plot for the probability of liver fibrosis consistently showed optimal agreement between the prediction model and actual observation in both training cohort (P = 0.328, Brier score = 0.091) and validation cohort (P = 0.877, Brier score = 0.076) (Figure S1), indicating the accurate prediction offered by our nomogram. Evaluation of the clinical utility of the nomogram
We conducted DCA to further evaluate the clinical application value of the nomogram in predicting liver fibrosis. DCA revealed that the nomogram had a better net benefit and more significant advantage compared to the other three models (Figure S2) in both training and validation cohorts.
|
Level |
Overall |
Non-liver fibrosis |
Liver fibrosis |
|
|
n |
605 |
526 |
79 |
|
|
Gender (%) |
Male |
338 (55.9) |
291 ( 55.3) |
47 ( 59.5) |
|
Female |
267 (44.1) |
235 ( 44.7) |
32 ( 40.5) |
|
|
Age (years) |
<45 |
96 (15.9) |
92 ( 17.5) |
4 (5.1) |
|
45-60 |
184 (30.4) |
165 ( 31.4) |
19 ( 24.1) |
|
|
≥60 |
325 (53.7) |
269 ( 51.1) |
56 ( 70.9) |
|
|
Race (%) |
Mexican American |
20 ( 3.3) |
18 (3.4) |
2 (2.5) |
|
Other Hispanic |
56 ( 9.3) |
47 (8.9) |
9 ( 11.4) |
|
|
Non-Hispanic White |
93 (15.4) |
78 ( 14.8) |
15 ( 19.0) |
|
|
Non-Hispanic Black |
210 (34.7) |
173 ( 32.9) |
37 ( 46.8) |
|
|
Other Race |
226 (37.4) |
210 ( 39.9) |
16 ( 20.3) |
|
|
Smoking (%) |
No |
329 (54.4) |
303 ( 57.6) |
26 ( 32.9) |
|
Yes |
276 (45.6) |
223 ( 42.4) |
53 ( 67.1) |
|
|
Diabetes (%) |
No |
501 (82.8) |
444 ( 84.4) |
57 ( 72.2) |
|
Yes |
104 (17.2) |
82 ( 15.6) |
22 ( 27.8) |
|
|
Hypertension (%) |
No |
324 (53.6) |
298 ( 56.7) |
26 ( 32.9) |
|
Yes |
281 (46.4) |
228 ( 43.3) |
53 ( 67.1) |
|
|
HBV vaccine (%) |
No |
471 (77.9) |
407 ( 77.4) |
64 ( 81.0) |
|
Yes |
134 (22.1) |
119 ( 22.6) |
15 ( 19.0) |
|
|
Insomnia (%) |
No |
434 (71.7) |
383 ( 72.8) |
51 ( 64.6) |
|
Yes |
171 (28.3) |
143 ( 27.2) |
28 ( 35.4) |
|
|
WBC (×10^9/L) (%) |
<4 |
27 ( 4.5) |
21 (4.0) |
6 (7.6) |
|
4-10 |
532 (87.9) |
468 ( 89.0) |
64 ( 81.0) |
|
|
≥10 |
46 ( 7.6) |
37 (7.0) |
9 ( 11.4) |
|
|
NEU (×10^9/L) (%) |
<1.5 |
13 ( 2.1) |
10 (1.9) |
3 (3.8) |
|
1.5-7 |
563 (93.1) |
492 ( 93.5) |
71 ( 89.9) |
|
|
≥7 |
29 ( 4.8) |
24 (4.6) |
5 (6.3) |
|
|
MON (×10^9/L) (%) |
<0.8 |
558 (92.2) |
488 ( 92.8) |
70 ( 88.6) |
|
≥0.8 |
47 ( 7.8) |
38 ( 7.2) |
9 ( 11.4) |
|
|
HB (g/L) |
<110 |
17 ( 2.8) |
13 ( 2.5) |
4 ( 5.1) |
|
≥110 |
588 (97.2) |
513 ( 97.5) |
75 ( 94.9) |
|
|
PLT (×10^9/L) |
<150 |
35 ( 5.8) |
21 ( 4.0) |
14 ( 17.7) |
|
≥150 |
570(94.2) |
505 (96.0) |
65(82.3) |
|
|
ALT (IU/L) |
<40 |
548 (90.6) |
493 ( 93.7) |
55 ( 69.6) |
|
≥40 |
57 ( 9.4) |
33 (6.3) |
24 ( 30.4) |
|
|
AST(IU/L) |
<40 |
563 (93.1) |
506 ( 96.2) |
57 ( 72.2) |
|
≥40 |
42 ( 6.9) |
20 (3.8) |
22 ( 27.8) |
|
|
ALP (IU/L) |
<120 |
571 (94.4) |
505 ( 96.0) |
66 ( 83.5) |
|
≥120 |
34 ( 5.6) |
21 (4.0) |
13 ( 16.5) |
|
|
GGT(IU/L) |
<50 |
501 (82.8) |
457 ( 86.9) |
44 ( 55.7) |
|
≥50 |
104 (17.2) |
69 ( 13.1) |
35 ( 44.3) |
|
|
BUN (mmol/L) |
<3 |
30 ( 5.0) |
27 (5.1) |
3 (3.8) |
|
3-7 |
471 (77.9) |
416 ( 79.1) |
55 ( 69.6) |
|
|
≥7 |
104 (17.2) |
83 ( 15.8) |
21 ( 26.6) |
|
|
CRE (mg/dL) |
<100 |
516 (85.3) |
457 ( 86.9) |
59 ( 74.7) |
|
≥100 |
89 (14.7) |
69 ( 13.1) |
20 ( 25.3) |
|
|
Albumin (g/L) |
<35 |
25 ( 4.1) |
12 (2.3) |
13 ( 16.5) |
|
≥35 |
580 (95.9) |
514 ( 97.7) |
66 ( 83.5) |
|
|
Globulin (g/L) |
<40 |
571 (94.4) |
505 ( 96.0) |
66 ( 83.5) |
|
≥40 |
34 ( 5.6) |
21 (4.0) |
13 ( 16.5) |
|
|
TC (mmol/L) |
<6 |
534 (88.3) |
461 ( 87.6) |
73 ( 92.4) |
|
≥6 |
71 (11.7) |
65 ( 12.4) |
6 (7.6) |
|
|
HDL-c (mmol/L) |
<1.04 |
105 (17.4) |
83 ( 15.8) |
22 ( 27.8) |
|
≥1.04 |
500 (82.6) |
443 ( 84.2) |
57 ( 72.2) |
|
|
LDH (IU/L) |
<135 |
118 (19.5) |
102 ( 19.4) |
16 ( 20.3) |
|
135-220 |
454 (75.0) |
402 ( 76.4) |
52 ( 65.8) |
|
|
≥220 |
33 ( 5.5) |
22 (4.2) |
11 ( 13.9) |
|
|
TB (umol/L) |
<10 |
415 (68.6) |
367 ( 69.8) |
48 ( 60.8) |
|
≥10 |
190 (31.4) |
159 ( 30.2) |
31 ( 39.2) |
|
|
TG (mmol/L) |
<1.7 |
436 (72.1) |
383 ( 72.8) |
53 ( 67.1) |
|
≥1.7 |
169 (27.9) |
143 ( 27.2) |
26 ( 32.9) |
|
|
UA (umol/L) |
<400 |
471 (77.9) |
417 ( 79.3) |
54 ( 68.4) |
|
≥400 |
134 (22.1) |
109 ( 20.7) |
25 ( 31.6) |
|
|
BMI (kg/m^2) |
<25 |
208 (34.4) |
187 ( 35.6) |
21 ( 26.6) |
|
25-30 |
214 (35.4) |
196 ( 37.3) |
18 ( 22.8) |
|
|
≥30 |
183 (30.2) |
143 ( 27.2) |
40 ( 50.6) |
|
|
WC (cm) |
<90 |
202 (33.4) |
189 ( 35.9) |
13 ( 16.5) |
|
≥90 |
403 (66.6) |
337 ( 64.1) |
66 ( 83.5) |
|
|
AC (cm) |
<30 |
197 (32.6) |
178 ( 33.8) |
19 ( 24.1) |
|
≥30 |
408 (67.4) |
348 ( 66.2) |
60 ( 75.9) |
|
|
HC (cm) |
<100 |
315 (52.1) |
290 ( 55.1) |
25 ( 31.6) |
|
≥100 |
290 (47.9) |
236 ( 44.9) |
54 ( 68.4) |
|
|
HbA1c (%) |
<6 |
421 (69.6) |
380 ( 72.2) |
41 ( 51.9) |
|
≥6 |
184 (30.4) |
146 ( 27.8) |
38 ( 48.1) |
|
|
HAAb (%) |
Negative |
167 (27.6) |
147 ( 27.9) |
20 ( 25.3) |
|
Positive |
438 (72.4) |
379 ( 72.1) |
59 ( 74.7) |
|
|
HBsAg (%) |
Negative |
562 (92.9) |
492 ( 93.5) |
70 ( 88.6) |
|
Positive |
43 ( 7.1) |
34 (6.5) |
9 ( 11.4) |
|
|
HBsAb (%) |
Negative |
186 (30.7) |
156 ( 29.7) |
30 ( 38.0) |
|
Positive |
419 (69.3) |
370 ( 70.3) |
49 ( 62.0) |
|
|
HCR (%) |
Negative |
559 (92.4) |
497 ( 94.5) |
62 ( 78.5) |
|
Positive |
46 ( 7.6) |
29 (5.5) |
17 ( 21.5) |
|
|
HDAb (%) |
Negative |
599 (99.0) |
521 ( 99.0) |
78 ( 98.7) |
|
Positive |
6 ( 1.0) |
5 (1.0) |
1 (1.3) |
|
|
HEAb (%) |
Negative |
590 (97.5) |
514 ( 97.7) |
76 ( 96.2) |
|
Positive |
15 ( 2.5) |
12 (2.3) |
3 (3.8) |
|
|
Hs-CRP (mg/L) |
<5 |
497 (82.1) |
444 ( 84.4) |
53 ( 67.1) |
|
≥5 |
108 (17.9) |
82 ( 15.6) |
26 ( 32.9) |
|
|
MS (kPa) (%) |
<8.4 |
526 (86.9) |
526 (100.0) |
0 (0.0) |
|
≥ 8.4 |
79 (13.1) |
0 (0.0) |
79 (100.0) |
Table 1: Baseline characteristics of participants.
|
AUC (95% CI) |
Sensitivity (95% CI) |
Specificity (95% CI) |
P values |
NRI (95% CI) |
P values |
IDI (95% CI) |
P values |
|
|
Training cohort |
||||||||
|
Nomogram |
0.829 (0.773- 0.884) |
0.810 (0.709- 0.911) |
0.755 (0.711- 0.799) |
- |
Ref |
- |
Ref |
- |
|
APRI |
0.724 (0.650- 0.798) |
0.603 (0.478- 0.729) |
0.747 (0.702- 0.791) |
0.008 |
-0.298 (-0.172-- 0.424) |
0.001 |
-0.189 (-0.137- -0.241) |
<0.001 |
|
FIB-4 |
0.695 (0.6190.772) |
0.672 (0.5520.793) |
0.640 (0.5910.689) |
0.001 |
-0.310 (-0.161-- 0.458) |
<0.001 |
-0.139 (-0.082- -0.196) |
<0.001 |
|
GPR |
0.736 (0.669- 0.802) |
0.655 (0.533- 0.777) |
0.728 (0.682- 0.773) |
0.020 |
-0.256 (-0.138-- 0.375) |
<0.001 |
-0.166 (-0.111- -0.220) |
<0.001 |
|
Validation cohort |
||||||||
|
Nomogram |
0.782 (0.670- 0.894) |
0.667 (0.465- 0.868) |
0.799 (0.736- 0.861) |
- |
Ref |
- |
Ref |
- |
|
APRI |
0.660 (0.520- 0.799) |
0.524 (0.310- 0.737) |
0.792 (0.729- 0.855) |
0.018 |
-0.274 (-0.103-- 0.445) |
0.002 |
-0.214 (-0.151- -0.277) |
<0.001 |
|
FIB-4 |
0.658 (0.544- 0.772) |
0.952 (0.861- 1.000) |
0.377 (0.302- 0.453) |
0.011 |
-0.296 (-0.126-- 0.465) |
0.001 |
-0.148 (-0.084- -0.213) |
<0.001 |
|
GPR |
0.734 (0.596- 0.872) |
0.667 (0.465- 0.868) |
0.799 (0.736- 0.861) |
0.021 |
-0.301 (-0.159-- 0.444) |
<0.001 |
-0.183 (-0.117- -0.249) |
<0.001 |
Table 2: Performance of the nomogram and other existing models.
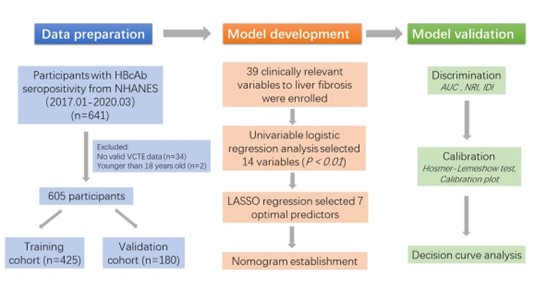
Figure 1: Flow diagram of study design.
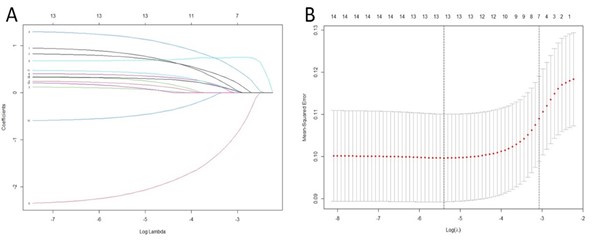
Figure 2: Variables selection using LASSO regression. A. The ten-fold cross-validation via minimum criteria for selecting the optimal value of the tuning parameter (λ). Dotted vertical lines were drawn at the value with the minimum criteria and one standard error of the minimum criteria. B. The LASSO coefficient profiles of the 14 variables associated with liver fibrosis. A dotted vertical line was drawn at the optimal λ value identified through ten-fold cross-validation. The resulting seven predictors with non-zero coefficients were identified based on the log (λ1se) value.

Figure 3: The nomogram for predicting the risk of liver fibrosis in individuals with HBcAb seropositivity.
Figure 4: ROC curves for predicting liver fibrosis in training cohort (A) and validation cohort (B). The x-axis displayed the specificity, while the y-axis showed the sensitivity.
|
Overall |
Training cohort |
Validation cohort |
p |
|
|
n |
605 |
425 |
180 |
|
|
Gender (male, %) |
338 (55.9) |
242 (56.9) |
96 (53.3) |
0.467 |
|
Age (%) |
0.991 |
|||
|
<45 |
96 (15.9) |
68 (16.0) |
28 (15.6) |
|
|
45-60 |
184 (30.4) |
129 (30.4) |
55 (30.6) |
|
|
≥60 |
325 (53.7) |
228 (53.6) |
97 (53.9) |
|
|
Race (%) |
0.744 |
|||
|
Mexican American |
20 ( 3.3) |
14 ( 3.3) |
6 ( 3.3) |
|
|
Non-Hispanic Black |
210 (34.7) |
145 (34.1) |
65 (36.1) |
|
|
Non-Hispanic White |
93 (15.4) |
68 (16.0) |
25 (13.9) |
|
|
Other Hispanic |
56 ( 9.3) |
43 (10.1) |
13 ( 7.2) |
|
|
Other Race |
226 (37.4) |
155 (36.5) |
71 (39.4) |
|
|
Smoking (Yes, %) |
276 (45.6) |
194 (45.6) |
82 (45.6) |
1.000 |
|
Diabetes (Yes, %) |
104 (17.2) |
81 (19.1) |
23 (12.8) |
0.079 |
|
Hypertension (Yes, %) |
281 (46.4) |
198 (46.6) |
83 (46.1) |
0.985 |
|
HBV vaccine (Yes, %) |
134 (22.1) |
90 (21.2) |
44 (24.4) |
0.437 |
|
Insomnia (Yes, %) |
171 (28.3) |
122 (28.7) |
49 (27.2) |
0.786 |
|
WBC (×10^9/L) (%) |
0.393 |
|||
|
<4 |
27 ( 4.5) |
16 ( 3.8) |
11 ( 6.1) |
|
|
4-10 |
532 (87.9) |
375 (88.2) |
157 (87.2) |
|
|
≥10 |
46 ( 7.6) |
34 ( 8.0) |
12 ( 6.7) |
|
|
NEU (×10^9/L) (%) |
0.155 |
|||
|
<1.5 |
13 ( 2.1) |
6 ( 1.4) |
7 ( 3.9) |
|
|
1.5-7 |
563 (93.1) |
398 (93.6) |
165 (91.7) |
|
|
≥7 |
29 ( 4.8) |
21 ( 4.9) |
8 ( 4.4) |
|
|
MON (≥0.8×10^9/L, %) |
47 ( 7.8) |
36 ( 8.5) |
11 ( 6.1) |
0.409 |
|
HB (≥110g/L,%) |
588 (97.2) |
416 ( 97.9) |
172 ( 95.6) |
0.189 |
|
PLT (≥150×10^9/L) (%) |
570 (94.2) |
398 (93.6) |
172 ( 95.6) |
0.466 |
|
ALT (≥40IU/L, %) |
57 ( 9.4) |
45 (10.6) |
12 ( 6.7) |
0.175 |
|
AST (≥40IU/L, %) |
42 ( 6.9) |
34 ( 8.0) |
8 ( 4.4) |
0.162 |
|
ALP (≥120IU/L, %) |
34 ( 5.6) |
22 ( 5.2) |
12 ( 6.7) |
0.593 |
|
GGT (≥50IU/L, %) |
104 (17.2) |
85 (20.0) |
19 (10.6) |
0.007 |
|
BUN (mmol/L) (%) |
0.475 |
|||
|
<3 |
30 ( 5.0) |
22 ( 5.2) |
8 ( 4.4) |
|
|
3-7 |
471 (77.9) |
335 (78.8) |
136 (75.6) |
|
|
≥7 |
104 (17.2) |
68 (16.0) |
36 (20.0) |
|
|
CRE (≥100mg/dL, %) |
89 (14.7) |
62 (14.6) |
27 (15.0) |
0.996 |
|
Albumin (≥35g/L, %) |
580 (95.9) |
408 (96.0) |
172 (95.6) |
0.978 |
|
Globulin (≥40g/L, %) |
34 ( 5.6) |
28 ( 6.6) |
6 ( 3.3) |
0.163 |
|
TC (≥6mmol/L, %) |
71 (11.7) |
51 (12.0) |
20 (11.1) |
0.863 |
|
HDL-c (≥1.04mmol/L, %) |
500 (82.6) |
357 (84.0) |
143 (79.4) |
0.217 |
|
LDH (IU/L) (%) |
0.317 |
|||
|
<135 |
118 (19.5) |
81 (19.1) |
37 (20.6) |
|
|
135-220 |
454 (75.0) |
317 (74.6) |
137 (76.1) |
|
|
≥220 |
33 ( 5.5) |
27 ( 6.4) |
6 ( 3.3) |
|
|
TB (≥10umol/L, %) |
190 (31.4) |
127 (29.9) |
63 (35.0) |
0.253 |
|
TG (≥1.7mmol/L, %) |
169 (27.9) |
120 (28.2) |
49 (27.2) |
0.877 |
|
UA (≥400umol/L, %) |
134 (22.1) |
89 (20.9) |
45 (25.0) |
0.321 |
|
BMI (kg/m^2) (%) |
0.632 |
|||
|
<25 |
208 (34.4) |
151 (35.5) |
57 (31.7) |
|
|
25-30 |
214 (35.4) |
149 (35.1) |
65 (36.1) |
|
|
≥30 |
183 (30.2) |
125 (29.4) |
58 (32.2) |
|
|
WC (≥90cm, %) |
403 (66.6) |
280 (65.9) |
123 (68.3) |
0.624 |
|
AC (≥30cm, %) |
408 (67.4) |
279 (65.6) |
129 (71.7) |
0.177 |
|
HC (≥100cm, %) |
290 (47.9) |
199 (46.8) |
91 (50.6) |
0.453 |
|
HbA1c (≥6, %) |
184 (30.4) |
142 (33.4) |
42 (23.3) |
0.018 |
|
HAAb (Positive, %) |
438 (72.4) |
303 (71.3) |
135 (75.0) |
0.405 |
|
HBsAg (Positive, %) |
43 ( 7.1) |
23 ( 5.4) |
20 (11.1) |
0.02 |
|
HBsAb (Positive, %) |
419 (69.3) |
306 (72.0) |
113 (62.8) |
0.031 |
|
HCR (Positive, %) |
46 ( 7.6) |
33 ( 7.8) |
13 ( 7.2) |
0.95 |
|
HDAb (Positive, %) |
6 ( 1.0) |
5 ( 1.2) |
1 ( 0.6) |
0.798 |
|
HEAb (Positive, %) |
15 ( 2.5) |
11 ( 2.6) |
4 ( 2.2) |
1.000 |
|
hs-CRP (≥5mg/L, %) |
108 (17.9) |
78 (18.4) |
30 (16.7) |
0.705 |
|
MS (≥8.4kPa, %) |
79 (13.1) |
58 (13.6) |
21 (11.7) |
0.597 |
Table S1: Baseline characteristics of training and validation cohorts.
|
Variables |
B |
SE |
OR |
CI |
Z |
P |
|
Gender |
-0.246 |
0.29 |
0.78 |
0.44-1.38 |
-0.847 |
0.397 |
|
Age |
0.754 |
0.24 |
2.13 |
1.33-3.4 |
3.147 |
0.002 |
|
Race |
||||||
|
Mexican American |
-0.154 |
0.868 |
0.86 |
0.16-4.7 |
-0.178 |
0.859 |
|
Other Hispanic |
0.294 |
0.416 |
1.34 |
0.54-3.31 |
0.637 |
0.524 |
|
Non-Hispanic White |
0.034 |
0.837 |
1.03 |
0.2-5.34 |
0.041 |
0.968 |
|
Non-Hispanic Black |
0.448 |
0.791 |
1.57 |
0.33-7.38 |
0.567 |
0.571 |
|
Other Race |
-0.995 |
0.837 |
0.37 |
0.07-1.91 |
-1.188 |
0.235 |
|
Smoking |
0.772 |
0.29 |
2.16 |
1.23-3.82 |
2.659 |
0.008 |
|
Diabetes |
0.464 |
0.329 |
1.59 |
0.83-3.03 |
1.41 |
0.158 |
|
Hypertension |
0.813 |
0.293 |
2.25 |
1.27-4 |
2.777 |
0.005 |
|
HBV vaccine |
-0.159 |
0.358 |
0.85 |
0.42-1.72 |
-0.443 |
0.658 |
|
Insomnia |
0.49 |
0.295 |
1.63 |
0.92-2.91 |
1.66 |
0.097 |
|
WBC |
-0.079 |
0.418 |
0.92 |
0.41-2.1 |
-0.19 |
0.85 |
|
NEU |
-0.733 |
0.63 |
0.48 |
0.14-1.65 |
-1.164 |
0.244 |
|
MON |
0.47 |
0.447 |
1.6 |
0.67-3.84 |
1.051 |
0.293 |
|
HB |
1.68 |
0.686 |
5.36 |
1.4-20.57 |
2.446 |
0.014 |
|
PLT |
-1.636 |
0.421 |
0.19 |
0.09-0.44 |
-3.883 |
0.012 |
|
ALT |
1.855 |
0.346 |
6.39 |
3.24-12.59 |
5.361 |
<0.001 |
|
AST |
2.144 |
0.381 |
8.54 |
4.05-18.01 |
5.633 |
<0.001 |
|
ALP |
1.61 |
0.46 |
5 |
2.03-12.32 |
3.502 |
<0.001 |
|
GGT |
1.445 |
0.3 |
4.24 |
2.36-7.64 |
4.819 |
<0.001 |
|
BUN |
0.55 |
0.305 |
1.73 |
0.95-3.15 |
1.803 |
0.071 |
|
CRE |
0.865 |
0.338 |
2.38 |
1.22-4.61 |
2.558 |
0.011 |
|
Albumin |
-2.109 |
0.509 |
0.12 |
0.04-0.33 |
-4.142 |
<0.001 |
|
Globulin |
1.396 |
0.423 |
4.04 |
1.76-9.26 |
3.297 |
0.001 |
|
TC |
-0.418 |
0.494 |
0.66 |
0.25-1.73 |
-0.847 |
0.397 |
|
HDL-c |
-0.944 |
0.326 |
0.39 |
0.21-0.74 |
-2.898 |
0.004 |
|
LDH |
0.738 |
0.306 |
2.09 |
1.15-3.81 |
2.41 |
0.016 |
|
TB |
0.593 |
0.291 |
1.81 |
1.02-3.2 |
2.039 |
0.041 |
|
TG |
0.249 |
0.303 |
1.28 |
0.71-2.32 |
0.822 |
0.411 |
|
UA |
0.726 |
0.31 |
2.07 |
1.13-3.8 |
2.344 |
0.019 |
|
BMI |
0.553 |
0.183 |
1.74 |
1.21-2.49 |
3.03 |
0.002 |
|
WC |
1.027 |
0.364 |
2.79 |
1.37-5.7 |
2.821 |
0.005 |
|
AC |
0.568 |
0.326 |
1.77 |
0.93-3.34 |
1.746 |
0.081 |
|
HC |
0.977 |
0.299 |
2.66 |
1.48-4.77 |
3.267 |
0.001 |
|
HbA1c |
0.646 |
0.286 |
1.91 |
1.09-3.34 |
2.258 |
0.024 |
|
HAAb |
0.165 |
0.321 |
1.18 |
0.63-2.21 |
0.515 |
0.607 |
|
HBsAg |
1.102 |
0.477 |
3.01 |
1.18-7.67 |
2.309 |
0.021 |
|
HBsAb |
-0.263 |
0.303 |
0.77 |
0.42-1.39 |
-0.867 |
0.386 |
|
HCR |
0.965 |
0.42 |
2.62 |
1.15-5.98 |
2.3 |
0.021 |
|
HDAb |
0.465 |
1.127 |
1.59 |
0.17-14.5 |
0.413 |
0.68 |
|
HEAb |
0.351 |
0.795 |
1.42 |
0.3-6.75 |
0.442 |
0.659 |
|
hs-CRP |
0.834 |
0.317 |
2.3 |
1.24-4.29 |
2.631 |
0.009 |
Table S2: The results of univariate logistic regression.
|
Variables |
B |
SE |
OR |
CI |
Z |
P |
|
Age |
1.024 |
0.281 |
2.78 |
1.61-4.83 |
3.643 |
<0.001 |
|
ALT |
1.326 |
0.522 |
3.77 |
1.35-10.48 |
2.541 |
0.011 |
|
AST |
0.894 |
0.563 |
2.45 |
0.81-7.37 |
1.59 |
0.112 |
|
GGT |
0.906 |
0.385 |
2.47 |
1.16-5.26 |
2.356 |
0.018 |
|
Albumin |
-2.583 |
0.621 |
0.08 |
0.02-0.26 |
-4.161 |
<0.000 |
|
BMI |
0.569 |
0.317 |
1.77 |
0.95-3.29 |
1.797 |
0.072 |
|
HC |
0.471 |
0.511 |
1.6 |
0.59-4.36 |
0.922 |
0.357 |
Table S3: The results of multivariate logistic regression.

Figure S1: Calibration curves for evaluating the nomogram performance in both training cohort (A) and validation cohort (B). The x-axis displayed predicted probability of liver fibrosis, while the y-axis displayed actual probability.

Figure S2: Decision curves for clinical utility of the nomogram in training cohort (A) and validation cohort (B). The x-axis displayed the threshold probability, while the y-axis displayed net benefits.
Discussion
In this study, we developed and validated a novel prediction model for liver fibrosis in individuals with seropositive HBcAb using data from NHANES. The prediction model demonstrated satisfactory discrimination and calibration ability in both training and validation cohorts and showed clinical usefulness in decision curve analysis.
Individuals with HBcAb seropositivity had been found to have a higher morbidity of liver cirrhosis compared to the general population. This may be due to occult HBV or HBV reactivation [6]. Additionally, HBcAb is tightly linked to cirrhotic complications, cirrhosis, and possibly HCC [30]. Early identification of HBcAbseropositive individuals at high risk for progression to liver fibrosis could provide timely and direct high-value care and decrease the morbidity and mortality of hepatic decompensation [18]. Thus, we shed light on populations with HBcAb seropositivity and established a model to investigate their liver fibrosis risk.
In our study, liver fibrosis was evaluated and defined based on data from VCTE. For HBV-induced cirrhosis, the cut-off value of VCTE was reported to range from 8.4 kpa to 18.2 kpa, with 11.0 (±1) kpa recommended as the optimal value [31]. However, these cut-offs were designed for patients with HBV-induced cirrhosis, not those with HBcAb seropositivity-related liver fibrosis. The primary objective of our prediction model was to screen for liver fibrosis in its early stages, allowing patients to adopt preventive measures or receive treatment promptly. We ultimately utilized 8.4 kpa as the cut-off value, which appeared to be the smallest value in the range. A lower threshold could include more positive outcomes in our analysis, which may increase the false positive results but decrease the rate of missed diagnosis for individuals with liver fibrosis.
According to our model, Age, ALT, AST, GGT, Albumin, BMI, and HC were strongly associated with liver fibrosis. Increasing age and persistently raised ALT, which could reflect impaired liver function, were considered imperative risk factors for liver fibrosis and even cirrhosis [5]. Similarly, the increase of AST and GGT and the decrease of Albumin could also reflect liver dysfunction and correlate to the progression of liver fibrosis [5]. Our model showed that the increased BMI and HC, which could reflect the overweight of our participants, were significant risk factors for fibrosis. Obesity has been identified as an essential cofactor in accelerating liver fibrosis in non-alcoholic fatty liver disease (NAFLD) [32]. Maintaining proper weight appeared to be a necessary preventive measure to avoid disease progress not only for patients with NAFLD but also for individuals with seropositive HBcAb. In addition, we collected multiple variables, including evident risk factors for liver fibrosis, such as various hepatitis virus infections. Among these biomarkers, HBsAg and HCR were found to be related to liver fibrosis in univariable logistic regression, but neither of these markers was included in our model. Whether the hepatitis virus replicates seemed to be not a remarkable predictor for liver fibrosis in individuals with seropositive HBcAb.
Several prediction models for liver fibrosis have been developed. A study [33] found that liver stiffness measurement (LSM), PT, and PLT were independent risk factors for CHB-related liver fibrosis. Xu et al. [34] constructed nomograms consisting of 10 variables to predict liver fibrosis, which could be used to evaluate the degree of disease in CHB patients. The serum international normalized ratio (INR), PLT, and type III N-terminal peptide (PIIINP) were also identified as predictors of advanced liver fibrosis and cirrhosis in patients with CHB, chronic hepatitis C, NAFLD, alcoholic liver disease, and autoimmune hepatitis [16]. Another nomogram comprised of laminin, PIIINP, and PLT to predict significant liver fibrosis in CHB patients [35]. Zhang et al. [36] proposed a model based on five clinical characteristics, including procollagen PIIINP, type IV collagen (IV-C), hyaluronan, platelet, and liver stiffness, to diagnose HBV-related liver cirrhosis. Although these methods exhibited remarkable diagnostic performance, some biomarkers included in these models were sophisticated and challenging to obtain in general hospitals, hindering their popularization. Our final model for screening liver fibrosis includes routine biomarkers and clinical markers that are easily accessible in general hospitals and local clinics. This makes the model valuable and userfriendly in clinical practice. Additionally, our model incorporates a combination of biochemical and anthropometric variables. This diverse set of predictors allows for a more comprehensive assessment of liver fibrosis risk compared to models that rely solely on biochemical markers.
Our nomogram outperforms existing models in several key metrics, including the NRI and IDI. These improvements suggest that our model can better classify individuals correctly regarding their risk of liver fibrosis. This could be explained by the fact that these models were designed to screen for liver fibrosis in CHB patients instead of individuals with seropositive HBcAb. Our nomogram could be an effective screening tool to meet the urgent needs of these individuals. In addition, most existing models for liver fibrosis were constructed using continuous indicators [16,33,35,36]. However, small changes in continuous data have little effect on prediction and classification, making these models inefficient in discrimination [37]. Moreover, the detailed data of continuous values makes it challenging to manipulate the nomogram. Our study effectively transformed continuous variables into ordinal variables to improve the model’s prediction performance and practicability. The application of the LASSO regression for selecting the most relevant predictors enhanced the model’s predictive accuracy and effectively reduced the risk of overfitting. The DCA also supports the superior clinical utility of our nomogram, as it provides more accurate risk predictions that can inform clinical decision-making.
The study also had some limitations. Firstly, we relied mainly on data from NHANES, which limited our ability to collect and analyse data beyond what was presented in the database. For example, the database unfortunately lacks information regarding HBV DNA levels and the age of HBsAg serological clearance, thereby leading to incomplete follow-up data for some participants with HBV infection. Participants with active hepatitis virus replication might be in the acute phase of viral hepatitis and did not exhibit liver fibrosis during NHANES examinations, leading to an underestimation of fibrosis progression. Additionally, some valuable variables had to be excluded due to distinct missing values, making it difficult to correlate risk factors and liver fibrosis thoroughly. In the future, we plan to optimize the model by analysing more relevant variables. Second, while VCTE is regarded as one of the most reliable methods for diagnosing liver fibrosis, it cannot completely replace the significant diagnostic value of liver biopsy. The accuracy of VCTE may be affected by various factors such as obesity, increased transaminase, and operator skills [31]. Therefore, the definition of liver fibrosis in our study was less conclusive than the identification provided by liver biopsy, which could influence the establishment of the model. To evaluate the model’s efficacy, extensive external validation based on liver biopsy data from multicentre studies should be conducted in the future. Third, although our cohort was large, the number of outcomes with liver fibrosis was relatively small, which may have caused residual bias. A larger cohort and more data need to be collected to address this issue.
Conclusion
In summary, this paper provides a novel and effective clinical nomogram for screening liver fibrosis risk in individuals with seropositive HBcAb. The nomogram surpasses existing models by providing a more precise, comprehensive, and practical tool for clinical application. Individuals at high risk of liver fibrosis can undergo more accurate examinations to confirm the diagnosis, which could facilitate early and personalized lifestyle or medical intervention effectively.
Author Contributions: Jing Yuan and Hu Zhang designed the study. Yiding Chen, Jing Yuan, Ling Xiao, and Min Zhou collected and analyzed data. Yiding Chen and Jing Yuan drafted the manuscript. Hu Zhang edited the manuscript and acted as the corresponding author.
Funding: This research was funded by the West China Hospital of Sichuan University 1.3.5 Excellence in Discipline Project (No. ZYJC18037).
Conflict of interest: The authors declare that the research was conducted in the absence of any commercial or financial relationships that could be construed as a potential conflict of interest.
References
- Schmit N, Nayagam S, Thursz M. R, & Hallett T. B. (2021). The global burden of chronic hepatitis B virus infection: Comparison of countrylevel prevalence estimates from four research groups. International Journal of Epidemiology. 50:560–569.
- D’Amico G, Garcia-Tsao G, & Pagliaro L. (2006). Natural history and prognostic indicators of survival in cirrhosis: A systematic review of 118 studies. Journal of Hepatology, 44: 217–231.
- European Association for the Study of the Liver. Electronic address: easloffice@easloffice.eu & European Association for the Study of the Liver. (2017). EASL 2017 Clinical Practice Guidelines on the management of hepatitis B virus infection. Journal of Hepatology, 67:370–398.
- Liaw Y.-F, Sung J. J. Y, Chow W. C, Farrell G, Lee C.-Z, et al (2004). Lamivudine for patients with chronic hepatitis B and advanced liver disease. The New England Journal of Medicine, 351: 1521–1531.
- Trépo C, Chan H. L. Y, & Lok A. (2014). Hepatitis B virus infection. Lancet (London, England), 384: 2053–2063.
- Huang S.-W, Chen C, Kong H.-Y, & Huang J.-Q. (2022). Prevalence of Cirrhosis/Advanced Fibrosis Among HBsAg-Negative and HBcAbPositive US Adults: A Nationwide Population-Based Study. Infectious Diseases and Therapy, 11: 1901–1916.
- Malagnino, V, Cerva, C, Cingolani, A, Ceccherini-Silberstein, F, Vergori, A, et al (2021). HBcAb Positivity Increases the Risk of Severe Hepatic Fibrosis Development in HIV/HCV-Positive Subjects From the ICONA Italian Cohort of HIV-Infected Patients. Open Forum Infectious Diseases, 8:ofaa566.
- Zhang M, Wu R, Jiang J, Minuk G. Y, & Niu, J. (2013). The presence of hepatitis B core antibody is associated with more advanced liver disease in alcoholic patients with cirrhosis. Alcohol (Fayetteville, N.Y.), 47:553–558.
- Bedossa P, & Carrat F. (2009). Liver biopsy: The best, not the gold standard. Journal of Hepatology, 50: 1–3.
- Carey E, & Carey W. D. (2010). Noninvasive tests for liver disease, fibrosis, and cirrhosis: Is liver biopsy obsolete? Cleveland Clinic Journal of Medicine, 77: 519–527.
- European Association for Study of Liver & Asociacion Latinoamericana para el Estudio del Higado. (2015). EASL-ALEH Clinical Practice Guidelines: Non-invasive tests for evaluation of liver disease severity and prognosis. Journal of Hepatology, 63: 237–264.
- Regev A, Berho M, Jeffers L. J, Milikowski C, Molina E. G, et al (2002). Sampling error and intraobserver variation in liver biopsy in patients with chronic HCV infection. The American Journal of Gastroenterology, 97: 2614–2618.
- Stockdale A. J, Phillips R. O, Geretti A. M, & HEPIK Study Group. (2016). The gamma-glutamyl transpeptidase to platelet ratio (GPR) shows poor correlation with transient elastography measurements of liver fibrosis in HIV-positive patients with chronic hepatitis B in West Africa. Response to: ‘The gamma-glutamyl transpeptidase to platelet ratio (GPR) predicts significant liver fibrosis and cirrhosis in patients with chronic HBV infection in West Africa’ by Lemoine et al. Gut, 65: 882–884.
- Castera L. (2012). Noninvasive methods to assess liver disease in patients with hepatitis B or C. Gastroenterology, 142:1293-1302.e4.
- Xu W, Hu Q, Chen C, Li W, Li Q, et al (2023). Non-invasive Assessment of Liver Fibrosis Regression in Patients with Chronic Hepatitis B: A Retrospective Cohort Study. Infectious Diseases and Therapy, 12(2), 487–498.
- Ding R, Zhou X, Huang D, Wang Y, Li X, et al (2021). Nomogram for predicting advanced liver fibrosis and cirrhosis in patients with chronic liver disease. BMC Gastroenterology, 21: 190.
- European Association for Study of Liver & Asociacion Latinoamericana para el Estudio del Higado. (2015). EASL-ALEH Clinical Practice Guidelines: Non-invasive tests for evaluation of liver disease severity and prognosis. Journal of Hepatology, 63: 237–264.
- Singh S, Muir A. J, Dieterich D. T, & Falck-Ytter Y. T. (2017). American Gastroenterological Association Institute Technical Review on the Role of Elastography in Chronic Liver Diseases. Gastroenterology, 152: 1544–1577.
- Smith B. D, Morgan R. L, Beckett G. A, Falck-Ytter Y, Holtzman D, et al (2012). Hepatitis C virus testing of persons born during 19451965: Recommendations from the Centers for Disease Control and Prevention. Annals of Internal Medicine, 157: 817–822.
- Li Q, Chen L, & Zhou Y. (2018). Diagnostic accuracy of liver stiffness measurement in chronic hepatitis B patients with normal or mildly elevated alanine transaminase levels. Scientific Reports, 8: 5224.
- Tapper E. B, Castera L, & Afdhal N. H. (2015). FibroScan (vibrationcontrolled transient elastography): Where does it stand in the United States practice. Clinical Gastroenterology and Hepatology: The Official Clinical Practice Journal of the American Gastroenterological Association, 13: 27–36.
- Centers for Disease Control and Prevention. About the National Health and Nutrition Examination Survey. 2022.
- Moons K. G. M, Altman D. G, Reitsma J. B, Ioannidis J. P. A, Macaskill P, et al (2015). Transparent Reporting of a multivariable prediction model for Individual Prognosis or Diagnosis (TRIPOD): Explanation and elaboration. Annals of Internal Medicine, 162: W1-73.
- Zou H, Zhao F, Lv X, Ma X, & Xie Y. (2022). Development and validation of a new nomogram to screen for MAFLD. Lipids in Health and Disease, 21: 133.
- Wai C.-T, Greenson J. K, Fontana R. J, Kalbfleisch J. D, Marrero J. A, et al (2003). A simple noninvasive index can predict both significant fibrosis and cirrhosis in patients with chronic hepatitis C. Hepatology (Baltimore, Md.), 38: 518–526.
- Vallet-Pichard A, Mallet V, Nalpas B, Verkarre V, Nalpas A, et al (2007). FIB-4: An inexpensive and accurate marker of fibrosis in HCV infection. comparison with liver biopsy and fibrotest. Hepatology (Baltimore, Md.), 46: 32–36.
- Li Q, Li W, Huang Y, & Chen L. (2016). The gamma-glutamyl transpeptidase-to-platelet ratio predicts liver fibrosis and cirrhosis in HBeAg-positive chronic HBV infection patients with high HBV DNA and normal or mildly elevated alanine transaminase levels in China. Journal of Viral Hepatitis, 23: 912–919.
- Kerr K. F, McClelland R. L, Brown E. R, & Lumley T. (2011). Evaluating the incremental value of new biomarkers with integrated discrimination improvement. American Journal of Epidemiology, 174: 364–374.
- Pencina, M. J, D’Agostino, R. B, D’Agostino, R. B, & Vasan, R. S. (2008). Evaluating the added predictive ability of a new marker: From area under the ROC curve to reclassification and beyond. Statistics in Medicine, 27: 157–172.
- Chan TT, Chan WK, Wong GLH, Chan AWH, Nik Mustapha NR, et al (2020). Positive Hepatitis B Core Antibody Is Associated With Cirrhosis and Hepatocellular Carcinoma in Nonalcoholic Fatty Liver Disease. The American Journal of Gastroenterology, 115: 867–875.
- Singh S, Muir A. J, Dieterich D. T, & Falck-Ytter Y. T. (2017). American Gastroenterological Association Institute Technical Review on the Role of Elastography in Chronic Liver Diseases. Gastroenterology, 152: 1544–1577.
- Makri E, Goulas A, & Polyzos S. A. (2021). Epidemiology, Pathogenesis, Diagnosis and Emerging Treatment of Nonalcoholic Fatty Liver Disease. Archives of Medical Research, 52: 25–37.
- Cheng, D, Wan G, Sun L, Wang X, Ou W, et al (2020). A Novel Diagnostic Nomogram for Noninvasive Evaluating Liver Fibrosis in Patients with Chronic Hepatitis B Virus Infection. BioMed Research International, 2020: 5218930.
- Xu X, Wang W, Zhang Q, Cai W, Wu M, et al (2021). A Generic Nomogram Predicting the Stage of Liver Fibrosis Based on Serum Biochemical Indicators Among Chronic Hepatitis B Patients. Frontiers in Medicine, 8: 669800.
- Chen Y, Gong J, Zhou W, Jie Y, Li Z, et al (2020). A Novel Prediction Model for Significant Liver Fibrosis in Patients with Chronic Hepatitis B. BioMed Research International, 2020: 6839137.
- Zhang X, Huang P, Wang X, Zhou K, Chen F, et al (2021). Development and validation of a non-invasive model for diagnosing HBV-related liver cirrhosis. Clinica Chimica Acta; International Journal of Clinical Chemistry, 523: 525–531.
- Bertens L. C. M, Moons K. G. M, Rutten F. H, van Mourik Y, Hoes A. W, et al (2016). A nomogram was developed to enhance the use of multinomial logistic regression modeling in diagnostic research. Journal of Clinical Epidemiology, 71: 51–57.
© by the Authors & Gavin Publishers. This is an Open Access Journal Article Published Under Attribution-Share Alike CC BY-SA: Creative Commons Attribution-Share Alike 4.0 International License. Read More About Open Access Policy.