Monica Colt*, Tatyana Atlasman, Yael Dvori, Liki von Oppen-Bezalel, Sharon Rozenblat
CarobWay Ltd, Arlozorov 82 , 5250524 Ramat Gan, Israel
*Corresponding Author: Monica Colt, CarobWay Ltd, Arlozorov 82 , 5250524 Ramat Gan, Israel
Received Date: 28 September 2026
Accepted Date: 06 October 2026
Published Date: 10 October 2026
Citation: Colt M, Atlasman T, Dvori Y, Oppen-Bezalel LV, Rozenblat S (2026) Carob-Derived Sugar as a Natural Low Glycemic Sweetener: Role of D-Pinitol in Glycemic Attenuation. Food Nutr J 10: 349. https://doi.org/10.29011/2575-7091.100349
Abstract
The global rise in type 2 diabetes and metabolic syndrome has created urgent demand for natural sweeteners with low glycemic impact. This study characterizes a carob-derived sugar that naturally co-delivers D-pinitol, a compound with documented insulinsensitizing properties. Across complementary laboratory and animal studies, the carob sugar showed a markedly low glycemic impact. In a simulated digestion model, a substantial share of its D-pinitol (~41%) became available for absorption, while its simple sugars were released only slowly, a pattern predicting a blunted rise in blood sugar after eating. This was confirmed in mice: white carob sugar achieved a glycemic index (GI) of just 4.2, compared with 30.4 for a commercial carob powder and 100 for glucose (p < 0.05). Notably, the refined carob sugar produced a lower GI than the fiber- and polyphenol-rich carob powder, even though both delivered comparable amounts of D-pinitol (~225 vs. ~251 mg/kg bw). This suggests the difference in glycemic response is driven less by total D-pinitol intake than by how readily it is absorbed, alongside other compositional differences between the products. Together, these results position carob-derived sugar as a promising natural, low-GI alternative to conventional sweeteners.
Keywords: Carob Sugar; Carob Molasses; D-Pinitol; Glycemic Index; Insulin Sensitivity; Functional Food
Introduction
Dietary sugar consumption has become one of the most pressing public health concerns of the twenty-first century. The International Diabetes Federation estimates that 589 million adults aged 20–79 worldwide were living with diabetes in 2024, a figure projected to reach 853 million by 2050, with type 2 diabetes accounting for over 90% of cases [1]. In parallel, the global prevalence of obesity has nearly tripled since 1975, and metabolic syndrome, characterized by insulin resistance, hyperglycemia, dyslipidemia, and visceral adiposity, affects roughly one-quarter of the adult population in high-income countries [2,3]. A growing body of epidemiological and interventional evidence implicates the habitual consumption of high glycemic index foods as a modifiable risk factor for these conditions: diets rich in rapidly digestible sugars provoke repeated postprandial glucose spikes, promote compensatory hyperinsulinemia, and progressively erode pancreatic β-cell function [4,5]. The glycemic index (GI), which quantifies how rapidly a carbohydrate containing food raises blood glucose relative to a glucose reference, has therefore become a central parameter in dietary guidelines, food labeling initiatives, and product reformulation strategies aimed at curbing the metabolic disease epidemic [6]. On the GI scale, foods are classified as low (GI ≤ 55), medium (56–69), or high (≥ 70), benchmarked against pure glucose (GI = 100); habitually choosing low-GI foods is linked to steadier blood sugar and lower long-term metabolic risk, which is why GI has become a common reference point for clinicians, product developers, and health-conscious consumers alike.
Against this background, both consumers and the food industry have been actively seeking sweeteners that can reduce glycemic impact without compromising taste, texture, or clean-label appeal. Artificial and high intensity sweeteners offer caloric reduction but face growing consumer skepticism regarding long term safety and fail to replicate the bulk and mouthfeel of sucrose [7]. Sugar alcohols such as erythritol and xylitol provide GI reduction but are associated with gastrointestinal discomfort at functional doses [8]. Natural alternatives, including coconut sugar (GI 35–54), agave syrup (GI 10–19), and raw honey (GI 50–60), all low- to medium-GI options, offer partial improvements but generally cannot achieve genuinely low glycemic responses because they rely on caloric dilution or fructose enrichment rather than on an intrinsic bioactive mechanism that modulates sugar absorption [9,10]. Thus, a critical gap persists: no widely available natural sweetener simultaneously provides one-to-one sugar replacement functionality and substantially reduced glycemic response driven by a specific, mechanistically understood bioactive compound.
Carob pods, the fruits of the carob tree (Ceratonia siliqua L.), have been cultivated throughout the Mediterranean basin for millennia and represent a particularly promising candidate to address this gap. Beyond their natural content of sucrose, glucose, and fructose, carob pods are distinguished by a high concentration of the cyclitol D-pinitol (3-O-methyl-D-chiro-inositol) and are regarded as the richest known natural dietary source of this bioactive compound [11,12].
D-pinitol has attracted considerable attention in metabolic research because of its insulin-like and insulin-sensitizing properties. Mechanistically, D-pinitol activates the PI3K/Akt signaling pathway, promoting GLUT4 glucose transporter translocation to the plasma membrane in skeletal muscle, enhancing hepatic glycogen synthesis through GSK-3β inhibition, and reducing insulin resistance at the receptor level [13–17]. Clinical trials in patients with type 2 diabetes have demonstrated that oral D-pinitol supplementation (600–1200 mg/day) significantly lowers HbA1c, fasting plasma glucose, and HOMA-IR [18]. Furthermore, pharmacokinetic studies in human volunteers have confirmed that D-pinitol from carob syrup is orally absorbed with sustained plasma exposure (time to maximum observed concentration ≈ 4 h; t½ > 5 h) and that co-ingested carbohydrates do not abolish its absorption [19]. The carob pod therefore functions not merely as a source of sugar, but as a natural co-delivery vehicle for both sugars and D-pinitol, a bioactive compound that modulates their metabolic impact.
Several independent studies have reported that carob-based products elicit attenuated postprandial glycemic responses, supporting the concept that the carob matrix may moderate the glycemic impact of its naturally occurring sugars. Dos Santos et al. [20] reported GI values of approximately 40 for carob flour and tablets in both in vivo and in vitro assessments. Papakonstantinou et al. [21] found that a carob-containing snack had a GI of 40 and significantly attenuated postprandial glycemic responses. In a randomized clinical trial, Planes-Munoz et al. [22] reported that commercial carob syrups containing D-pinitol, soluble fibers, and polyphenols exhibited glycemic index values of 56–60 and reduced postprandial glucose by approximately 16% compared with glucose. Amerikanou et al. [23] showed that Imera-cultivar carob powder significantly lowered both glucose and insulin at 30 minutes compared with sucrose in healthy males. However, because most carob products contain multiple potentially bioactive constituents, including soluble fibers, polyphenols, and D-pinitol, the relative contribution of each component to the observed glycemic effects remains unclear.
The central question addressed here was whether the specific composition of a carob-derived sweetener can separate sweetness from its usual blood-sugar penalty: that is, whether a product can still deliver the sugars responsible for taste while sharply limiting their impact on blood glucose, and what part D-pinitol plays in that effect. In the present study, we examined two carob-derived sugar materials and compared them to a commercial carob reference product in both in vitro and in vivo studies: i) carob molasses (CarobWay, Ltd.), an aqueous concentrated extract of carob pods retaining the native matrix of sugars, soluble low molecular weight fibers, polyphenols, and D-pinitol, was evaluated in vitro using SHIME® platform [24] to characterize sugar digestibility and D-pinitol bioaccessibility; ii) white carob sugar, a proprietary carob-derived sugar material developed by CarobWay, containing D-pinitol but essentially depleted of fibers and polyphenols, was evaluated in vivo using C57BL/6 mice [25] to determine its glycemic index ; and (iii) a commercial carob powder retaining a complex matrix of sugars, fibers, polyphenols, and D-pinitol was included in the in vivo study as a fiber- and polyphenolrich comparator conceptually related to the native carob matrix. Together, these complementary approaches provide an integrated assessment of carob-derived sugar materials linking sugar digestibility, D-pinitol bioaccessibility, matrix composition, and in vivo glycemic outcomes.
Materials and Methods
In Vitro Upper Gastrointestinal Digestion by SHIME®
The in vitro digestion was conducted at ProDigest BV, Belgium (Study 2015621/D2304) using an adapted Simulator of the Human Intestinal Microbial Ecosystem (SHIME®) technology platform, as described in [24]. Carob molasses, manufactured by CarobWay Ltd. (Israel), was examined at a dose of 14 g per reactor under simulated fed conditions in single replicate, in line with the standard SHIME® upper gastrointestinal tract (GIT) screening configuration.
The protocol was conducted under fed conditions following a standardized procedure based on the INFOGEST consensus method [26]. The simulation comprised an oral phase (2 min, pH 6.5, with salivary amylase), a gastric phase (2 h, sigmoidal pH decreases from 5.5 to 2.0, with pepsin at 4000 U/mL), and a smallintestinal phase comprising duodenal (pH 6.5), jejunal (pH rising to 7.5), and ileal (pH 7.5) stages. Following enzymatic digestion, a 24-hour dialysis step through a cellulose membrane (0.5–1.0 kDa cut-off) at 4°C simulated passive small intestinal absorption, partitioning the contents into bioaccessible (luminal) and putative bioavailable (dialysate) fractions.
Absolute quantification of glucose, fructose, sucrose, and D-pinitol was performed by high-performance anion-exchange chromatography with pulsed amperometric detection (HPAECPAD). All samples were centrifuged and filtered prior to analysis, and blank-control values were subtracted from test-product values. Carob molasses was additionally characterized for soluble fiber and polyphenol content to contextualize the nutritional matrix (Table 1). Soluble fibers were quantified by HPAEC-PAD; polyphenols were determined by the Folin-Ciocalteu method and expressed as gallic acid equivalents (GAE).
|
Component |
Content |
|
Sucrose (mg/g) |
384.42 |
|
Glucose (mg/g) |
51.00 |
|
Fructose (mg/g) |
61.57 |
|
D-Pinitol (mg/g) |
49.40 |
|
Soluble fibers (g/g) |
0.043 |
|
Polyphenols (mg GAE/g) |
3.81 |
Table 1: Compositional profile of the carob molasses (CarobWay) used in the in vitro SHIME® study
In Vivo Glycemic Index Study
The glycemic index study was conducted at Pharmaseed Ltd., Israel (Study CAR-001-EF) following ethics approval (IL-2501- 110) and in accordance with the OECD Principles of Good Laboratory Practice [27]. Three test materials were compared: (i) white carob sugar (lot DCM241101), manufactured by CarobWay Ltd. (Israel); (ii) a commercially available carob powder (Tvuot Ltd., Israel; lot 300124), and (iii) glucose (G8270, Sigma-Aldrich) as the reference standard. The compositional profiles of the test materials are given in (Table 2).
|
Parameter |
White Carob Sugar |
Carob Powder |
|
Sucrose |
57.29 |
27.80 |
|
Glucose |
14.79 |
1.54 |
|
Fructose |
14.84 |
2.65 |
|
Total sugars |
86.92 |
36.00 |
|
D-Pinitol |
9.79 |
4.53 |
|
Dietary fibers |
0.10 |
41.00 |
Table 2: Compositional analysis of white carob sugar (CarobWay) and commercial carob powder (% w/w).
Twenty male C57BL/6 mice (9 weeks old, Envigo RMS) were randomized into two experimental groups plus a glucose-reference group (n = 10 per group; Table 3). All materials were dissolved in water to create a working solution administered by oral gavage at 20 mL/kg body weight. Each formulation was dosed to deliver 2 g of total sugar per kg body weight.
|
Group |
Treatment |
Dose* (g/kg bw) |
Volume (mL/kg) |
Route |
|
1M |
Glucose (reference) |
2.0 |
20 |
PO |
|
2M |
White carob sugar |
2.0 (2.3 g powder) |
20 |
PO |
|
3M |
Commercial carob powder |
2.0 (5.55 g powder) |
20 |
PO |
|
*Dose represents total sugar content. PO = per os (oral gavage). |
||||
Table 3: Group allocation for the in vivo glycemic index study.
Following a 6-hour fast, sugar solutions were administered by oral gavage. Blood glucose was measured using a glucometer at baseline (time 0) and at 15, 30, 45, 60, 90, and 120 minutes postadministration [25].
Data are presented as mean ± standard deviation (SD). Group comparisons were performed using unpaired Student’s t-tests (GraphPad Prism 5.02). A p-value ≤ 0.05 was considered statistically significant. The incremental area under the curve (iAUC) was calculated using the trapezoidal rule, with baseline subtraction and negative values set to zero per ISO 26642:2010 [6]. The glycemic index was computed as (total iAUC of test material / total iAUC of glucose) × 100.
Sensitivity analyses using alternative AUC conventions (net AUC with negative areas retained; partial iAUC at 0–60 and 0–120 min; Δmax and Tmax) and 10 000-iteration non-parametric bootstrap 95% CIs for GI were performed on the per-animal time-course data [28].
Results
In Vitro Upper Gastrointestinal Digestion (SHIME®)
Bioaccessibility of D-Pinitol from Carob Molasses
The release and intestinal availability of D-pinitol within the carob molasses matrix during simulated upper gastrointestinal transit was evaluated using the SHIME® platform (Materials and Methods). In this model, material recovered in the dialysate has crossed the simulated intestinal membrane and is treated as potentially absorbable, whereas material held back in the luminal retentate remains in the gut and is not readily available for absorption. A 14 g serving of carob molasses introduced into the SHIME® reactor contained 692 mg of D-pinitol, as measured by the analytical method described in Section Blood Glucose Response. By the end of the simulated upper gastrointestinal phase, the total D-pinitol content (sum of luminal retentate and dialysate) was 758 mg/reactor. After dialysis, D-pinitol was recovered in both the dialysate and luminal retentate fractions. The dialysate contained 313 mg D-pinitol/reactor, corresponding to 41.3% of the postdigestion recovered D-pinitol (putative bioavailable fraction). This dialyzable fraction is the portion of D-pinitol that crossed the simulated intestinal barrier and is therefore potentially available for absorption into the body; the remainder stayed within the gut lumen. The remaining 445 mg/reactor was retained in the luminal compartment, representing the non-dialyzable fraction of D-pinitol under the conditions of the assay.
Sugar Digestion and Bioaccessibility during Upper Gastrointestinal Simulation
This section reports the sugar measurements from the same SHIME® digestion experiment described above, now focusing on the sugars rather than on D-pinitol. Absolute sugar quantification by HPAEC-PAD identified sucrose as the principal sugar in carob molasses, with measured contents of 5382, 714, and 862 mg/ reactor for sucrose, glucose, and fructose, respectively, present in the 14 g molasses portion introduced into the reactor at the start of digestion (Figure 1). Galactose, maltose, and lactose were below the limit of detection in all samples. Following completion of the simulated oral, gastric, and small-intestinal phases, the total sucrose, glucose, and fructose contents (sum of luminal retentate and dialysate) decreased only modestly relative to the input values, indicating limited enzymatic breakdown of the disaccharide and limited consumption or further conversion of monosaccharides during upper-GIT transit.
At the end of digestion, only a limited proportion of each sugar was detected in the dialysate. Dialysate amounts of 1060 mg/reactor for sucrose, 159 mg/reactor for glucose, and 225 mg/reactor for fructose were measured, corresponding to 19.7%, 22.3%, and 26.1% of their respective initial amounts. The corresponding luminal retentate fractions contained 3244, 241, and 352 mg/ reactor, respectively (Figure 1). Because the dialysate represents an operational proxy for the potentially absorbable fraction, these findings indicate that sugars from carob molasses were only partially transferred into the dialyzable compartment under simulated upper gastrointestinal conditions.
This pattern suggests that the immediate availability of sugars from carob molasses may be attenuated compared with equivalent amounts of free sugars in solution [29]. Together with the documented presence of soluble low-molecular-weight fibers and polyphenols in carob molasses (Table 1), the results are consistent with matrix-dependent effects on sugar diffusion and luminal carbohydrate digestion [30–33]. This in vitro profile provided the rationale for subsequent evaluation of carob-derived sugar materials in the in vivo glycemic index study described in Section In Vivo Glycemic Index.
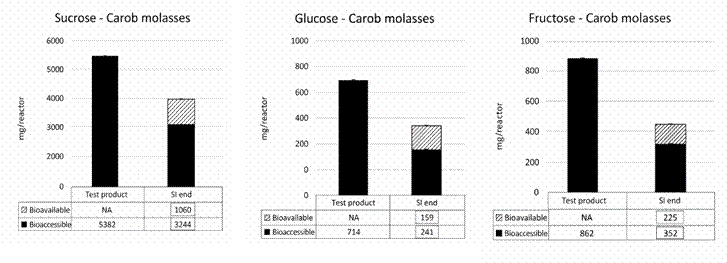
Figure 1: Sucrose, glucose, and fructose content of carob molasses during in vitro upper gastrointestinal digestion using the SHIME® platform (single replicate). For each sugar, the measured content of the test product (“Test product”, mg/reactor) is shown together with the partition between bioaccessible (luminal retentate) and bioavailable (dialysate) fractions at the end of small-intestinal simulation (“SI end”).
In Vivo Glycemic Index
The in vitro findings, namely, release of D-pinitol from the carob molasses into a dialyzable (putative bioavailable) fraction under the SHIME® and static-dialysis conditions applied, together with a clear indication that simple sugars within the molasses matrix are not rapidly transferred across a passive absorption barrier, provided the rationale for direct in vivo glycemic assessment. White carob sugar, the crystallized end-product derived from carob molasses, was tested alongside a commercial carob powder retaining its native matrix, with glucose included as reference.
Blood Glucose Response
To evaluate the in vivo glycemic effects of the tested carobderived materials, blood glucose responses were monitored in C57BL/6 mice following oral gavage of glucose, white carob sugar (CarobWay Ltd.), or commercial carob powder (Tvuot Ltd.). Before treatment administration, baseline body weights of the mice were assessed to verify comparability among the experimental groups. Mean body weights were similar across groups, with values of 21.75 ± 0.77 g in the glucose group (1M), 21.65 ± 0.94 g in the white carob sugar group (2M), and 21.44 ± 0.92 g in the commercial carob powder group (3M); all pairwise comparisons were non-significant (p > 0.4). These findings indicate that differences in subsequent glycemic responses were unlikely to be attributable to baseline differences in body mass.
Blood glucose levels following oral gavage of glucose, white carob sugar, or commercial carob powder over the 120-minute observation period are shown in (Figure 2). Glucose elicited a rapid and pronounced hyperglycemic response, rising from a baseline of 177.6 ± 12.8 mg/dL to a peak of 338.2 ± 65.1 mg/dL at 15 min and declining progressively to 143.8 ± 23.0 mg/dL at 120 min. From 15 through 60 min, glucose-treated animals exhibited significantly higher blood glucose concentrations than both carobbased groups (p < 0.05).
White carob sugar produced a remarkably flat glycemic curve. Blood glucose values remained close to or below baseline throughout the 120-min observation period (range: 136.1–152.0 mg/dL), with no discernible postprandial peak. At 90 min, blood glucose in the white carob sugar group (140.2 ± 21.2 mg/dL) was significantly lower than in both the glucose group and the commercial-carob-powder group (p < 0.05) (Figure 2A).
Commercial carob powder showed an intermediate glycemic profile. Blood glucose rose modestly from baseline (146.0 ± 17.8 mg/dL) to a peak of 175.5 ± 26.6 mg/dL at 15 min, declined toward baseline by 90 min, and then displayed a secondary increase at 120 min (175.8 ± 25.8 mg/dL). This 120-min value was significantly higher than both the glucose group (p = 0.009) and the white-carobsugar group (p < 0.05) (Figure 2B). The late rebound observed in the commercial carob powder group was absent in the white carob sugar group, suggesting more stable and sustained glycemic moderation by the latter.
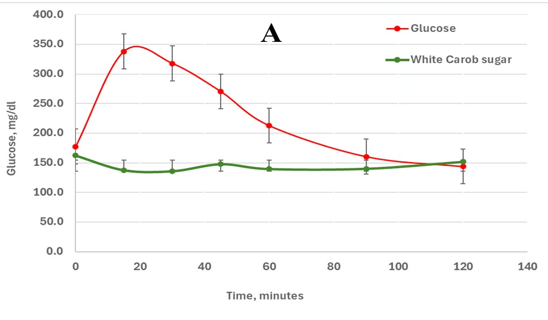
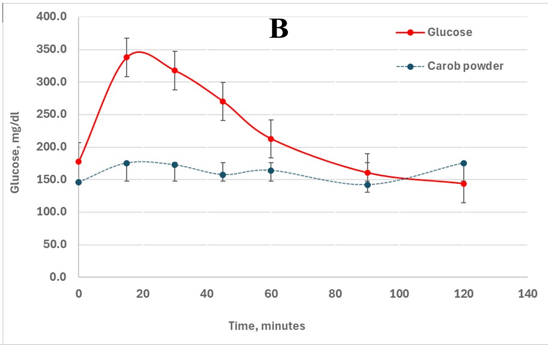
Figure 2: Blood glucose response after oral gavage of white carob sugar (A) or commercial carob powder (B) versus the glucose reference, in C57BL/6 mice (n = 10 per group). Values are mean ± standard error of the mean (SEM).
Incremental Area Under the Curve and Glycemic Index
Total incremental areas under the curve (iAUC) and glycemic index (GI) values are summarized in Table 4. Glucose produced an iAUC of 6624.8 ± 2925.7 mg·dL⁻¹·min. White carob sugar elicited a markedly lower response, with a total iAUC approximately 24fold lower than glucose (p < 0.05); notably, in 7 of 10 animals the iAUC was zero, indicating that blood glucose never rose above baseline during the entire observation period. Commercial carob powder produced a total iAUC approximately 3.3-fold lower than glucose (p < 0.05). The difference between white carob sugar and commercial carob powder was also statistically significant (p ≤ 0.05). The corresponding GI values were 4.18 ± 10.96 for white carob sugar and 30.35 ± 18.19 for commercial carob powder.
To assess the robustness of these GI values to the choice of AUC convention, pre-specified sensitivity analyses were performed on the per-animal time-course data (Table 5). Net AUC₀–₁₂₀, which retains negative excursions below baseline, was strongly negative for white carob sugar (2M; median −2850 mg·dL⁻¹·min) and positive for the commercial carob powder (3M) and the glucose reference (1M), confirming that the near-zero iAUC of 2M reflects a sustained sub-baseline glucose response rather than the truncation of negative areas. Partial iAUCs over 0–60 and 0–120 min preserved the same ranking (2M 3M 1M), and Δmax for 2M (15 ± 25 mg/dL) was an order of magnitude lower than for 1M (168 ± 69 mg/dL), with a later and more dispersed Tmax for the carob material. Non-parametric bootstrap resampling (10 000 iterations) yielded 95% confidence intervals of 0.0–12.1 for the GI of 2M and 18.4–46.0 for 3M; the nonoverlap of these intervals indicates that the very low GI classification of white carob sugar is preserved across all alternative metrics tested.
|
Group |
Total iAUC |
GI |
|
Glucose (reference) |
6624.8 ± 2925.7 |
100 ± 44.16 |
|
White carob sugar |
276.8 ± 726.1 |
4.18 ± 10.96 |
|
Commercial carob powder |
2010.8 ± 1205.0 |
30.35 ± 18.19 |
Table 4: Total iAUC (mg·dL⁻¹·min) and glycemic index for each group. Values are mean ± SD (n = 10).
|
Metric |
Glucose (1M) |
CarobWay Sugar (2M) |
Carob powder (3M) |
|
Net AUC0–120 (mg·dL−1·min), mean ± SD |
5681 ± 3193 |
−2324 ± 2111 |
1761 ± 1543 |
|
Net AUC0–120, median (IQR) |
5554 (3908–8297) |
−2850 (−3833 to −1416) |
2303 (951–2702) |
|
iAUC0–60 (mg·dL−1·min), mean ± SD |
6169 ± 2777 |
203 ± 500 |
1174 ± 697 |
|
iAUC0–60, median (IQR) |
5456 (4736–7224) |
0 (0–6) |
1313 (574–1599) |
|
iAUC0–120 (mg·dL−1·min), mean ± SD |
6625 ± 2926 |
277 ± 726 |
2011 ± 1205 |
|
iAUC0–120, median (IQR) |
6056 (5284–8353) |
0 (0–6) |
2355 (1026–2728) |
|
Δmax (mg/dL), mean ± SD |
168 ± 69 |
15 ± 25 |
44 ± 21 |
|
Tmax (min), median (IQR) |
15 (15–26) |
22.5 (0–45) |
30 (30–60) |
|
GI point estimate |
100 (reference) |
4.2 |
30.4 |
|
GI bootstrap 95% CI |
— |
0.0–12.1 |
18.4–46.0 |
|
Net AUC0–120 is the signed trapezoidal area of glucose minus baseline, with negative areas retained. Partial iAUC0–60 and iAUC0–120 follow the ISO 26642:2010 convention with negative segments truncated to zero. Δmax is the maximum rise above baseline; Tmax is the time of that peak. Glycemic index (GI) point estimates and 95% confidence intervals were obtained by non-parametric bootstrap (10,000 iterations, animals resampled with replacement within each group). Values are mean ± SD or median (interquartile range, IQR) as indicated. IQR, interquartile range; SD, standard deviation |
|||
Table 5: Sensitivity Analysis of Postprandial Glucose Metrics and GI Confidence Intervals
Discussion
This work provides the first integrated in vitro–in vivo characterization of the digestive fate and glycemic impact of carobderived sugars, with particular attention to the contribution of the endogenous cyclitol D-pinitol. The experimental design follows the manufacturing logic of the carob-derived sweetener: carob molasses, the matrix-rich aqueous intermediate, was studied in vitro to characterize sugar digestibility and D-pinitol bioaccessibility within the native carob matrix; the white carob sugar (CarobWay Ltd.) derived from this molasses by crystallization, a product in which fibers and polyphenols are reduced to trace amounts and D-pinitol is enriched approximately two-fold, was then tested in vivo. A commercial carob powder (Tvuot Ltd.), retaining the full native matrix of fibers, polyphenols, and D-pinitol, was used in vivo as a fiber- and polyphenol-rich comparator whose composition is conceptually analogous to that of carob molasses. Two principal findings emerge. First, D-pinitol is efficiently released from the carob molasses matrix during upper gastrointestinal digestion and shows high bioaccessibility. Second, a carob-derived sugar enriched in D-pinitol elicits a very low glycemic response in vivo. This result supports the hypothesis that D-pinitol may contribute substantially to the glycemic modulating effects of carob-derived products, as discussed further below. Taken together, these two observations move the explanation for carob’s low-GI behavior away from a purely in-the-gut effect of fiber and polyphenols and toward an absorbed bioactive, in essence, a sugar that carries its own insulin-sensitizing compound. The following sections develop this interpretation.
D-Pinitol Bioaccessibility and Physiological Relevance
The SHIME® data indicate that D-pinitol in carob molasses remains stable throughout simulated gastric and small-intestinal transit and is released from the carob matrix during digestion. Because the post-digestion total D-pinitol content (758 mg/ reactor) was only marginally higher than the pre-digestion value (692 mg/reactor), and because the experiment was performed in single replicate, this difference is most appropriately interpreted as near-complete recovery within analytical variability rather than as a true digestion-induced increase. The 313 mg/reactor recovered in the dialyzable fraction (41.3 % of the D-pinitol load) therefore reflects release of D-pinitol into a dialyzable form under the SHIME® and static-dialysis conditions applied and provides an estimate of the fraction potentially absorbable in vivo; it should not be equated with epithelial uptake, since transfer across a cellulose dialysis membrane (0.5–1.0 kDa cut-off) simulates passive diffusion across the intestinal barrier but does not reproduce active or carrier-mediated transport. In the terminology of in vitro digestion, this value corresponds to the bioaccessible fraction available for intestinal absorption rather than to systemic bioavailability; therefore, it is referred to here as the putatively bioavailable fraction [26].
The physiological relevance of this dialyzable fraction is supported by published human pharmacokinetic data. Navarro et al. [19] reported that, in healthy fasting volunteers, D-pinitol administered within a carbohydrate-rich carob syrup matrix showed lower dose normalized systemic exposure than pure D-pinitol, with peak exposure corresponding to approximately 40% of that observed for the isolated compound. The proportion of D-pinitol recovered in the dialysate in the present SHIME® experiment is therefore broadly consistent with the concept that the carob matrix attenuates D-pinitol availability relative to the pure compound, while still allowing a measurable fraction to remain available for absorption. This suggests that co-existing sugars, soluble fibers, and polyphenols may modulate D-pinitol release and absorption kinetics without completely preventing systemic exposure. This moderate, gradual release may itself be advantageous: rather than a sharp spike, it favours a smoother and more sustained delivery of D-pinitol, consistent with the prolonged plasma exposure reported after carob-derived intake and well suited to a compound that acts on glucose handling across the whole postprandial period.
Additional studies with carob-derived inositol-enriched beverages have further demonstrated improvements in postprandial glycemia and insulin sensitivity in healthy and prediabetic subjects, providing functional evidence that orally ingested D-pinitol reaches systemic targets [34]. On a nutritional basis, a 14 g serving of carob molasses delivers approximately 692 mg of D-pinitol, equivalent to roughly 9.9 mg/kg body weight in a 70 kg adult. This intake is of the same order of magnitude as acute oral doses shown to elicit improvements in glycemic control, including reductions in fasting glucose, HbA1c, and HOMA-IR in humans (0.6–1.2 g) [19,23] and falls within the dose range used in chronic human supplementation studies (~1.2 g/day) [17].
In the in vivo study, the estimated D-pinitol dose delivered by white carob sugar (0.23 g/kg body weight) is within the range used in published rodent studies that used D-pinitol [35]. Taken together, these data indicate that carob-derived products can deliver physiologically relevant quantities of D-pinitol and that its release into the small-intestinal compartment in a form potentially available for absorption provides a plausible mechanistic basis for the glycemic effects observed in the subsequent in vivo experiments.
Sugar Digestibility and Matrix Effects in Carob Molasses
The SHIME® sugar quantification indicated that the bulk of sucrose, glucose, and fructose remained in the luminal retentate at the end of upper-GIT simulation, with only modest dialysate values measured for each sugar. Because the dialysate represents an operational proxy for the potentially absorbable fraction, these findings indicate that sugars from carob molasses were only partially transferred into the dialyzable compartment under simulated upper gastrointestinal conditions.
This pattern suggests that the immediate availability of sugars from carob molasses may be attenuated compared with equivalent amounts of free sugars in solution [29]. The molasses matrix combines soluble low molecular weight fibers (Table 1) that increase luminal viscosity and slow diffusion [30,31], with polyphenolic compounds known to inhibit α-amylase and α-glucosidase activities and to interact with sugars and other matrix components during digestion [31,33]. These mechanisms are well established as drivers of attenuated sugar absorption and reduced postprandial glycemia in fiber- and polyphenol-rich food matrices [30–33]. A contribution from D-pinitol to luminal sugar handling, via its documented effects on cellular glucose uptake through the PI3K/Akt pathway [13–16], cannot be excluded but is primarily evidenced in vivo. By way of context, the PI3K/Akt cascade is the principal route through which insulin lowers blood glucose: when activated, it moves GLUT4 glucose transporters to the cell surface so that muscle and fat take up glucose from the circulation. A compound able to engage this pathway can therefore promote glucose clearance as much as insulin does, which is why D-pinitol’s reported activation of PI3K/Akt is relevant to carob’s glycemic effects.
These findings predict the absence of rapid, large-magnitude postprandial glucose excursions following consumption of carob molasses, in alignment with the low GI consistently reported for carob products [20–22]. They also provided the scientific rationale for progressing to the in vivo glycemic index study addressed in the following section.
The Role of D-Pinitol in Glycemic Attenuation
The two carob-derived products tested in vivo constitute a natural experiment that allows the individual contributions of matrix components to be distinguished. Commercial carob powder (Tvuot Ltd.) retains the full native matrix, soluble fibers, polyphenols, and D-pinitol, whereas white carob sugar (CarobWay, Ltd.), obtained by crystallization from carob molasses, retains D-pinitol while losing essentially all fiber and polyphenol content, yielding a final product with 86.9% total sugars, 9.8% D-pinitol, and only trace amounts of fibers and polyphenols. Because the commercial carob powder retains a complex carob matrix conceptually similar to that of carob molasses, the contrast between the two in vivo test materials approximates a comparison between matrix-rich and matrix-depleted carob preparations.
If fibers and polyphenols were the primary mediators of carob’s lowGI effect, the commercial carob powder (41% dietary fiber, 4.53% D-pinitol) would be expected to outperform white carob sugar (0.1% fiber, 9.79% D-pinitol). The opposite was observed: white carob sugar produced a GI of 4.2 versus 30.4 for carob powder, a ~7-fold difference, despite the markedly lower fiber content of the white sugar (recall that a lower GI is the more desirable outcome: both products fall within the low-GI band of ≤ 55, but white carob sugar lies near the very bottom of the scale, whereas the powder, at 30.4, is higher and closer to the medium range). The D-pinitol to sugar ratios of the two products are similar (approximately 1:8.9 for white carob sugar and 1:7.9 for carob powder), but the absolute D-pinitol concentration per gram of product, and the form in which sugars are delivered (crystallized vs. embedded in a fiber matrix) differ substantially. Importantly, because the dosing scheme (Table 3) was normalized to total sugar load rather than to absolute D-pinitol, the two arms in fact delivered comparable absolute D-pinitol amounts: the 5.55 g of commercial carob powder required to provide 2 g sugar/kg body weight delivered ~251 mg/ kg bw of D-pinitol, while the 2.3 g of white carob sugar delivered approximately 225 mg/kg bw. The 7-fold difference in GI cannot therefore be explained by absolute D-pinitol exposure alone, and most likely reflects differences in D-pinitol bioavailability from the two matrices and/or other compositional features of the products (e.g., the physical state of the crystallized versus fiber-embedded product, particulate sugar release kinetics). This interpretation is consistent with published evidence that a dense carbohydrate/fiber matrix attenuates D-pinitol absorption relative to a less restrictive matrix [19] and with reports indicating that D-pinitol’s glycemic efficacy depends on dose and matrix-driven exposure thresholds rather than on absolute amount alone [14,18,19].
The low GI of white carob sugar (4.18 ± 10.96) cannot be reconciled with its sugar profile alone. Although sucrose dominates (57.29% w/w) and its hydrolysis yields glucose and fructose, the latter with a lower GI than glucose [9,10], this composition would not predict a GI as low as 4.2. Two explanations are possible. One is local, within the gut: that sugar uptake is physically slowed, or that the enzymes metabolizing sucrose into glucose and fructose are inhibited, effects well documented for the fiber and polyphenols of whole carob, but unlikely here because white carob sugar is largely stripped of both. The other, more plausible for this product, is systemic: once absorbed, D-pinitol behaves in an insulin-like way, prompting muscle cells to recruit GLUT4 glucose transporters and clear glucose from the blood, so that sugar entering the circulation is disposed of almost as quickly as it arrives. The substantial endogenous D-pinitol content (9.79% w/w) therefore represents a plausible contributor. Prior studies using purified D-pinitol or carob-derived inositol preparations have reported engagement of post-receptor insulin-signaling pathways, including PI3K/Akt activation, GLUT4 translocation, and GSK-3β inhibition [13–16,33], any of which could theoretically enhance glycemic control. Because the present in vivo study did not measure postprandial insulin, C-peptide, or incretin hormones, the nearly flat glycemic curve elicited by white carob sugar (Figure 2A) remains compatible with several non-exclusive mechanisms, enhanced insulin-stimulated peripheral glucose disposal, insulin-independent disposal, incretin modulation, or combinations thereof. The mechanistic references to PI3K/Akt activation, GLUT4 translocation, and GSK-3β inhibition should therefore be interpreted strictly as hypothesis-generating, grounded in prior literature rather than as evidence of pathway engagement in this mouse model.
Critically, D-pinitol’s mechanism does not require its presence in the intestinal lumen during sugar absorption. Its documented effects on HOMA-IR, hepatic glycogen synthesis, and peripheral glucose uptake [20,33] indicate that, once absorbed, it promotes glucose disposal systemically. Co-delivery of D-pinitol with sugars within a single food matrix thus represents a naturally occurring functional food paradigm in which a bioactive glycemic modulator accompanies the carbohydrate load.
The SHIME® data are consistent with release of D-pinitol into a dialyzable fraction during upper gastrointestinal transit (~41% putative bioavailable fraction), and published pharmacokinetic studies demonstrate sustained plasma exposure after oral intake of D-pinitol from carob-derived sources [18,19]. Taken together, these observations support a model in which D-pinitol, codelivered with sugars, modulates postprandial glucose handling through insulin-sensitizing and insulin-mimetic mechanisms [13–16], independent of, and in addition to, fiber- or polyphenolmediated effects on intraluminal absorption kinetics.
The GI of 30.35 ± 18.19 obtained for commercial carob powder is consistent with published values for carob flour and carobbased snacks [19,20] and aligns conceptually with what would be expected for a matrix-rich carob preparation similar in composition to carob molasses, supporting the internal validity of the murine model used here. The near-complete absence of a postprandial glucose excursion observed for white carob sugar indicates that its bioactive composition is associated with strong attenuation of the glycemic impact of the co-delivered sugars under the conditions of this study.
Study Limitations and Future Directions
The in vitro SHIME® study was conducted in single replicate, which limits statistical inference; moreover, the static dialysis configuration simulates passive diffusion only, so the dialyzable D-pinitol fraction reported here represents bioaccessibility rather than systemic bioavailability. The in vivo GI study employed a murine model, and translation to human GI values requires clinical trials conducted according to ISO 26642 [6], with allometric scaling applied to dose comparisons. Future work should prioritize human glycemic-index trials of white carob sugar, and longer-term metabolic assessments of HbA1c and insulin sensitivity.
Conclusions
This study presents the first integrated laboratory and animal characterization of a carob-derived sugar whose naturally copresent D-pinitol is associated with a markedly reduced glycemic impact. In a simulated digestion model, D-pinitol was readily released and made available for absorption, while the sugars within the carob matrix were taken up only slowly. In mice, white carob sugar (CarobWay Ltd.) produced a glycemic index of just 4.2, more than seven-fold lower than a commercial carob powder, and far below the value of 100 for glucose. Notably, this near-flat glycemic response held even though white carob sugar is largely free of the fiber and polyphenols usually credited with carob’s benefits, pointing to D-pinitol as a key contributor, most plausibly through how readily it is absorbed from the product rather than through the absolute amount delivered.
In an era when the prevalence of metabolic disease demands innovative dietary solutions, the co-delivery of sugars and D-pinitol within the carob matrix offers a natural, clean-label approach to reducing the glycemic impact of sugar consumption. Confirmation in human clinical trials will be essential to establish the translational relevance of these observations and to determine whether the very low GI observed in mice is maintained in human subjects.
Author Contributions
MC: Conceptualization, data analysis, writing - original draft. TA: Sample preparation, analytical methods review, data curation. YD, LOB, SR: Project supervision, resources, review manuscript. All authors have read and agreed to the published version of the manuscript.
Ethical Guidelines
The in vivo study was conducted at Pharmaseed Ltd. under ethics approval IL-2501-110, in accordance with the OECD Principles of Good Laboratory Practice.
Funding
This research was funded by CarobWay Ltd.
Conflict of Interest
The authors are employees of CarobWay Ltd. which developed and supplied the test material. All experimental procedures, study design, analyses, and reporting of results were conducted by independent contract research organizations to ensure objectivity:
ProDigest BV and Pharmaseed Ltd.
Data Availability
Data generated during this study are available from the corresponding author on reasonable request.
References
- International Diabetes Federation (2024) IDF Diabetes Atlas, 11th ed. IDF, Brussels.
- Zhou B, Lu Y, Hajifathalian K, Bentham J, Di Cesare M, et al. (2016) Worldwide trends in diabetes since 1980: a pooled analysis of 751 population-based studies with 4.4 million participants. Lancet 387: 1513-1530.
- Saklayen MG (2018) The global epidemic of the metabolic syndrome. Curr Hypertens Rep 20: 12.
- Augustin LS, Kendall CW, Jenkins DJ, Willett WC, Astrup A, et al. (2015) Glycemic index, glycemic load and glycemic response: an International Scientific Consensus Summit from the International Carbohydrate Quality Consortium (ICQC). Nutr Metab Cardiovasc Dis 25: 795-815.
- Blaak EE, Antoine JM, Benton D, Björck I, Bozzetto L, et al. (2012) Impact of postprandial glycaemia on health and prevention of disease. Obes Rev 13: 923-984.
- ISO 26642:2010 (2010) Food Products - Determination of theGlycaemic Index (GI) and Recommendation for Food Classification.
- Asioli D, Aschemann-Witzel J, Caputo V, Vecchio R, Annunziata A, et al. (2017) Making sense of the “clean label” trends: A review of consumer food choice behavior and discussion of industry implications. Food Res Int 99: 58-71.
- Livesey G (2003) Health potential of polyols as sugar replacers, with emphasis on low glycaemic properties. Nutr Res Rev 16: 163-191.
- Atkinson FS, Foster-Powell K, Brand-Miller JC (2008) International tables of glycemic index and glycemic load values: 2008. Diabetes Care 31: 2281-2283.
- Foster-Powell K, Holt SH, Brand-Miller JC (2002) International table of glycemic index and glycemic load values: 2002. Am J Clin Nutr 76:5-56.
- Gioxari A, Amerikanou C, Nestoridi I, Gourgari E, Pratsinis H, et al. (2022) Carob: A sustainable opportunity for metabolic health. Foods 11: 2154.
- Azab A (2022) D-Pinitol—Active natural product from carob with notable insulin regulation. Nutrients 14: 1453.
- Gao Y, Zhang M, Wu T, Xu M, Cai H, et al. (2015) Effects of D-pinitol on insulin resistance through the PI3K/Akt signaling pathway in type 2diabetes mellitus rats. J Agric Food Chem 63: 6019-6026.
- Bates SH, Jones RB, Bailey CJ (2000) Insulin-like effect of pinitol. Br JPharmacol 130: 1944-1948.
- Sanchez-Hidalgo M, Leon-Gonzalez AJ, Gálvez-Peralta M, GonzalezMauraza NH, Martin-Cordero C (2021) D-Pinitol: A cyclitol with versatile biological and pharmacological activities. Phytochem Rev 20: 211-224.
- Yap A, Nishiumi S, Yoshida KI, Ashida H (2007) Rat L6 myotubes as an in vitro model system to study GLUT4-dependent glucose uptake stimulated by inositol derivatives. Cytotechnology 55: 103-108.
- Srivastava K, Tiwari M, Dubey A, Dubey A (2020) D-Pinitol-A Natural Phytomolecule and its Pharmacological effect. Int J Pharm Life Sci 11: 5.
- Kim HJ, Park KS, Lee SK, Min KW, Han KA, et al. (2012) Effects ofpinitol on glycemic control, insulin resistance and adipocytokine levels in patients with type 2 diabetes mellitus. Ann Nutr Metab 60: 1-5.
- Navarro JA, Díaz C, Decara J, Medina-Vera D, Lopez-Gambero AJ,et al. (2022) Pharmacokinetics and endocrine effects of an oral dose of D-Pinitol in human fasting healthy volunteers. Nutrients 14: 4094.
- Dos Santos LM, Tulio LT, Campos LF, Dorneles MR, Krüger CC (2015) Glycemic response to carob (Ceratonia siliqua L) in healthy subjects and with the in vitro hydrolysis index. Nutr Hosp 31: 482-487.
- Papakonstantinou E, Orfanakos N, Farajian P, Kapetanakou AE, Makariti IP, et al. (2017) Short-term effects of a low glycemic index carob-containing snack on energy intake, satiety, and glycemic response in normal-weight, healthy adults: Results from two randomized trials. Nutrition 42: 12-19.
- Planes-Muñoz D, Rosell MD, Frontela-Saseta C, López-Nicolás R (2025) Evaluation of Commercial Carob Syrups (Ceratonia siliqua L.) in Randomized Controlled Trials: Effects on Lipid, Glycaemic, and Anthropometric Parameters. Foods 14: 3676.
- Amerikanou C, Kleftaki SA, Koutoulogenis K, Tsiaka T, Sigala D, et al. (2025) Imera cultivar carob: clinical glycemic effects and phytochemical profile. Food Chem 496: 146823.
- Van de Wiele T, Van den Abbeele P, Ossieur W, Possemiers S,Marzorati M (2015) The simulator of the human intestinal microbial ecosystem (SHIME®). The Impact of Food Bioactives on Health: in vitro and ex vivo models. 305-317.
- Campbell GJ, Belobrajdic DP, Bell-Anderson KS (2018) Determining the glycaemic index of standard and high-sugar rodent diets in C57BL/6 mice. Nutrients 10: 856.
- Mackie A, Rigby N, Verhoeckx K, Cotter P, López-Expósito I (2015) InfoGest Consensus Method. In: The Impact of Food Bioactives on Health: In Vitro and Ex Vivo Models. Springer, Cham, Switzerland, 1322.
- OECD (1998) OECD Principles of Good Laboratory Practice (GLP). OECD Series on Principles of Good Laboratory Practice and Compliance Monitoring. OECD, Paris.
- Brouns F, Bjorck I, Frayn KN, Gibbs AL, Lang V, et al. (2005) Glycaemic index methodology. Nutr Res Rev 18: 145-171.
- Kellett GL, Brot-Laroche E (2005) Apical GLUT2: a major pathway ofintestinal sugar absorption. Diabetes 54: 3056-3062.
- Dikeman CL, Fahey Jr GC (2006) Viscosity as related to dietary fiber: a review. Crit Rev Food Sci Nutr 46: 649-663.
- Brennan CS (2005) Dietary fibre, glycaemic response, and diabetes. Mol Nutr Food Res 49: 560-570.
- Macho-González A, Garcimartín A, López-Oliva ME, Bertocco G,Naes F, et al. (2017) Fiber purified extracts of carob fruit decrease carbohydrate absorption. Food Funct 8: 2258-2265.
- Chait YA, Gunenc A, Bendali F, Hosseinian F (2020) Simulated gastrointestinal digestion and in vitro colonic fermentation of carob polyphenols: Bioaccessibility and bioactivity. LWT 117: 108623.
- Bañuls C, Rovira-Llopis S, López-Doménech S, Veses S, Víctor VM,et al. (2016) Effect of consumption of a carob pod inositol-enriched beverage on insulin sensitivity and inflammation in middle-aged prediabetic subjects. Food Funct 7: 4379-4387.
- Navarro JA, Decara J, Medina-Vera D, Tovar R, Suarez J, et al. (2020) D-Pinitol from Ceratonia siliqua is an orally active natural inositol that reduces pancreas insulin secretion and increases circulating ghrelin levels in Wistar rats. Nutrients 12: 2030.