Why FDG PET Quantification Utilizing the Conventional Standard Uptake Value SUV Metric Calculation Does NOT Work
by Richard R. Black1*, James O. Rike2, William Robinson1, Micheal Culley3, Andrew Prideaux4, Gary Onik5, Rebecca Lambert6, David Howell7
1Accuquan P.O. Box 89, Chagrin Falls, OH 44022, USA.
2Seapoint Software, 163 Pepperrell Road, Kittery Point, ME 03905 USA.
3419368 Cruise Drive, Venice, Florida, 34292, USA.
4Medical Science Liaison Hermes Medical, 3462 E Wilson St, Farmville, NC 27828, USA.
5Adjunct Professor of Mechanical Engineering, Carnegie Mellon University, 401 East Las Olas Blvd, Suite 130-407, Fort Lauderdale, FL, 33301, USA.
6245 First Street Riverview II Cambridge, MA 02142, USA.
7Department of Radiation Oncology, Ohio Health Cancer Center, 75 Hospital Drive, Athens, OH 45701, USA.
*Corresponding author: Black RR, Accuquan P.O. Box 89, Chagrin Falls, OH 44022, USA.
Received Date: 22 January, 2026
Accepted Date: 29 January, 2026
Published Date: 02 February, 2026
Citation: Black RR, Rike JO, Robinson W, Culley M, Prideaux A, et al. (2026) Why FDG PET Quantification Utilizing the Conventional Standard Uptake Value SUV Metric Calculation Does NOT Work. J Oncol Res Ther 11: 10328. https://doi.org/10.29011/2574-710X.10328
Abstract
Unique to nuclear medicine procedures and in this instance specifically, 18 fluorodeoxyglucose positron emission tomography (18 FDG PET CT) scanning features the quantification of the emissions of radiation from the source of the scan. In addition to visual evaluation of the FDG PET study is the quantification analysis of the PET scan data. Our group did a simple analysis of patients studied at both baseline with FDG PET imaging and at second timepoint during treatment intervention which consisted of cytotoxic therapy without adjuvant radiation therapy or immunotherapeutic techniques. A total of 110 patients were studied sequentially on three different manufacturer PET-CT devices at the respective imaging centers. There were 50 patients studied on a General Electric Discovery 610, 30 patients evaluated utilizing a Philips Gemini GXL, and 30 patients receiving their base and first timepoint examinations on a Siemens Biograph 16. Each individual patient scan was assessed for the numeration of the liver SUV reference value in normal hepatic parenchyma in both the baseline and initial timepoint FDG PET examination. Based on recommended guidelines regarding successive FDG PET imaging, the results were categorized according to the following criteria. Those individuals who demonstrated a difference in the liver normal reference of 3 or less SUV units were compared to the number of patients that demonstrated a greater than 3 SUV units’ difference in the reference calculation. 27 of the 50 patients studied with the GE Discovery DS 610 with revealed a difference of greater than 3 units, 15 of 30 patients scanned with the Philips Gemini GXL and 20 of 30 subjects examined on the Siemens Biograph PET-CT also manifest a greater than 3-unit difference in the normal liver reference value. Those patients with a greater 3-unit difference in the normal liver reference generated SUVs were by definition excluded from comparative quantitation in designated abnormal regions of glucose metabolism. In summary the results of this inquiry into frequency of individual patient biodynamic behavior when studied at the same facility on the identical vendor hardware produced a situation where comparative SUVs were not possible based on the liver reference value alone in at least 50% of the encounters. This affirms that the biological function of the individual patient is not a static phenomenon and that in order to perform chronological analysis of the patient’s abnormal glucose consumption regarding a scan abnormality in any clinical scenario, the generated SUVs must be standardized in order to obtain accurate results.
Keywords: 18 Fluorodeoxyglucose Positron Emission Tomography; FDG PET; 18 FDG PET CT; Malignancy; Treatment; Therapy; Standard Uptake Value; SUV; SUV opt; Standardization; Standardized; Corrected; RECIST; Response Criteria in Solid Tumors; PERCIST; PET Response Criteria in Solid Tumors; Conventional Imaging Procedures; Computed Tomography; Magnetic Resonance Imaging, Ultrasound; Plain Film Radiography;
Introduction
The potential ability to quantify regional glucose metabolism and how relates to appraisal of malignant, inflammatory and neurologic disease is the key discriminator when compared to anatomic assessment of pathologic processes. Conventional anatomic based imaging procedures to include computed tomography, magnetic resonance imaging, plain film radiography and ultrasound analyze the structural characteristics of abnormalities to include localization of morphological findings and measured size evaluations. Changes at the cellular biochemical level will precede anatomic change which has paved the way for FDG PET imaging to rather than establish a niche in the assessment of patients with known or suspected disease [1, 2], the FDG PET SUV metric should dominate in this role when consideration is given to biochemical changes as opposed to structural ones.
Although the objectivity gained through quantitative analysis of molecular expression of active malignant disease has been understood and validated through the expression of the SUV [3], the hesitation in the definitive acceptance of the FDG PET modality in the follow up of patients with time point examinations has been lacking [4-5]. In spite of the relative ease of SUV assignment in FDG PET interpretations when compared to more complicated and patient unfriendly FDG PET analyses to include spectral analysis, compartmental modeling and graphical methodologies, the majority of referring clinicians prefer the results of the anatomic imaging to include most favorably computed tomography with size assessments as opposed to the FDG PET quantification of count statistics, the SUV [3, 6].
Prior to the implementation of the metabolic data set (FDG PET) to supplant and not merely assist the anatomical findings in patients with malignancy, the FDG PET quantitative metric must be standardized. This has been accomplished with the introduction of the optimized standard uptake value [7, 8]. Only with standardization of the FDG SUV metric can precise appraisal of the status of disease from a biological perspective be achieved. Although techniques have been developed particularly with application of harmonization through the use of a specific phantom to allow for the use of differing image acquisition devices [9], the harmonization process does nothing to standardize the FDG SUV metric and therefore adds no solution to being able to sequentially measure the SUV metric on the same or differing acquisition devices and obtain the desired result in truly and accurately evaluating the metabolic state of disease. With this reported demonstration of the patient’s source of emitted radiation being variable and completely independent of any other applied or considered modification, it is essential that the patient’s expression of their biodynamic glucose metabolism be determined and accounted for with follow up FDG PET-CT. The SUV metric has suffered from a variety of limitations to include the fact that heterogeneity of values limits their application, the referral base has no consistent understanding of the stated values and the interpreting physicians are not knowledgeable in the parameters of abnormal quantitative FDG uptake [6]. Thus, the non-standardized SUV serves only as a helpful clue in FDG PET scan interpretation and cannot serves as a distinguishing point of tumor and non-tumor disease involvement [10]. However, the standardized SUVopt does accomplish the goal of differentiating malignant involvement [7, 8] and therefore stresses the need for standardization-correction of the SUV metric. This unequivocally can only be accomplished when consideration is given to the calculation of the SUVopt which is dependent on the behavior of the normal hepatic parenchymal reference SUV that in this report reveals that without standardization, the resultant SUV calculation is essentially ineffective.
Materials and Methods
In this analysis, a total of 110 patients were evaluated on three different vendor PET-CT imaging device platforms. The scanners were associated with three different imaging centers which serviced oncologic PET-CT requests to function in the appraisal of malignant disease, including the initial staging, restaging and assessment of provided treatment response. Each imaging location had a specific manufacturer PET-CT device. The imaging hardware included Siemens Biograph 16, a Philips Gemini GXL and a General Electric Discovery DS 600. Participants were studied at baseline and timepoint one after initiation of therapeutic interdiction in biopsy proven malignancy. Of the 110 subjects examined, 30 were completed on the Philips GXL PET-CT, 30 on the Siemens Biograph and 50 on the General Electric Discovery DS 600 at their respective imaging sites. For the purposes of this study, no patient underwent PET-CT scanning at other institutions, and all 110 individuals were adherent to the same institution and same scanner edict [10, 11] followed in the dispensing of FDG PET imaging services in the evaluation and management of malignant disease. The data accumulation took place from September 2023 and June 2024. 64 males and 46 females made up the study population.
The following data for each patient were recorded at the time of presentation for scan acquisition: age in years, weight in kg, patient gender, and the type of malignancy. Scan related data were also recorded and included the serum glucose at time of FDG, total injected FDG injection, the use of the standard uptake value in the generation of the normal liver parenchyma in both the baseline liver reference and first timepoint liver reference to gauge the expressed glucose metabolism in normal and non-diseased liver parenchymal used to exclusively calculate the optimized standard uptake value previously designated the SUVopt by our group [7].
FDG injection to initiation of image-bed position acquisition on the individual PET-CT scanner, SUV generation in normal liver parenchyma. All patients received pre-scanning instructions as part of the normal protocol and included avoiding strenuous exercise up to 24 hours prior to the scheduled injection time, preferred overnight fasting for patients with acquisitions scheduled for the morning or at least a 6 hour fast if examinations were scheduled for the afternoon and pre-injection hydration with non-flavored water. Preferably the intravenous injection of the FDG radiopharmaceutical via venous access was accomplished apart from indwelling port placement when accessible. To ensure relatively constant liver activity, scan acquisition began at approximately 55 to 100 minutes post glucose administration [12]. No patients received oral or intravenous contrast for the CT portion of the examination to avoid potential artifact [13]. The administered dose of FDG was calculated in each patient by the measurement of initial FDG activity in the syringe prior to introduction of the labeled glucose and then after injection. A low dose CT scan for the purposes of anatomic correlation and attenuation correction of the PET data set was obtained in all patients. CT dose reduction was performed on the individual scanners. Following the CT portion of the examination, the PET acquisitions were initiated immediately thereafter with all patients undergoing image acquisition from the skull base to the mid-thigh or head to toe whole body acquisitions depending upon the preference of the referring physician and pertinent historical information applicable to the individual patient.
Calibration procedures were followed for the PET scanner and a dose calibrator with the compliance to standard sequential check values performed weekly [14]. The corrected residual dose based on the decay factor of F18 was accomplished in all patients. Quality control procedures were followed with regard to the individual PET scanning device utilizing a 68 Ge source which was adherent to the specific manufacturer protocols. Vendor recommended processing was followed for each examination with general parameters including CT scans being processed utilizing filtered back-projection and PET emission data subjected to iterative reconstruction processing.
All FDG PET-CT studies were interpreted using a HERMES Nuclear Diagnostics workstation utilizing the Volume Display software. The calculated standard uptake values (Y) were obtained with the following methodology including the patient’s body weight (kg), concentration of glucose within the specified region of interest and the injected dose of FDG based on the following calculation method: d / t =R (c) - t with: R (c)-t representing radioactivity concentration in the region-volume of interest at time t, d = injected dose of the radiopharmaceutical and w = the patient’s body weight.
The reference normal liver parenchymal SUV was obtained by placing a circular region of interest in the hepatic parenchyma with three successive measurements in the coronal plane, with the mean of the three maximum SUV representations in the specific location of the hepatic parenchyma recorded. Any area of increased or decreased uptake within the liver (metastases or primary liver malignancy) were avoided. No patient had significant liver parenchymal abnormalities precluding the generation of the reference hepatic parenchymal quantitative reference value.
Statistical Methods
Of the 110 patients analyzed in this grouping, there were 220 normal liver reference values (one at the baseline and one at the timepoint one) calculated amongst the three different facilities utilized with specific hardware utilization as described previously for all of the participating patients. All 110 studied individuals had the normal hepatic reference value obtained through the use of the ACCUQUAN algorithm in the process of the SUVopt calculation [7].
The normal liver reference values were categorized according to the previously defined recommendation for the interpretation of sequentially obtained FDG PET scans using the differential of the liver reference of < 3 and > 3 SUV units on the two chronologically obtained scans [11]. This simple distinctive characteristic was utilized to produce the SUVopt [7].
Ethical Considerations
As part of the functional evaluation of the daily individual FDG PET CT evaluation, the data on each individual patient utilized for selective scan analysis was collected from provided information for the purposes of scan interpretation. Only a small percentage of the interpreted cases interpreted had pathological correlative records and follow-up available for evaluation and subsequent relation to scan interpretative results. All pertinent subject statistics and records were reviewed retrospectively with no consequent risk to the patient or alteration in patient management effected by the retrospective review. Informed consent for each subject included in the analysis was obtained by all facilities performing the FDG PET-CT examination. The intent of the provided information was provision of all associated information to the interpreting physician at the time of initial scan examination and report generation. Fully aware that the source materials are protected health information (PHI), data appraisal was conducted following de-identification according to the HIPAA Privacy Rule Standard defined in 45 CFR 164.514b. Hence an application for an exemption to IRB review was previously submitted to an independent institutional review board, Western Institutional Review Board with a waiver for HIPAA Authorization exemption status granted.
Results
Patient Characteristics
110 individual patients with biopsy proven malignancy were studied FDG PET CT scanning at three separate independent and non-affiliated facilities utilizing three different PET-CT imaging devices, exclusive to the imaging centers. The age range for the patient examinations was 31-80. The mean age of the partakers was 52.56 years. 64 males and 46 females were signatory participants in the study.
Generation of the Normal Liver-Hepatic Parenchymal Reference SUV
To obtain the normal liver reference value was of each individual FDG PET scan, a weighted meta-analysis of the all-inclusive peer reviewed literature was accomplished. The constant liver reference value obtained and used to calculate the SUVopt as described by Black and associates [7]. This constant liver reference value allows for the comparison of all SUVs regardless of the imaging center location, the vendor or degree of technological advancement of the imaging hardware. Of note, this differs significantly from the PERCIST quantification calculation which is relative to the patient’s liver calculation and not based on a constant reference value [11]. The range of the normal liver parenchymal SUV utilized to calculate the SUVopt in all presentations, including baseline and the timepoint one ranged from 1.4 to 7.5. The mean liver reference value was noted to be 2.42 + 0.69 for the three determined SUVopt measurements. The coefficient of variation for the liver parenchymal reference was noted to range from 0.081 – 0.024. No patient in this series had the presence of diffuse liver metastatic disease which would interfere with the liver reference value for the individual patient. The following table summarizes the baseline and time point one liver characteristics.
Of the total of 110 patient scans acquired both at baseline evaluation and Timepoint one, 27 of the 50 patients studied with the GE Discovery had > 3 point differential in the normal liver reference value, 15 of the 30 studied on the Philips Gemini platform 20 of the 30 subjects investigated on Siemens Biograph demonstrated this characteristic. See Figure one. The difference in the SUV sequential measurement of greater than 3 units in the comparison of the two examinations was 3 to 7 units for the GE device, 3-9 for the Siemens Biograph and 3-8 for the Philips Gemini scanner. The mean overall significant liver sequential SUV normal reference difference for all three scanners was 6.45 SUV units.
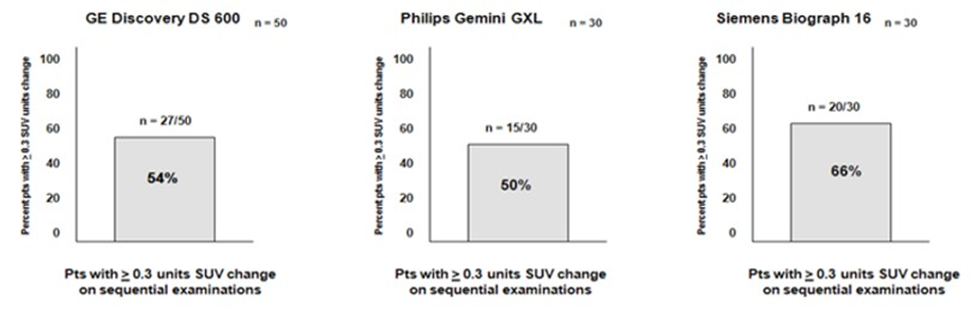
Figure 1: Performance characteristics of the individual PET-CT scanners.
The liver reference value was obtained through a weighted metaanalysis of the peer reviewed literature with a constant liver reference value obtained and used to calculate the SUVopt as described by Black and associates [7]. This constant liver reference value allows for the comparison of all SUVs regardless of the vendor or degree of technological advancement of the imaging hardware. This is significantly different from the PERCIST quantification calculation which is relative to the patient’s liver calculation and not based on a constant reference value [3]. The range of the normal liver parenchymal SUV utilized to calculate the SUVopt in all presentations, including baseline, timepoint one and follow up imaging ranged from 1.2 to 5.9. The mean liver reference value was noted to be 2.31 + 0.76 for the three determined SUVopt measurements. The coefficient of variation for the liver parenchymal reference was noted to range from 0.085 – 0.020. No patient in this series had the presence of diffuse liver metastatic disease which would interfere with the liver reference value for the individual patient.
Discussion
The entire intent of FDG PET-CT evaluation in this study, apart from the from the application of the examination in the correct staging, restaging of the individual patient with known malignancy as well as defining the status of the patient undergoing therapy was to demonstrate that the individual patient with malignant disease is a non-static source of glucose metabolism and therefore non-standardized evaluations of abnormal FDG PET scan findings may not be unreliable and produce wrongful results and subsequent untoward outcomes. The current manifestations of primarily subjective FDG PET reporting revolve around the lack of standardization of the semi-quantitative FDG metric, the SUV. This in the post PERCIST era which was supposed to rectify the problems FDG quantification [15-17], did nothing of the sort. In reality the proposed adjustments and dogma of the PERCIST doctrine did nothing to standardize the SUV metric. In fact, the literature continued to query for the standardization of the FDG SUV so examinations ordered for all applications could quantitatively standardized [18-19].
The results of this simple study of the SUV variance when performed on the same patient, at the same facility and on the identical PETCT imaging device, that the patient is not a static source of glucose labeled positron emission. Therefore, the individual patient should not be treated as such. It should be obvious from the results of this investigation defining the frequency of biological expression of localized glucose patient uptake that standardization of the FDG metric is crucial and key to providing quantitative data that is both accurate and precise. This can only be achieved if the reference value for standardizing the SUV is based on a constant and not a relative value. We have accomplished this functionality through the discovery of visceral constant that allows for standardization of all FDG SUVs regardless of the vendor scanner or degree of sophistication on the imaging hardware [7].
A great deal of historical work has gone into the attempts at standardization of glucose concentration by way of the radiopharmaceutical fluorodeoxyglucose that includes in depth understanding cellular handling and mechanisms of the actual glucose metabolism. There is relatively stable expression of tumor SUVs. Insignificant statistical differences in measurements in the FSDG SUV and the kinetics of the radiopharmaceutical have been shown. Reliable changes of at least 20% in the measured parameters (either the SUV or alternatively the Ki) have been achieved with reported reliability [20-24]. These and other numerous lauded and well-intentioned efforts have not and did not achieve the uncomplicated solution to FDG SUV standardization.
The emergence of radiomics, machine learning, deep learning and artificial intelligence have not solved the issue of standardization of the FDG SUV metric which is dependent on the liver reference constant. These fields of further elucidation of the FDG PET scan involve the analysis of radiomic features, molecular descriptors of the FDG PET scan that endeavor to improve diagnostic outcomes [25-29]. These diagnostic insights and developments, however, do not affect the standardization of the FDG SUV, that provides for uncomplicated objective interpretation of the FDG PET scan and allows for the accurate categorization of patients at staging, restaging of malignant disease and true understanding of the biochemical status of disease with therapeutic intervention [7, 8].
The fact that the biodynamic principles in the individual subject undergoing FDG PET-CT for any of the diagnostic reasons previously discussed is NOT a static fixed source of radiation is at the heart of the FDG SUV standardization enigma. As the industry continues to produce more technologically advanced hardware, comparisons of quantitative FDG uptake using the SUV metric for comparison will be further compromised. No comprehensible solution for comparative quantitative uptake will exist. The application of the principles of harmonization mat be applied to FDG PET scanning [9], this intervention requires the utilization of a specific phantom and does nothing to facilitate the delivery of a product that provides standardized FDG SUV results that are necessary to the provision of precise and accurate results that augment the sensitivity and specificity of the FDG PET-CT examination for application in the staging-restaging and appraisal of the impact of treatment. The question that seems answered by this exercise is that indeed objectivity of the FDG PET scan can and does provide correct quantification of the data integral to the examination, but only under the circumstances of the SUV standardization, where the fact that the individual patient is not an unchanging source of radiation, but rather a biodynamic entity.
Conclusion
The subject of each and every performed PET-CT study undertaken with labeled glucose must establish standardization of the FDG SUV metric, in order for the results of the examination to be consistent, accurate and comparable for the accomplishment of complete objectivity of the results. This is the true essence of precision medicine.
References
- Alavi A, Revich M (2002) Guest Editorial: The Conception of FDG-PET Imaging. Semin Nucl Med 32: 2-5.
- Hung-Pin C, Wen-Shan L, Wen-Shiung L, Chin H, Yu-Li C, et al. (2020) Comparison of FDG-PET/CT for Cancer Detection in Populations With Different Risks of Underlying Malignancy. In Vivo 34: 469-478.
- Tomasi G, Turkheimer F, Aboagye E (2012) Importance of quantification for the analysis of PET data in oncology: review of current methods and trends for the future. Mol Imaging Biol 14: 131-146.
- Patel K, Hadar N, Lee J, Siegel BA, Hillner BE, et al. (2013) The lack of evidence for PET or PET/CT surveillance of patients with treated lymphoma, colorectal cancer, and head and neck cancer: a systematic review. J Nucl Med 54: 1-10.
- Beyer T, Czermin J, Freudenberg LS (2011) Variations in clinical PET/ CT operations: Results of an international survey of active PET/CT users. J Nucl Med 52: 303-310.
- Boellaard R (2011) Need for standardization of 18F FDG PET/CT for treatment response assessments. J Nuc Med 52: 93S-100S.
- Black RR, Barentz J, Howell D, Bostwick D, Strum S (2023) Optimized 18F-FDG PET-CT method to improve accuracy of diagnosis of metastatic cancer. Diagnostics 13: 1580-1595.
- Black RR, Misseldine R, Prideaux A, Culley M, Onik G, et al. (2025) The use of the optimized standard uptake value-SUVopt- in the interpretation of FDG PET CT in Adrenal Gland and Pleural Based Malignancy. Medical Research Archives 13.
- Kelley M (2018) EQ-PET: Achieving NEMA-Referenced SUV Across Technologies. Eur J Nucl Med Mole Imag Res 8: 83.
- https://www.slideshare.net/slideshow/suv-standardised-uptakevalues-in-pet-scanning/12611220
- Wahl RL, Jacene H, Kasamon Y, Lodge MA (2009) From RECIST to PERCIST: evolving considerations for PET response criteria in solid tumors. J Nucl Med 50: 122S-150S.
- Laffon E, Adhoute X, de Clermont H, Marthon R (2011) Is liver SUV stable over time in 18FFDG PET imaging? Journal of Nuclear Medicine Technology 39: 258-263.
- Otsuka H, Graham NM, Kubo A, Nishitan H (2005) The effect of oral contrast on large bowel activity in FDG-PET/CT. Ann Nucl Med 19: 101-108.
- Delbeke D, Coleman RE, Guiberteau MJ, Brown ML, Royal HD, et al. (2006) Procedural guidelines for tumor imaging with 18FFDG PET/CT 1.0. J Nucl Med 47: 885.
- Graham MM, Badawi RD, Wahl RL (2011) Variations in PET/CT methodology for oncologic imaging at U.S. academic centers: an imaging response assessment team survey. J Nucl Med 52: 311-317.
- Patel K, Hadar N, Lee J, Siegel BA, Hillner BE, et al. (2013) The lack of evidence for PET or PET/CT surveillance of patients with treated lymphoma, colorectal cancer, and head and neck cancer: a systematic review. J Nucl Med 54: 1-10.
- Beyer T, Czermin J, Freudenberg LS (2011) Variations in clinical PET/ CT operations: Results of an international survey of active PET/CT users. J Nucl Med 52: 303-310.
- Tomasi G, Turkheimer Fm Aboagye E (2012) Importance of quantification for the analysis of PET data in oncology: review of current methods and trends for the future. Mol Imaging Biol 14: 131146.
- Boellaard R, O’Doherty MJ, Weber WA, Mottaghy FM, Lonsdale MN (2010) FDG PET and PET/CT: EANM procedural guidelines for tumor PET imaging: version 1.0. European Journal of Nuclear Medicine and Molecular Imaging 37: 662- 671.
- Weber Wolfgang (2007) Response Evaluation Using FDG-PET as a Biomarker: Solid Tumors. Society of Nuclear Medicine and Molecular Imaging Annual Meeting.
- Minn H, Zasadny KR, Quint LE, Wahl RL (1995) Lung Cancer: reproducibility of quantitative measurements for evaluating 2-[F-18]fluoro-2-deoxy-D-glucoseuptake at PET. Radiology 196: 167-173.
- Weber WA, Ziegler SI, Thodtmann R, Hanauske AR, Schwaiger M (1999) Reproducibility of metabolic measurements in malignant tumors using FDG PET. J Nucl Med 40:1771-1777.
- Nahmia C, Wahl LM (2008) Reproducibility of standardized uptake value measurements determined by 18F-FDG PET in malignant tumors. J Nucl Med 49: 1804-1808.
- Velasquez LM, Boellarrd R, Kolia G, Hayes W, Hoekstra OS, et al. (2009) Repeatability of 18F-FDG PET in a multicenter phase I study of patients with advanced gastrointestinal malignancies. J Nucl Med 50: 1646-1654.
- Gong J, Meng F, Liu C, Lu J, Yang Z, et al. (2025) Repeatability and prognostic value of radiomic features: a study in esophageal cancer and nasopharyngeal carcinoma. Insights into Imaging 16: 166.
- Fei L, Baiyang J, Ye F, Qingyang Y, Guangwen D, et al. (2025) Prognostic significance of FDG-PET/CT based radiomics analysis in newly diagnosed multiple myeloma: a comparative study with clinical assessment. Front Oncol 15: 1486495.
- Papp L, Rausch I, Grahovac M, Hacker M, Beyer T (2019) Optimized Feature Extraction for Radiomics Analysis of 18F-FDG PET Imaging 60: 864-872.
- Salimi M, Vadipour P, Khosravi A, Salimi B, Mabani M, et al. (2025) Diagnostic accuracy of 18F-FDG PET/CT radiomics for non-invasive prediction of PDL1 expression in non-small cell lung cancer: A systemic review and meta-analysis. Annals of Nucl Med.
- Anan N, Rafidah Z, Mahbubunnabi T (2022) A review on advances in 18F-fFDG PET/CT radiomics standardization and application in lung disease management. Insights Imaging 13:22.
© by the Authors & Gavin Publishers. This is an Open Access Journal Article Published Under Attribution-Share Alike CC BY-SA: Creative Commons Attribution-Share Alike 4.0 International License. Read More About Open Access Policy.