Urinary Stone Composition Analyses Using Fourier Transform Infrared (FTIR) Spectrometry
by Sevil Durdaği*, Hanan Jubayir
Department of Physics, Faculty of Arts and Science, Erzincan Binali Yıldırım University, Erzincan-TURKEY
*Corresponding author: Sevil Durdaği, Department of Physics,Department of Physics, Faculty of Arts and Science, Erzincan Binali Yıldırım University, Erzincan, Turkey
Received Date: 17 April 2024
Accepted Date: 08 August 2024
Published Date: 12 August 2024
Citation: Sevil Durdaği S, Jubayir H (2024) Urinary Stone Composition Analyses Using Fourier Transform Infrared (FTIR) Spectrometry. J Urol Ren Dis 09: 1380. https://doi.org/10.29011/2575-7903.001380.
Abstract
Infrared (IR) spectroscopy is a modern physical-chemical method suitable for the investigation of kidney stone composition. There may be various disorders or diseases underlying the formation of urinary stones. It is important to have information about urinary stone components in order to present stone-specific treatment, reveal the etiology of stone formation, prevent recurrence and provide individualized treatment. In the basic evaluation of stone disease, kidney stone analysis is recommended. Infrared spectroscopy is the most commonly used of these methods. Infrared spectroscopy allows us to find the qualitative composition of stones that have been surgically removed or spontaneously removed. Stone composition and structure can provide information about etiology due to the past conditions that led to the crystallization process.
Keywords: Etiology; Infrared Spectroscopy; Qualitative Composition; Urinary Stone
Introduction
Kidney stones are mineral stones found free in the renal calyces and pelvis or attached to the renal papilla. Stones that develop in the urinary tract form when the urine becomes oversaturated with respect to a mineral, leading to crystal formation, growth, aggregation and retention in the kidneys [1]. Generally, about 80% of kidney stones are composed of Calcium Oxalate (CaOx) mixed with Calcium Phosphate (CaP). Uric acid, struvite, and cystine are a few of the common stone types, accounting for approximately 9%, 10%, and 1% of kidney stones, respectively [2]. Urine can also become supersaturated with some relatively insoluble drugs or their metabolites, which can lead to crystallization in the renal collecting ducts [3]. Over the last decades, urolithiasis has been increasingly diagnosed, and nowadays, it affects roughly 5-13 % of the world population in industrialized countries [4]. Unhealthy changes in dietary habits, including high protein and salt intake, and the consumption of high-carbonated beverages rich in fructose are one of the reasons why the incidence and prevalence of calcium oxalate kidney stone disease, which is the most frequently diagnosed kidney stone type today has increased in the last decade [5-7]. Stone composition is affected by dietary habits, geography, socioeconomic conditions, infections, urinary tract anatomical deformity, and metabolic disorders [8]. Determining the composition of the stone is important in terms of making the treatment plan correctly, understanding the etiology and preventing recurrence.Among the analytical methods for the identification of stone components, chemical and physical methods can be used. However, despite their low cost, chemical methods are often insufficient to accurately analyze urinary stones. It is an unsuccessful method to identify rare purine stones resulting from genetic disorders, to quantify the respective amount of each element in mixed stones and to accurately distinguish between the various crystalline phases of calcium oxalate or calcium phosphate associated with very different biochemical and pathophysiological conditions [9-11]. Only physical methods can identify such a diversity of components. For this purpose, various techniques have been proposed in routine practice [12], including X-ray powder diffraction [13], infrared spectroscopy [14], Raman spectroscopy [15, 16], scanning electron microscopy [17] or thermal analysis [18] as well as stereomicroscopy for stone morphology [19, 20]. Today, infrared spectroscopy is widely used worldwide for the analysis of more than 300000 stones per year. A limitation for some centers to use this technology may be the cost associated with the equipment, infrared spectroscopy is less expensive and X-ray powder diffraction and scanning electron microscopy are the most expensive.IR is a rapid and specific method based on the interaction of infrared light with the vibratory spectroscopy techniques have received increasing attention in recent years as new affordable and rapid medical diagnostic tests are sought molecules in the stone components [21]. Kasidas et al., stated that IR can also identify non-crystalline materials, unlike XRD, therefore it is useful for the identification of organic stone components particularly purines and drug metabolites [22]. Also, when measuring with IR spectrometry, quantification of the relative amount of each component present is also possible without the use of any solvent [23]. FTIR spectroscopy gives accurate information about the composition of the stone for both main substances and trace elements in order to guide the treatment correctly. This study was conducted in order to understand the epidemiology correctly in order to understand the extent to which the modifiable etiological factors are responsible for stone formation and to take measures to prevent recurrence. This review highlights applications of IR spectroscopy with a focus on kidney stones.
Materials and Methods
Vibrational spectroscopy techniques have received increasing attention in recent years as new affordable and rapid medical diagnostic tests are sought. Imaging techniques such as SEM and XRD have proven to be extremely effective in diagnosing disease. However, such techniques may require user-dependent interpretation, require a series of tests to check their accuracy and most importantly they are costly and time-consuming methods. To overcome such problems, Infrared (IR) spectroscopy has been proposed as an alternative way to detect and diagnose a wide range of diseases. This type of technology produces a holistic biochemical "fingerprint" by providing simultaneous information about multiple biological molecules, so that samples taken from the patient can be examined to show even the progression of the disease. Every molecule has a unique fingerprint, which makes FTIR an invaluable tool for chemical identification. Fourier Transform Infrared Spectroscopy (FTIR) is a technique which is used to obtain infrared spectrum of absorption, emission, and photoconductivity of solid, liquid, and gas. FTIR identifies the presence of organic and inorganic compounds in the sample. FTIR is useful in identifying and characterizing unknown materials, detecting contaminants in a material, finding additives, and identifying decomposition and oxidation. Depending on the infrared absorption frequency range 400–4000 cm−1, the specific molecular groups prevailing in the sample will be determined through spectrum data in the automated software of spectroscopy. A schematic diagram of FTIR is depicted in (Figure 1). A typical FTIR spectrometer includes a source, sample cell, detector, amplifier, A/D convertor, and a computer. Radiation from the sources reach the detector after it passes through the interferometer. The signal is amplified and converted to a digital signal by the A/D convertor and amplifier, after which the signal is transferred to the computer where the Fourier transform is carried out. In FTIR, light of many frequencies can be measured simultaneously and this process can be repeated many times. This gives FTIR an advantage, i.e., it results in a higher signal-to-noise ratio for a specific scanning time. In this article, kidney stones were examined using FTIR spectrometry to demonstrate that low-cost and rapid analyzes can be performed in hospital settings. This study involving more than 50 participants is important to explore the potential of spectroscopy in a clinical context.
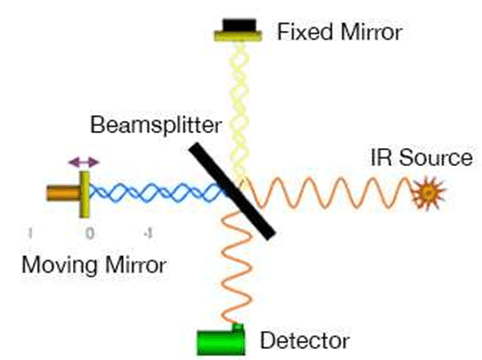
Figure 1: Experimental geometry for the FTIR spectrometer.
Ethics statement: The kidney stone samples were collected from the Urology Department of Erzincan Mengücek Gazi Training and Research Hospital through open surgery or percutaneous nephrolithotomy. The sample collection procedures were explained to all patients. Permission was received from the Clinical Research Ethical Review Committee (ERC) of Erzincan Binali Yıldırım University. The principles outlined in the Declaration of Helsinki of 1975 (with the regulations made in 2013) were followed throughout the study period. To preserve confidentiality, patient identities were erased and a new code was assigned to each stone.
Kidney stone samples: A careful sample preparation is a key issue in kidney stone analysis. Stones received in sterile containers were cleaned with deionized water and samples were transferred to dry bottles after air-drying on sterile gauze. In the laboratory, deionized water was used to re-rinse all samples. Samples were sonicated in a 15-minute water bath to remove debris and remaining blood clots. All the kidney stones collected were dried by oven at 60 ºC to one hour for remove moisture content and the dried stone samples were photographed (Figure 2). Large stones (>12 mm) were broken with a sterile saw to reach the core. Core and surface samples taken were analyzed separately with FTIR. The stones were then pulverized with a mortar and pestle to obtain a fine homogeneous powder. The pulverized stone was mixed with an inert powdered support (dried potassium bromide) in a proportion of 0.5 to 2% in agate mortar. This mixture was transferred into an appropriate die and pressed at 10 t/cm2 to form a transparent pellet 13 mm in diameter. To minimize the effect of the sample concentration in the KBr pellet and the inhomogeneous distribution of the sample particles on the linearity of the Beers’ calibration curve, three independent pellets were produced and measured. The average value was then calculated after the spectra were weighted appropriately and corrected for the baseline. The pellet assembled in a holder was placed in the IR beam of the spectrometer and spectrum of the pellet was collected immediately after preparation.
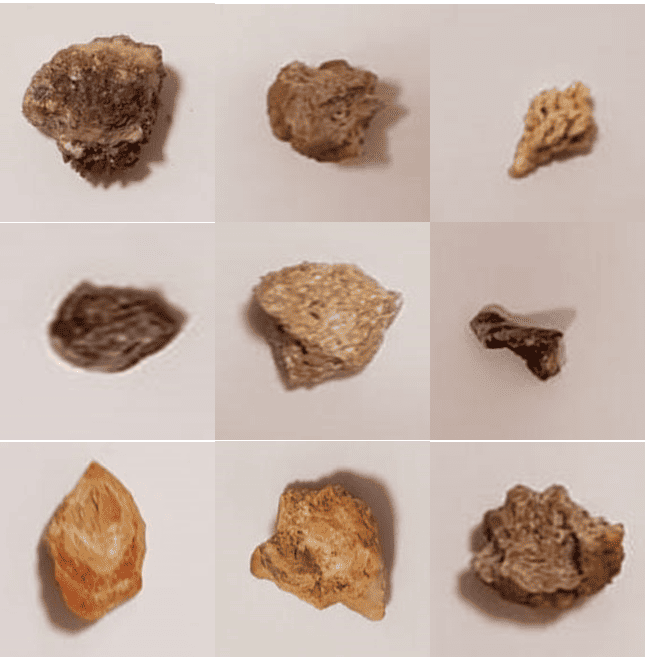
Figure 2: Photographs of 9 selected out of 50 investigated kidney stones.
Stone analysis by FTIR spectroscopy: FTIR spectra were recorded using a Nicolet iS5 FTIR spectrometer equipped with an (ATR) Miracle accessory. A more recent technique involving IR spectroscopy is the Attenuated Total Reflection Technique (ATR), which is suitable for analyzing soft samples (Schubert 2006). Sample preparation for this technique is very easy, as it does not require mixing the sample with an IR inactive material. Consequently, single reflection measurements are capable of yielding good quality spectra under conditions of good optical contact of the sample with the ATR crystal. Hence, the principal benefit is that ATR sampling for abrasive or chemically hostile samples is now routine [21]. The spectral region investigated was from 4000 to 400 cm−1; 32 scans were averaged with a 4 cm−1 resolution for each spectrum. The background spectrum was measured initially with no sample in contact with the attenuated total reflectance (ATR) unit of the Nicolet iS5 FTIR spectrometer (Thermo Fisher Scientific Inc., Waltham, MA, USA) with a zinc selenide crystal to deliver a comparative scale for the intensity of absorption and blank subtraction. The spectra were collected with the help of Thermo Scientific OMNIC software (Thermo Electron Corporation, Madison, WI, USA). Automatic comparisons were made for spectrum identification. As a result of the comparison, the score value was obtained with values ranging from 0.000 to 1.000, with a score of 1.000 indicating a perfect similarity between the unknown spectrum and the reference spectrum. Visual inspection of the spectra was also done to check the results. Reports were generated on the stone components that gave details of the chemical name, mineral name, and chemical formula.
Results and Discussion
If the stone analyzes are done correctly by the physicists/chemists and they can collect all the relevant information from the stone, they can assist physicians in determining the cause(s) of stone formation and growth. For that purpose, physicians may investigate blood and urine biochemistry of each stone former in order to identify metabolic disorders able to provide accurate information on a possible metabolic disease or risk factors. It should be noted that such a metabolic study does not provide a true diagnosis of lithogenic disease if the composition of the stone does not match. When we look at the stone analyzes, we see that qualitative and quantitative information about the crystalline phases and structural properties are given [24]. In such studies, the necessity of accurately determining the composition of all parts of the stone (core, inner layers, peripheral layers and surface) should be considered. During the study period, 50 kidney stones were sent to the basic sciences research laboratory for analysis. The mean size of the submitted stones was 9.2±5.0 mm and the median stone weight was 0.29 g. Core and surface composition were analyzed only 12 large stones. Comparison of the differences in chemical composition in the core and surface of large kidney stones using FTIR spectroscopy is given in (Table 1). As shown in (Table 1), 5 stones were identified with the chemical composition of the core completely different from the outer layers. Based on these results, we can say that it is required to accurately determine the composition of all parts of the stone (core, inner layers, peripheral layers and surface). Based on the differences found in 5 of the 12 stones examined, a qualitative analysis of the whole stone with the relative proportions of all components identified by analysis can be recommended. (Figure 3) shows the infrared spectra of urinary stones, where we can see the characteristic bands.
The region from 3100 to 3700 cm−1 shows a broad band related to the water and OH group vibration signals. The absorption at 3488 cm−1and 3478 cm−1were due to symmetrical and asymmetrical O-H stretching vibrations while 3376 cm−1and 3335 cm−1were attributed to weak O-H bonding due to water of crystallization. The absorption at 3066 cm−1was due to O-H single vibration and the strong absorption band observed at 2821 cm−1belongs to vibration of N―H stretching [25,26] We can find the difference between COM and COD from the band at 3066 cm-1, which shows the individual OH stretching in resonance with the vibration of the C=C bond of oxalate because COM has only one water molecule between these bonds, which promotes the more significant vibration. At 3010 cm−1it was caused by N-H secondary amine stretching, while at 1627 cm−1and 1323 cm−1it was attributed to the asymmetric and symmetrical stretching vibrations of CO2, respectively. In the figures, the bands at 780 cm−1and 521 cm−1are fingerprints of oxalates showing the O = CO bending plane and the vibrational mode of CO2 [27]. The thin and dense bands at 1125 and 991 cm−1can be attributed to stretching of the C–C bonds, while the band at 1587 cm−1can be attributed to the carbonyl group of the conjugated amide [28,29]. (Table 1,2) lists the main signals of the FTIR spectra given in (Figure 3). Absorption at 780 cm−1may be due to the presence of asymmetric stretching vibrations such as metal-oxygen, δ (O-C=O) or P-O-P, while vibrations at 660cm−1and 518 cm−1are due to the shaking of CO2 or (HO) P=O. It can be seen from figures that the FTIR spectra of the same type of urinary stones are similar. The FTIR spectra are also different when urinary stones are of mixed form, such as calcium oxalate, calcium hydrogen phosphate dihydrate (CHPD-brushite) and ammonium magnesium phosphate hexahydrate (struvite).
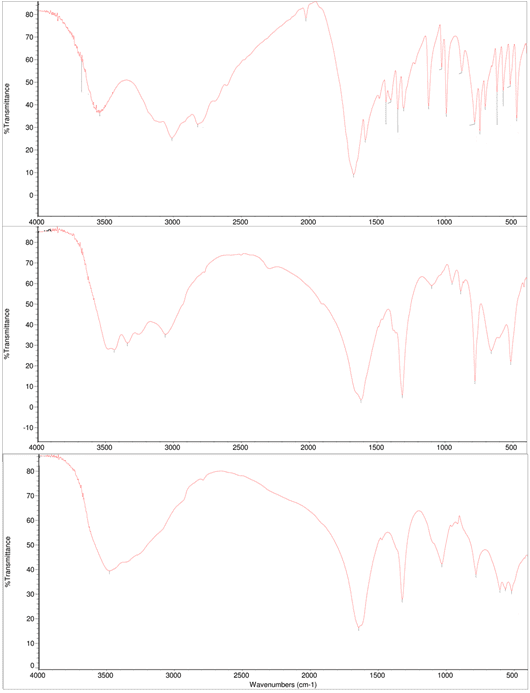
Figure 3: FTIR spectra of kidney stone samples in the region 400-4000 cm-1.
|
Sample Number |
Core Composition |
Surface Composition |
|
KS1 |
COD |
COD |
|
KS2 |
COM |
COM |
|
KS3 |
Uric acid |
Uric acid |
|
KS4 |
COD |
COD |
|
KS5 |
Ammonium Urate |
COD |
|
KS6 |
Uric acid |
COM |
|
KS7 |
COM |
COM |
|
KS8 |
Carbonate Apatite |
COM |
|
KS9 |
COM |
COD |
|
KS10 |
COM |
COM |
|
KS11 |
Uric acid |
Uric acid |
|
KS12 |
Carbonate Apatite |
Uric acid |
Table 1: Analysis results of differences in chemical composition of core and surfaces of large kidney stones using FTIR spectroscopy.
|
Wavenumbers (cm-1) |
IR assignment |
||||
|
COM |
COD |
Uric acid |
Apatite |
MAPH |
|
|
3488 |
3478 |
- |
- |
- |
O-H symmetric and asymmetric vibrations |
|
3276 |
3335 |
- |
3142 |
- |
Water vibrations |
|
3066 |
- |
- |
- |
- |
O-H single vibration |
|
- |
- |
3010 |
- |
- |
N-H secondary amine stretching |
|
- |
- |
2821 |
- |
- |
N-H vibration |
|
- |
- |
2025 |
- |
- |
C=N vibration |
|
- |
- |
- |
1690 |
- |
O-H deformation |
|
1624 |
1643 |
- |
1620 |
- |
COO asymmetric vibrations |
|
- |
- |
1591 |
- |
- |
C=O bond in conjugated amine |
|
- |
- |
- |
- |
1435 |
PO4 group |
|
1387 |
1382 |
- |
- |
- |
Vibration of C-C |
|
1323 |
1348 |
- |
- |
- |
COO symmetric vibration |
|
- |
- |
- |
1125 |
- |
PO4-3 stretching |
|
1054 |
1049 |
- |
1037 |
- |
PO4- stretching |
|
- |
- |
991 |
- |
- |
C-C bond stretching |
|
950 |
949 |
- |
- |
- |
C-O stretching |
|
- |
- |
- |
- |
874 |
PO4- group |
|
885 |
877 |
876 |
- |
- |
C-C stretching |
|
783 |
780 |
780 |
778 |
783 |
C-C stretching |
|
- |
- |
- |
- |
764 |
PO4-3 group |
|
660 |
657 |
- |
- |
- |
Out of plane O-H bending |
|
- |
- |
- |
618 |
- |
OP=O vibration |
|
572 |
521 |
- |
563 |
- |
O-P-O vibration |
|
518 |
517 |
- |
511 |
- |
O C-O in plane bending |
|
- |
- |
- |
- |
468 |
PO4-3 group |
|
- |
- |
464 |
- |
- |
NH4+ deformation |
Table 2: Characteristic bands of the samples detected by FTIR spectroscopy with their possible IR assignments and compounds.
Conclusion
Vibration spectroscopy, like IR, is clearly promising in different clinical applications such as screening for kidney stone disease. This study presents a regional analysis of stone composition in Erzincan, Turkey, to highlight the importance of stone analysis to prevent any recurrence or potential progression to chronic renal failure in patients with kidney stones.Similar to the findings we encountered in the literature, the results of our study with the FTIR spectrometer showed good sensitivity and allowed the elements that make up the stones to be identified with great accuracy [27,30,31]. In the current study, the FTIR study on kidney stones showed that kidney stones were mainly composed of COM, calcium phosphate, magnesium ammonium phosphate, calcium carbonate and uric acid. In addition, one of the important results obtained with this study is that if useful results are to be obtained when using the FTIR technique, it is necessary to analyze all possible layers of the stone separately. In fact, core composition differed from the stone surface in 5 of 12 stones analyzed by FTIR. If you clinically determine the composition of both the stone surface and the center or core correctly, you can correctly suggest the cause of the stone formation. Based on this study, we can say that FTIR spectroscopy is a very sensitive, reliable and less time-consuming technique for chemical analysis and classification of kidney stones.
References
- Finlayson B (1978) Physicochemical aspects of urolithiasis. Kidney Int 13: 344-360.
- Evan AP (2010) Physiopathology and etiology of stone formation in the kidney and the urinary tract. Pediatr Nephrol 25: 831-841.
- Khan SR, Pearle MS, Robertson WG, Gambaro G, Canales BK, et al. (2017) Kidney stones. Nature reviews (Disease primers) 3: 17001.
- Sorokin I, Mamoulakis C, Miyazawa K (2017) Allen Rodgers, Talati J, Lotan Y. Epidemiology of stone disease across the world. World J Urol 35: 1301-1320.
- Hesse A, Brandle E, Wilbert D, Köhrmann KU, Alken P (2003) Study on the prevalence and incidence of urolithiasis in Germany comparing the years 1979 vs. 2000. Eur Urol 44: 709-713.
- Scales CD, Smith AC, Hanley JM, Saigal CS (2012) Prevalence of kidney stones in the United States. Eur Urol 62: 160-165.
- Osther PJS (2012) Epidemiology of kidney stones in the European Union. In: Talati JJ, Tiselius H-G, Albala DM, and Ye Z, editors. Urolithiasis: basic science and clinical practice. London, (UK): Springer London 2012: 3-12.
- Ye Z (1984) The status and characteristics of urinary stone composition in China. BJU Int 125: 801-809.
- Daudon M, Réveillaud RJ (1984) Whewellite and weddellite: toward different etiopathogenesis. Interest of the morphological typing of the stones. Néphrologie 5: 195-201.
- Maurice-Estepa L, Levillain P, Lacour B, Daudon M (1999) Crystalline phase differentiation in urinary calcium phosphate and magnesium phosphate calculi. Scand J Urol Nephrol 33: 299-305.
- Méria P, Hadjadj H, Jungers P, Daudon M (2010) Stone formation and pregnancy: pathophysiological insights gained from morphoconstitutional stone analysis. J Urol 183: 1412-1416.
- Hesse A, Kruse R, Geilenkeuser WJ, Schmidt M (2005) Quality control in urinary stone analysis: results of 44 ring trials (1980–2001). Clin Chem Lab Med 43: 298-303.
- Bastian PJ, Lorken M, Euler H, Lummen G, Bastian HP (2008) Results of the evaluation of 85337 urinary stone analyses. Aktuelle Urol 39: 298-304.
- Estepa L, Daudon M (1997) Contribution of fourier transform infrared spectroscopy to the identification of urinary stones and kidney crystal deposits. Biospectroscopy 3: 347-369.
- Selvaraju R, Raja A, Thiruppathi G (2012) FT-Raman spectral analysis of human urinary Stones. Spectrochimica Acta Part A 99: 205-210.
- Kodati VR, Tomasi GE, Turumin JL, Tu AT (1991) Raman Spectroscopic Identification of Phosphate-Type Kidney Stones. Applied Spectroscopy 45: 581-583.
- Marickar YM, Lekshmi PR, Varma L, Koshy P (2009) EDAX versus FTIR in mixed stones. Urol Res 37: 271-276.
- Sharma RN, Shah I, Gupta S, Sharma P, Beigh AA (1989) Thermogravimetric analysis of urinary stones. Br J Urol 64: 564-566.
- Daudon M, Jungers P (2012) Stone composition and morphology: a window on etiology. In: Talati JJ, Tiselius HG, Albala DM, Ye Z (eds) Urolithiasis: basic science and clinical practice. Springer, London 2012; 113-140.
- Daudon M, Bader CA, Jungers P (1993) Urinary calculi: review of classification methods and correlations with etiology. Scanning Microsc 7: 1081-1106.
- Khan AH, Imran S, Talati J, Jafri L (2018) Fourier transform infrared spectroscopy for analysis of kidney stones. Investig Clin Urol 59: 32-37.
- Kasidas GP, Samuell CT, Weir TB (2004) Renal stone analysis: why and how? Ann Clin Biochem 41:91-97.
- Selvaraju R, Thiruppathi G, Raja A (2012) FTIR spectral studies on certain human urinary stones in the patients of rural area. Spectrochimica Acta Part A 93: 260-265.
- Durdağı SP, HashimAl-Jalawee AH, Yalçin P, Bozkurt AS, Salcan S (2023) Morphological Characterization and Phase Determination of Kidney Stones Using X-Ray Diffractometer and Scanning Electron Microscopy. Chinese Journal of Physics In Press, Journal Pre-proof 83: 379-388.
- Wilson EV, Bushiri MJ, Vaidyan VK (2010) Characterization and FTIR spectral studies of human urinary stones from Southern India. Spectrochim Acta A 77: 442-445.
- Singh VK, Jaswal BBS, Sharmaa J, Raib PK (2017) Spectroscopic investigations on kidney stones using Fourier transform infrared and X-ray fluorescence spectrometry. X-Ray Spectrometry 46: 283-291.
- Cruz-May TN, Herrera A, Rodríguez-Hernández J, Basulto-Martínez M (2021) Structural and morphological characterization of kidney stones in patients from the Yucatan Maya population. Journal of Molecular Structure 1235: 130267.
- Tonannavar J, Deshpande G, Yenagi J, Patil SB, Patil NA, et al. (2016) Identification of mineral compositions in some renal calculi by FT Raman and IR spectral analysis, Spectrochim. Acta Part A 154: 20-26.
- Sekkoum K, Cheriti A, Taleb S, Belboukhari N (2016) FTIR spectroscopic study of human urinary stones from El Bayadh district (Algeria), Arabian J. Chem 9: 330-334.
- Kocademir M, Baykal A, Kumru M, Tahmaz ML (2016) Structural characterization and vibrational studies of human urinary stones from Istanbul, Turkey. Spectrochimica Acta Part A: Molecular and Biomolecular Spectroscopy 160: 1-7.
- Joshi VS, Vasant SR, Bhatt JG, Joshi MJ (2014) Some critical aspects of FT-IR, TGA, powder XRD, EDAX and SEM studies of calcium oxalate urinary calculi. Indian Journal of Biochemistry and Biophysics 51: 237-243.
© by the Authors & Gavin Publishers. This is an Open Access Journal Article Published Under Attribution-Share Alike CC BY-SA: Creative Commons Attribution-Share Alike 4.0 International License. Read More About Open Access Policy.