Unapparent Parenchymal Density Changes in the Negative CT Examinations of Patients with COVID-19 Pneumonia
by Bahar Yılmaz Çankaya1*, Ahmet Yalcin¹, Gökhan Polat², Adem Karaman¹, Fatih Alper¹, Recep Sade¹, Berhan Pirimoglu³, Metin Akgun⁴, Mete Yağanoğlu⁵, Fatih Albayrak⁶
1Ataturk University, Faculty of Medicine, Department of Radiology, Erzurum, Türkiye
2Kütahya Health Sciences University, Department of Radiology, Kütahya, Türkiye
3Health Sciences University, Gaziantep City Hospital, Department of Radiology, Gaziantep, Türkiye
4Ağrı İbrahim Çeçen University, Faculty of Medicine, Department of Internal Medicine and Chest Diseases, Ağrı, Türkiye
5Ataturk University, Faculty of Engineering, Computer Engineering, Erzurum, Türkiye
6Ataturk University, Faculty of Medicine, Department Gastroenterology & Hepatology, Erzurum, Türkiye
*Corresponding author: Bahar Yılmaz Çankaya, Ataturk University, Faculty of Medicine, Department of Radiology, Yunus Emre Mh. 1. Ulaş Cad. MF Sarıyer Sitesi A blok No:10 Palandöken/ Erzurum, Türkiye
Received Date: 08 October, 2025
Accepted Date: 20 October, 2025
Published Date: 29 October, 2025
Citation: Çankaya BY, Yalcin A, Polat G, Karaman A, Alper F, et al. (2025) Unapparent Parenchymal Density Changes in the Negative CT Examinations of Patients with COVID-19 Pneumonia. J Community Med Public Health 9: 540. https://doi.org/10.29011/25772228.100540
Abstract
Purpose: In this study, we aimed to compare the densities of affected lobes versus normal-appearing contralateral lobes in the initial CT of COVID-19 patients who had visually negative initial CT examinations. Methods: Twenty-one lung lobes of 18 patients with a proven diagnosis of COVID- 19 disease, who had more than one CT scan at an interval of three–six days, were included in the study. Lung segmentation and volumetric density calculations of the affected and normal-appearing contralateral lobes were performed using dedicated software. The selection of the affected lobes was determined according to the findings in the follow-up CT. The density data of the affected lung lobe and opposite normal-appearing lung were calculated in the initial CT, recorded for each patient, and compared statistically. Results: The mean duration between the first and second CT examinations was 4.5±1.3 days (range, 3-6 days). The mean density of the lung lobe was -777.6±48.3 and -817.2±20.4 HU for the affected and normal-appearing sides, respectively (p=0.003). The differences in densities between the affected and normal-appearing lobes were moderately correlated with age (p=0.028, r=0.516) whereas the time interval between the examinations showed a moderately negative correlation with age (p=0.003, r=-0.647). Conclusions: The early CT scan of COVID-19 disease shows altered CT densities of the affected lung lobe compared to the normal-appearing side in the presence of visually negative CT results. These changes progress into visible imaging findings of the disease within three to six days.
Keywords: COVID-19; Computed tomography; Normalappearing lung; Density
Introduction
In December 2019, the coronavirus disease (COVID-19) emerged as a global threat, and since then has resulted in the death of thousands of people, with the number of cases still increasing. The World Health Organization (WHO) declared the disease as a pandemic and classified the virus as Severe Acute Respiratory Syndrome coronavirus-2 (SARS-Cov-2) [1]. The diagnosis of the disease is established by the developed reverse transcriptionpolymerase chain reaction (RT- PCR) test, which is highly specific but has a low sensitivity [2]. With the rapid spread of the pandemic, CT imaging started to be used to assist in the diagnosis. Several CT imaging features have been found to be specific to the COVID-19 disease [3,4]. The data regarding the role of imaging in the COVID-19 disease reveal that CT scan is normal in up to approximately 50% of patients. Therefore, it is accepted that negative CT findings reported by the radiologist do not indicate a true negative disease [5] since they are based on what is visible on the image. To our knowledge, to date, no study in the literature has assessed the non-visible density-related alterations in the lungs of COVID-19 patients with negative initial CT reports.
In this study, we aimed to measure the mean density of the affected lung lobe of patients with the COVID-19 disease in the visually negative initial CT scan and to compare the HU values with those acquired from the opposite normal-appearing lung parenchyma.
Material and Methods
This retrospective study was approved by the institutional ethics committee. This study was supported by the Atatürk University BAP Project coordination unit (ID9834, AB-2022-9834).
Patient Selection
Between March 2022 and April 2022, all patients diagnosed with the COVID- 19 disease based on RT-PCR were enrolled in the study. The detailed flowchart with the inclusion/exclusion criteria is presented in Figure 1. From this patient population, 21 lung lobes from 18 patients were elected for the final assessment. The involvement of the middle lobe of the right lung was not included in the assessment since it does not have a left counterpart. Patients with imaging findings that indicated the presence of a cardiovascular or pulmonary disease, including cardiomegaly, air trapping, dilatation of the aortic root, dilatation of the main pulmonary artery, and emphysema were also excluded.
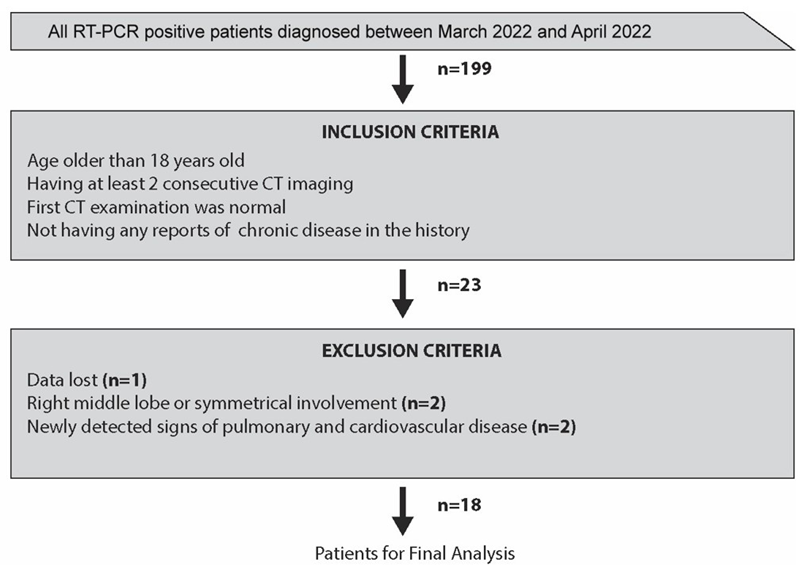
Figure 1: Study flowchart with the inclusion and exclusion criteria.
Image Acquisition and Data Analysis
All patients were examined using a 16-row multi-detector CT device (Somatom Emotion 16, Siemens Healthcare, Erlangen, Germany). All thorax CT scan parameters were as follows: collimation, 1.5 mm; tube current, 120 mAs; field of view, 300 mm; and matrix, 512x512. None of the patients received an intravenous contrast agent.
The data of visually negative CT scan were transferred to an offline workstation, and semi-automated parenchyma volume segmentation and fully automatic volumetric density calculations were performed using dedicated software (3D Slicer v4.10.2 software, http://www. slicer.org). The lung lobe to be segmented was determined based on the positive finding at second CT scan (Figure 2 A and B). Three radiologists with 10 years of experience in thoracoabdominal radiology processed the data retrospectively and a consensus was reached. Lung segmentation was performed in two steps: First, a threshold function was applied and parenchyma with density between -500 and -1024 HU was selected (Figure 3A). This selection was used as masking, and then semiautomated tracing function was applied to each slice for the selection of the symmetric lung lobes separately (Figure 3B). While the level tracing method enabled the segmentation of the lung, the threshold function eliminated the pixels with high density from anatomical structures, such as vessels and bronchi. Volumetric density calculations were performed automatically for each lobe using the built-in segmentation statistics of the software.
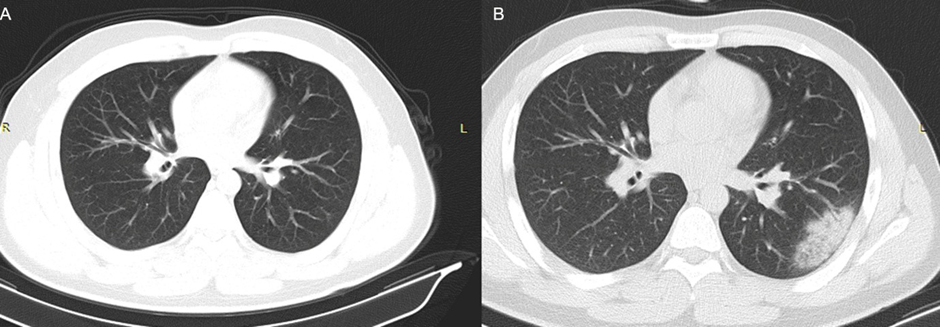
Figure 2: Consecutive CT scans of a 25-year-old male patient performed at an interval of five days. The first CT (A) was negative whereas the second CT (B) showed focal consolidation with surrounding ground-glass opacities.
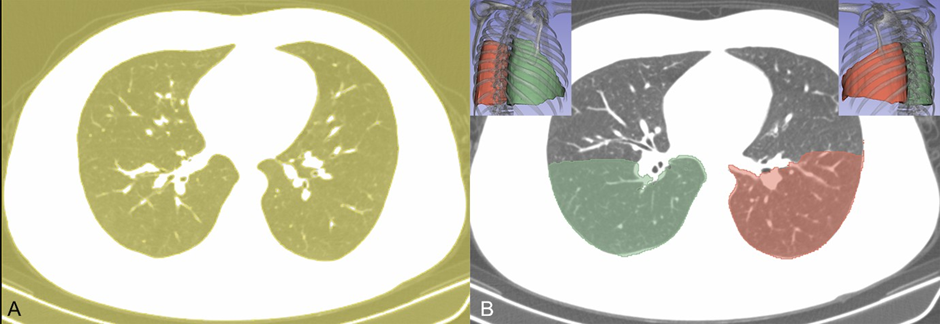
Figure 3: Lung segmentation of the CT image of the patient in Figure 2. (A) An initial segmentation was applied with a density threshold function (between -500 and -1024 HU). (B) Later, a contour tracing method was used for the lobe segmentation to acquire volumetric data.
Statistical analysis
The summary statistics of the patients were obtained based on mean and standard deviation values. The distribution of normality was assessed with the D’Agostino-Pearson test. Normally distributed continuous variables regarding the density data of the lung lobes were compared using the independent t-test. A two- tailed p-value of <0.05 was considered statistically significant. All statistical analyses were performed using the R statistical software (R Foundation for Statistical Computing, Vienna, Austria).
Results
The mean age of the study population was 37.7 ± 17.1 years and, and 10 (55.6%) of the study population was female. All the patients were symptomatic at the time they had their negative initial CT.
The mean duration between the first and second CT procedures was 4.5 ± 1.3 days (range, 3–6 days). The mean total lung lobe density was -777.6 ± 48.3 and -817.2 ± 20.4 HU in the affected lobe and the normal-appearing contralateral lobe, respectively. The affected lobes were significantly denser compared to the normalappearing lobes (p = 0.003). The differences in densities between the affected and normal-appearing lobes was moderately correlated with age (p = 0.028, r = 0.516) whereas the time interval between the examinations showed a moderately negative correlation with age (p = 0.003, r = -0.647). Gender did not have any correlation with the differences in density.
Ground-glass opacities were present in 10 (47.6%) out of 21 affected lung lobes whereas all the remaining lobes had focal consolidation with surrounding ground glass opacity in the second CT scan. There was no statistically significant difference between the ground-glass and focal consolidation group in terms of the density values on the initial CT images (p = 0.866).
Discussion
Our findings revealed that the involvement of the lungs was still present in CT as long as six days before the apparent imaging findings were visually detected. Furthermore, the severity of the density of the lung involvement in the visually negative CT images was associated with the age of the patients.
The COVID-19 disease emerged in a single town in China in December 2019 and spread to the world within a few months. It was classified as a pandemic by WHO and reported to have only human-to-human transmission [1,6,7]. The time elapsed until the infected person shows signs of the disease is reported to be 5.2 days [8]. After the outbreak of the disease, an RT-PCR test was developed as a diagnostic test with relatively high specificity and low sensitivity [9,10]. Since the disease spreads rapidly, CT imaging has been endorsed as an auxiliary modality for diagnostic, triage and screening purposes [11,12]. A variety of imaging findings were defined in the CT of patients with COVID-19, including focal ground-glass opacities, focal consolidations, multi-focal lung opacities, and crazy-paving pattern [3,4].
However, in approximately 50% of the patients with the confirmed diagnosis of the disease, normal chest CT findings are reported [2]. Our visually negative CT rate was 20.4%, which is consistent with the literature. In our study, 10 of 21 lung lobes had ground- glass opacities whereas 11 had focal consolidations. None of our patients presented with the crazy-paving pattern, which may be associated with our data acquisition in the early course of the disease.
The negative rate of CT is suggested to be associated with the early onset of COVID-19, and the time elapsed between the symptoms and the detection of a positive imaging finding on CT scan is reported to be between four and 10 days [3,14]. However, it is also accepted that a negative CT in a suspected patient cannot exclude the diagnosis [5]. It does not seem feasible to screen every patient using CT to observe the possible development of well-recognized patterns due to the potential risk of radiation [14]. In our study, we showed that there were invisible parenchymal alterations in initial CT scan, and these changes progressed into ground-glass opacities and consolidation after a while. These findings suggest that the lungs are affected far earlier even before the disease related visible parenchymal changes emerge in the CT examination.
The role of CT imaging in the diagnosis of the COVID-19 disease is still under debate, with some authors arguing that the CT features of the disease can guide the diagnosis even in the absence of a positive RT-PCR test result [10,15] or it could be a diagnostic tool with high sensitivity (up to 97%) [10] while others suggesting that the success of CT imaging is overestimated [16]. The common ground of studies associating CT imaging with higher sensitivity is the location where such studies have been undertaken. CT imaging has been found useful and CT findings are most probably suggestive of the disease in epidemic areas or those with a higher incidence [10,15] due to affection of sensitivity and specificity by the prevalence of the disease [17]. Our results suggest that repeated CT scan at an interval of three to six days can aid to timely establish the diagnosis.
This study has some clinical implications. First, the negative CT results do not exclude the COVID-19 diagnosis, and the patient’s state can deteriorate within a short time, such as three days. Second, we found that older patients that have initial negative CT, present apparent imaging findings earlier and more severely than the younger cases. This would suggest that repeated scans may be critical in such circumstances.
Some limitations to our study should also be considered. Although we detected some initially invisible changes in the lungs before the apparent imaging features emerged, it can be challenging to assess the CT of patients with a post- processing procedure during a pandemic. Furthermore, our study had a small sample size due to our strict scan interval criterion of three to six days. This interval would be expanded if the data of early initial and late control CT scans were available.
In this study, we showed that the early CT imaging of the COVID-19 disease shows altered CT densities of the affected lung lobes compared to the normal- appearing side even in the absence of any apparent imaging finding, and these changes progress into typical imaging findings of the disease within three to six days.
Highlights
- An initial negative CT in symptomatic patients of COVID-19 does not mean a true negative disease.
- Affected lung lobes have higher density in the initial scan of CT imaging of COVID19 patients which reported negative.
- Invisible density changes progress into apparent imaging features in 3-6 days.
Compliance with Ethical Standards
Acknowledgements: None Conflict of interest: None to declare
Funding
This study was supported by the Atatürk University BAP Project coordination unit (ID9834, AB-2022-9834). This study, conducted on human subjects, was approved by institutional ethics committee and informed consent was obtained from all participants.
References
- Kooraki S, Hosseiny M, Myers L, Gholamrezanezhad A (2020) Coronavirus (COVID-19) Outbreak: What the Department of Radiology Should Know. J Am Coll Radiol 17: 447-451.
- Kanne JP, Little BP, Chung JH, Elicker BM, Ketai LH (2020) Essentials for Radiologists on COVID- 19: An Update-Radiology Scientific Expert Panel. Radiology 296: E113-E114.
- Pan F, Ye T, Sun P, Gui S, Liang B, et al. (2020) Time Course of Lung Changes on Chest CT During Recovery From 2019 Novel Coronavirus (COVID-19). Pneumonia Radiology 295: 715-721.
- Bernheim A, Mei X, Huang M, Yang Y, Fayad ZA, et al. (2020) Chest CT Findings in Coronavirus Disease-19 (COVID-19): Relationship to Duration of Infection. Radiology 295: 200463.
- Yang W, Yan F (2020) Patients with RT-PCR-confirmed COVID-19 and Normal Chest CT. Radiology 295: E3.
- Wang C, Horby PW, Hayden FG, Gao GF (2020) A novel coronavirus outbreak of global health concern. Lancet 395: 470-473.
- Zhu N, Zhang D, Wang W, Li X, Yang B, et al. (2020) A novel coronavirus from patients with pneumonia in China 2019. N Engl J Med 382: 727-733.
- Li Q, Guan X, Wu P, Wang X, Zhou L, et al. (2020) Early Transmission Dynamics in Wuhan, China, of Novel Coronavirus-Infected Pneumonia. N Engl J Med 382: 1199-1207.
- Fang Y, Zhang H, Xie J, Lin M, Ying L, et al. (2020) Sensitivity of Chest CT for COVID-19: Comparison to RT-PCR. Radiology 296: E115-E117.
- Ai T, Yang Z, Hou H, Zhan C, Chen C, et al. (2020) Correlation of Chest CT and RT-PCR Testing for Coronavirus Disease 2019 (COVID-19) in China: A Report of 1014 Cases. Radiology 296: E32-E40.
- Zhao W, Zhong Z, Xie X, Yu Q, Liu J (2020) Relation Between Chest CT Findings and Clinical Conditions of Coronavirus Disease (COVID-19) Pneumonia: A Multicenter Study. AJR Am J Roentgenol 214: 1072-1077.
- Li Y, Xia L (2020) Coronavirus Disease 2019 (COVID-19): Role of Chest CT in Diagnosis and Management AJR Am J Roentgenol 214: 1280-1286.
- Yang W, Cao Q, Qin L, Wang X, Cheng Z, et al. (2020) Clinical characteristics and imaging manifestations of the 2019 novel coronavirus disease (COVID-19):A multi-center study in Wenzhou city, Zhejiang, China. J Infect 80: 388-393.
- Erturk SM (2020) CT Is Not a Screening Tool for Coronavirus Disease (COVID-19) Pneumonia. AJR Am J Roentgenol 215: W11.
- Chua F, Armstrong-James D, Desai SR, Barnett J, Kouranos V, et al. (2020) The role of CT in case ascertainment and management of COVID-19 pneumonia in the UK: insights from high-incidence regions. Lancet Respir Med 8: 438-440.
- Erturk SM (2020) CT of Coronavirus Disease (COVID-19) Pneumonia: A Reference Standard Is Needed. AJR Am J Roentgenol 215: W20.
- Sardanelli F, Di Leo G (2009) Biostatistics for Radioogists. Trento: Springer: 20-35.
© by the Authors & Gavin Publishers. This is an Open Access Journal Article Published Under Attribution-Share Alike CC BY-SA: Creative Commons Attribution-Share Alike 4.0 International License. Read More About Open Access Policy.