The Scientific Basis, Application and Limitations of Diffusion Tensor Imaging in the Management of Cervical Spondylotic Myelopathy
by Uchenna Ajoku1*, Alizadeh A2, Dhaliwal P3, Ukachukwu AK4
1Department of Surgery, University of Port Harcourt, Port Harcourt, Nigeria
2Department of Neurology, Health Sciences Center, University of Manitoba, Canada
3Section of Neurosurgery, University of Manitoba, Winnipeg, Manitoba, Canada
4Division of Global Neurosurgery and Neurology, Duke University, USA
Received Date: 03 January, 2026
Accepted Date: 22 January, 2026
Published Date: 02 February, 2026
Citation: Ajoku U, Alizadeh A, Dhaliwal P, Ukachukwu AK (2026) The Scientific Basis, Application and Limitations of Diffusion Tensor Imaging in the Management of Cervical Spondylotic Myelopathy. J Orthop Res Ther 11: 1415. DOI: https://doi.org/10.29011/2575-8241.001415
Abstract
Cervical spondylotic myelopathy (CSM) remains the leading cause of spinal cord dysfunction in older adults, yet conventional MRI correlates poorly with clinical severity and does not reliably predict postoperative recovery. Diffusion tensor imaging (DTI) that assesses white-matter microstructure, has emerged as a promising adjunct for early diagnosis, disease grading, and prognostication. However, its clinical utility remains uncertain due to methodological variability and limitations. A comprehensive literature search of databases identified studies evaluating DTI for diagnosis, assessment of disease severity, prediction of postoperative outcome, and methodological considerations in CSM. 47 studies were included and analyzed for design, sample characteristics, DTI parameters, key findings, and reported diagnostic accuracy. Across diagnostic studies, fractional anisotropy (FA) was reduced and apparent diffusion coefficient (ADC) increased in patients with CSM, often preceding T2-weighted abnormalities and correlating with clinical severity. Several studies demonstrated that preoperative FA and ADC predict postoperative functional outcomes; however, the findings are inconsistent and influenced by differences in acquisition parameters, ROI selection, and timing. Technical constraints, including motion artifacts, susceptibility effects, and non-Gaussian diffusion behaviour, limit reproducibility. Methodological heterogeneity and lack of standardization remain major barriers to clinical translation. DTI offers enhanced sensitivity for detecting microstructural spinal cord injury and shows promise for improving prognostication in CSM. However, technical and methodological challenges must be addressed before routine clinical implementation. Large multicentre studies using standardized acquisition protocols and advanced diffusion models such as Neurite Orientation Dispersion and Density Imaging (NODDI) are needed to establish validated thresholds and define DTI’s role in evidence-based CSM management.
Keywords: Cervical Spondylotic Myelopathy (CSM), Magnetic Resonance Imaging (MRI), Diffusion Tensor Imaging (DTI), Fractional Anisotrophy (FA), Apparent Diffusion Coefficient (ADC), Mean diffusivity (MD)
Introduction
Cervical spondylotic myelopathy (CSM) is the leading cause of spinal cord dysfunction in adults over 50 years of age and represents a substantial proportion of the operative burden in spine practice worldwide [1]. Although surgical decompression is the standard intervention for moderate to severe or progressive disease, postoperative outcomes remain highly variable. Approximately one-third of patients show no meaningful improvement, and only 60-70% recover functional capacity following surgery [2]. These inconsistent results reflect two longstanding challenges.
First, clinical findings correlate poorly with conventional MRI sequences. Asymptomatic patients frequently exhibit significant degenerative changes, while many symptomatic individuals demonstrate minimal or ambiguous imaging abnormalities [38]. Second, despite extensive investigation, no widely accepted imaging biomarker reliably predicts postoperative recovery [911]. This gap complicates decisions regarding surgical timing, candidacy, and prognostic counselling.
Diffusion tensor imaging (DTI), a quantitative MRI modality assessing water diffusion within spinal cord white matter, has emerged as a promising adjunct. By capturing microstructural changes undetectable on T2-weighted imaging, DTI may improve early diagnosis, refine disease grading, and offer prognostic insights. Advanced diffusion models, such as biophysical tissue modelling and standardized cord MRI frameworks, provide additional support for these applications.
The purpose of this review is to synthesize available evidence on the scientific basis of DTI, evaluate its role in diagnosis and prognosis of CSM, and delineate technical and methodological limitations affecting its clinical integration.
Materials and Methods
A comprehensive search of PubMed and Embase was conducted using the terms diffusion tensor imaging, cervical spondylotic myelopathy, fractional anisotropy, and apparent diffusion coefficient. Boolean operators combined MeSH and free-text keywords. Studies were included if they addressed the diagnostic, prognostic, or methodological value of DTI in CSM. Titles and abstracts were screened, with additional studies retrieved through citation tracking.
Data Extraction
Extracted data included study design, sample characteristics, DTI parameters assessed, imaging methodology, clinical correlations, and reported diagnostic accuracy. No restrictions were placed on field strength, acquisition protocol, or DTI model. Advanced diffusion research relevant to spinal cord microstructure was also incorporated for scientific context, including non-Gaussian diffusion modeling.
Results
From an initial 118 articles, 47 met the inclusion criteria. A summary of the key results of the reviewed studies is shown is discussed.
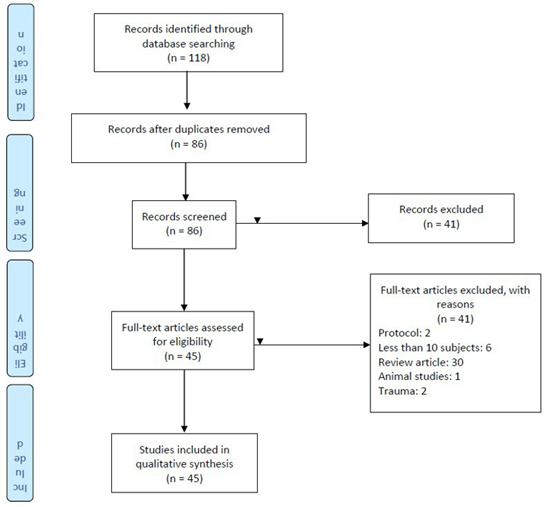
Figure 1: PRISMA 2009 Flow Diagram.
DTI compared to Traditional MRI Modalities
Traditional magnetic resonance imaging (MRI) using T1- and T2weighted sequences cannot sufficiently characterize spinal cord lesions. Reis et al. showed that DTI could detect cord changes in patients with narrow cervical canals despite normal T1W and T2W images. Other authors have corroborated these findings, suggesting that DTI is more sensitive in identifying cord damage than regular T2W images of the cervical spine in patients with CSM [1]. It is postulated that DTI/fibre tract analysis could help elucidate the reason behind these changes, which have been suggested to reflect several diverse pathological conditions, including edema, gliosis, syringomyelia and inflammation. This limitation in the traditional neuroimaging for CSM has led to the development of newer imaging modalities to evaluate the ‘functional’ state of the spinal cord. Recent spine literature on CSM is awash with DTI and the various matrices for evaluation and prognostication.
The Basis of DTI
Long white matter fibre tracts are structurally organized in parallel bundles, and their myelin sheath facilitates the diffusion of the water molecules along their longitudinal axis. Fiber tracking technology uses diffusion tensor to track fibers along their length starting from a seed region of interest (ROI). A computer algorithm “tracks” adjacent voxel with the main diffusion direction in continuity with the preceding one. By repeating this process, the whole white matter pathway can be tracked [1].
Diffusion imaging enables us to study molecular water diffusion across tissues and, therefore, the ability to probe the microstructural properties of biological tissues. The average diffusion times used for clinical DWI are 10–50 ms, corresponding to average molecular displacements of 10 μm; this microscopic size is in the same range as that of cellular dimensions. Consequently, changes in cellular processes can be detected from alterations in the diffusion patterns in several pathological settings, such as ischemia, edema and focal axonal shearing. This ability enables the DTI to characterize cellularity in brain tumours and non-invasively map long white matter connections in the CNS [8].
Role of DTI in Diagnosis of CSM
The availability of high-resolution MRI has increased the robustness of the diagnostic armamentarium of spine surgeons. Presently, MRI is considered the gold standard for the assessment of the spinal cord in both traumatic and non-traumatic myelopathies [1]. Parameters assessed in a standard spine MRI for CSM are the degree of compression and cord signal change [2]. However, it has been observed that the degree of cord compression does not always correlate with a patient’s neurologic status, nor does it reliably predict patients’ response to surgery. This incongruity in clinical vs. MRI features often makes clinical prognostication difficult.
Recently, diffusion tensor imaging (DTI), a special MRI technique that measures water molecules’ diffusion in tissues and quantifies the diffusion parameters, has been developed to study brain and spinal cord cellular architecture and function [12].
Thirty studies evaluated the role of DTI in the diagnosis of CSM (Table 1). In their works, Xiangshui et al., Jean-Francois et al., Lindberg et al., Gaos et al., Mostafa et al., and Rajasekaran et al. [13-18] demonstrated that FA and ADC differed between patients and healthy controls. The study by Xiangshui et al. [13] examined the severity of MRI findings of patients with no clinical correlation of symptoms. Even though they demonstrated that the patient arm had decreased FA, increased ADC and eigenvalue, application of this finding in clinical settings may be of limited value to the spine surgeon since decision-making is not made on imaging findings alone.
In early stages of disease, Kamel and colleagues were able to demonstrate a significant correlation between European myelopathy score and DTI parameters in patients with CSM. In their series of 40 patients, FA and ADC performed better in identifying grade 1 myelopathic patients than conventional MRI T2WI with Sensitivity vs specificity of FA: 73.5 vs 83.3% and ADC: 100% vs 70.6% respectively [19].
Jean-Francois and colleagues [14] showed that FA correlated with patients’ clinical symptoms, whereas T2 signal changes did not. Pavlov ratio (PR) correlated with FA and RD as demonstrated by Lindberg and colleagues, whereas space available for the cord did not, in their study of 15 patients and 10 case controls. They concluded that PR was a measure of spinal cord integrity, whereas SAC was not.
In a cohort of 104 patients, Gao et al. [16] showed a relationship between FA, ADC and mJOA. FA correlated directly with mJOA (r 0.883, p<0.05), while ADC correlated inversely with mJOA. Rajasekaran and his co-workers also showed a trend between DTI metrics and Nurrick score in their review of 35 patients and 40 controls, and the trend was more marked among non-ambulant patients.
Yoo et al. [20] showed that DTI metrics in the anterior and posterior parts of the spinal cord correlated with symptoms of paralysis and pain. Their study suggests a topographic correlation of the spinal cord DTI metrics. FA was reduced, and ADC increased significantly in the anterior part of the spinal cord in the paralysis group than in the pain/control groups.
Some studies have also questioned the role of DTI metrics as a diagnostic tool. Wen and associates [21] prospectively studied 15 patients with CSM and 25 healthy case controls. In their study, FA values were higher in the dorsal/ventral cord of healthy subjects compared to CSM patients (p<0.050). This was particularly observed in patients with SSEP abnormality. However, there was no correlation between FA levels and m JOA scores in the patient group.
|
Author |
Study type/ design |
DTI metrics |
Total N |
Key results |
Sensitivity/
specificity |
Conclusion/weakness |
|
|
Xiangshui M, et
al.(2010) |
Case-control (21
healthy, 81 CSM patients classified into mild, moderate and severe cord
changes on imaging) |
ADC,FA, E1,E2,E3 |
102 |
ADC, FA and Eigen vectors
differed b/w control and study groups |
N/A |
Eigen values, ADC,
and FA, differed between test groups and control.
Metrics could be useful in identifying structural changes
No clinical correlation was used in this study
Case-control, therefore weak evidence |
|
|
Jean-Francois et al
(2010) |
Case-control(15
healthy, 20 symptomatic) |
FA, MD,T2 signal
intensity |
35 |
FA +correlation with
clinical symptoms |
N/A |
FA correlated with
patients clinical score FA/MD at C2/3 did
not differ b/w patients and control MD changes not
significant T2 changes did not
correlate with FA/MD or clinical symptoms FA inversely related
to age |
|
|
Lindberg, PG et al (2011
|
Case-control 15-patients, 10 controls
|
FA, ADC,RD, AD Pavlov Ratio SAC |
25 |
FA reduced in all patients RD increased in
pts compared to control PR showed a correlation with FA SAC showed no
correlation with FA
|
N/A |
Assumption is mechanistic; structural
changes do not always lead to clinical symptoms. DTI metrics not related to the clinical
quantification of symptoms will have little clinical application Small sample size |
|
|
Gao SJ, et al (2013) |
Cohort of 104(53m, 51 f) Subjects classified with mJOA as mild, mode,
severe or serious |
FA, ADC, T1/2i, ^i |
104 |
FA correlated directly
withmJOA(r0.883,P<0.05) FA directly correlated with
severity(p<0.05) ADC inversely correlated with symptoms Eigen values(^i) correlated with signal
intensity |
N/A |
FA correlates with clinical symptoms (inverse
relationship). ADC has a direct relationship with symptoms FA differ among different mJOA
groups(p<0.05) |
|
|
Yoo WK, et al (2013) |
Prospective case-control study(15pts, 5
control) Pts were 2 groups- paralysis and Pain
groups. ROIs of the spinal cord are divided into 6-2
anterior, 2 posterior and 2 lateral 3T MRI |
FA, ADC, T2Wi |
20 |
FA ↓significantly in ant. ROI of affected
side in paralysis pts than pain and control ↑ ADC also in the ant ROI of the affected
side in pts than control DTI parameters in the posterior white matter
was unaffected |
N/A |
Symptoms sites matched with DTI parameter
changes in the cord segment This was marked in the paralysis group FA/ADC are biomarkers for cord injury
The affected tracts were not defined The study assumed that all the compression
came from the front Small sample size |
|
|
Rajasekaran S et al (2014) |
Case-control(35 patients and 40 controls) |
ADC, FA, E1, E2, E3 |
75 |
ADC and Eigenvalues increased with Nurrick
grade FA decreased with Nurrick's grade
|
N/A |
FA, ADC and Eigenvalues showed a trend with
various grades of CSM esp. non ambulant pts Small sample size Nurrick grading has limitations |
|
|
Banaszek A, et al (2014) |
Case-control(157-132 patients and 25
controls) 1.5T MRI A-control group B,C,D,E—groups with increasing severity of
CSM on imaging |
ADC, FA, APSCaD,
APSCod, SAC |
157 |
FA showed +correlation with APSCaD and
SAC(p<0.01) ADC showed -correlationwith
APSCaD(p<0.01) No correlation b/w AD and APSCoD No correlation b/w FA and APSCoD |
N/A |
FA is the most sensitive of the metrics APSCad and SAC index correlated with DTI
indices Grading CSM based on MRI appearance will
have limited clinical application since image does not always correlate with
symptoms |
|
|
Li X, et al. (2014) |
Case-control; 16 CSM patients, 47 healthy
control |
OE, wOE, ISIs, APCR |
29 |
OE-based DTI > sensitivity than anatomic MRI with equal specificity. OE-based DTI +MRI showed better sensitivity
than using them individually with the same specificity.
|
OE(80.77vs66.67%)
wOE(80.77vs100%)
ISIs(53.85%vs100%)
APCR(76.92%vs66.67%) |
OE-based DTI analysis can be a useful tool
to determine the pathological spinal cord levels in multilevel CSM |
|
|
Ellingson BM, et al (2014) |
Case-control 48 patients, 9 control |
FA, MD, AD, Ada, ψ |
57 |
FA high in normal/mild symptom subject FA directly related to mJOA score(R=0.414,
p<0.001) MD/AD showed no relationship with mJOA Ψ showed a relationship with mJOA |
FA<0.55
72%vs75%for mJOA<18
82%vs92% for mJOA <15)
|
FA correlates with mJOA AD/MD does not correlate with
mJOA However, ψ correlates with mJOA Average ψ, RD, and SD were not significant predictors of symptomatic
patients (mJOA<18)
|
|
|
Wen CY, et al (2014) |
Prospective case control study 40(25 healthy, 15 CSM patients) |
FA, AD, RD SEP |
40 |
FA values were higher in the dorsal/ventral
cord of healthy subjects compared to CSM patients(p<0.05) FA were lower especially in those with SEP
abnormality |
N/A |
FA values higher in healthy subjects
(P<0.05) and were region specific(decreased in dorsal and lateral columns
of the spinal cord) FA values decreased in CSM patients with SEP
abnormality. No correlation between FA levels and mJOA
scores AD/RD values were increased in patients in
ALL regions of the cord. Small sample size |
|
|
Lee S, et al. (2015)
|
64 pts (29 no CSM, 4 with CSM but no T2Wi changes) 31 normal subjects
|
FA, MD, LD, RD |
33 |
FA correlated negatively with
stenosis(p<0.001) RD positively correlated with
stenosis(p<0.001) MD/LD did not correlate. The combination of indices improved
diagnostic performance. |
FA+LD( 100%vs68.9%)
FA+MD(100%vs58%)
RD+FA(75%vs68.9%) |
LD+FA showed the best specificity and the best sensitivity, Small sample size(4 in CSM group) No quantitative clinical classification of
CSM Retrospective nature of study |
|
|
Ahmadli et al. (2015) |
Prospective Cohort of 18 CSM without T2Wi
changes (8f,10m) |
FA/ADC |
18 |
ADC correlated with canal diameter at
prestenotic level(p=0.03) FA was reduced at stenotic level FA/ADC at stenotic level did not differ from
post stenotic level |
N/A |
ADC/FA are early biomarkers of CSM before
T2Wi signal changes appear Subjects were not followed up to establish
relationship b/w finding and disease progression Small sample size
|
|
|
Chagawa K, et al (2015) |
A cohort study of 31 normal subjects
(18f,13m) to determine normal values |
FA/ADC |
31 |
FA—0.68+-0.05 ADC—1.06+-0.09 FA did not differ among age groups ADC/FA did not differ b/w sexes ADC increased with age FA/ADC had negative correlation
|
N/A |
Normal FA values were reproducible ADC increased with age Small study size Cut-off value not derived
|
|
|
Cui JL, et al (2015) |
Case-control (23 CSM,20 control) Study of column-specific cord degeneration |
FA, MD, AD, RD |
43 |
FA was reduced in lat./posterior columns and
corresponded to pts symptoms MD, AD, and RD were increased in all columns |
N/A |
FA, MD,AD, RD values correlated with CSM FA values were column-specific Age variation b/w control and patients is a
confounder Small sample size |
|
|
Ellingson BM et al (2015) |
A cohort study of 27 spondylosis patients
(21 with symptoms, 6 without symptoms) Quantification of tractography parameters
NOT DTI scalar indices |
FTD FTR |
27 |
FTD and FTR inversely correlated with mJOA FTD increase with T2i may suggest a better
prognosis |
FTD>1.45(82%sensitivity,70%specificity)
FTR>1.4(83%sensitivity, 62% |
FTD/FTR inversely correlated with mJOA Scalar metrics were not studied Reduced clinical applicability Small sample size |
|
|
Ying J et al. (2016) |
Case-control (32 patients with CSM,21
healthy volunteers) |
FA, ADC |
53 |
FA differed significantly b/w patients and
control FA correlated strongly with mJOA(P=0.003) FA performed better than the level of cord
compression ADC did not significantly correlate with
mJOA |
N/A |
Small size
|
|
|
Maki S, et al (2016) |
Case-control (20 CSM, 10 control) rFOV study
with 3T MRI |
FA |
30 |
FA was reduced in lateral columns of pts vs
control(0.59v 0.71 p=0.01), FA reduced in post. Column of pt vs
control(0.58vs0.72 p<0.01) FA in LC/PC correlated moderately with JOA
but correlated strongly with JOA Lower extremity score(p<0.01) |
N/A |
FA correlated strongly with JOA Posterior
Column/Lateral Column lower extremity scores using rFOV.
Small size
Wide age disparity
|
|
|
Toktas ZO, et al. (2016) |
Prospective cohort 21 CSM without T2Wi |
FA, ADC in stenotic vs. stenotic segments of
the cord |
21 |
FA was decreased in most stenotic levels
(0.423 vs 0.688 p=0.001) ADC was increased in most stenotic levels
1.313vs 0.918 p=0.001 Negative correlation
b/w FA/ADC |
N/A |
Small size No follow-up to determine if these early
cases developed CSM No follow-up to correlate post-surgery DTI
values with pre-surgery values |
|
|
Yang YM, et al (2017) |
A prospective cohort of 20 cervical
myelopathy patients |
FA, ADC |
20 |
Mild CM showed a higher mean FA below the
lesion level [+0.0542 (95% CI)] than the moderate-to-severe CM (p =0.022). FA values correlated well with the mJOA
score (p =0.034,r = 0.475) below the lesion level (C7/ T1). |
FA
values on DTI showed 100% sensitivity to CM |
FA values below the lesion correlated with
mJOA, DTI could provide more understanding of the pathological changes
matched with clinical findings in CM patients than conventional MRI. Small
sample size. There could be a bias in studying mostly mild and moderate
patients according to the mJOA score. |
|
|
Choe AS, et al (2017) |
Prospective cohort on 18 chronic spinal cord
injured (SCI) patients |
FA, AD, RD |
18 |
DTI indices obtained from the region
inferior to the injury epicenter (IRRI) showed the highest specificity to
impairment |
N/A |
Small size of the cohort, RD is more
sensitive to age, Varying injury level in SCI patients, Higher Tesla MRI (3T)
increases chemical shift, susceptibility, as well as DTI-derived indices and
flow/motion artifacts are enhanced, fitting method in CATNAP software might
not have been optimized and specific to impairment |
|
|
Kervovsky M, et al (2017) |
Prospective case-control study-201 subjects
(130 with degenerative c-spine dz and 71 controls |
FA, ADC at different cervical levels
compared with sex and age |
201 |
FA correlated negatively with age in DCC
group. ADC/FA showed significant correlation b/w
symptomatic and asymptomatic groups. ADC influenced by sex in control and pts FA correlated positively with canal diameter |
N/A |
Threshold values for FA and ADC not stated
|
|
|
Murphy RK, et al (2018) |
Prospective cohort (14pts and 7 control) |
DBSI/FA, DTI/FA and clinical quantitative
measures e.g. 30m walking test |
21 |
30m walking test-longer in CSM pts vs
control 9-Hole peg test- longer Grip strength, not diff Keypinch—not different Vibration sense- lower |
N/A |
DTI-FA associated strongly with 30m walking
and 9-hole peg test DBSI-FA associated strongly with 30m walking
and 9-hole peg test Small sample size Reproducibility in clinical setting |
|
|
Tykocki T et al (2018) |
Prospective cohort Study (10 pts with early CSM) |
FA, ADC, RD, AD TRACEW in flexion and
extension position |
10 |
In Flexion-↑ TRACEW In Extension-↑ADC (p=0.001) ↑ RD at all levels ↓FA. P=0.001 C2 to CL ↓TRACEW C2-C7 |
N/A |
All diffusion parameters were exacerbated in
extension DTI making it potentially useful for early diagnosis Small sample size Study subjects were used as control Nurrick grading of DTI has limitation |
|
|
Nukala M, et al (2018) |
Prospective cohort (50pts with CSM) graded
with EMS |
FA, ADC, T2Wi |
50 |
FA/ADC revealed significant diff at stenotic
vs non-stenotic levels T2Wi was only significant in moderate/severe
EMS pts |
FA-79%
sensitivity
ADC-71%sensitivity
T2Wi-50%sensitivity |
Assumes that abnormality is limited to
stenotic levels No follow-up to ascertain that these changes
in the metrics were clinically significant. |
|
|
Dong F, et al (2018) |
A preliminary case-control study on 50
normal subjects and 60 cases of CSM with 3.0-T MR |
FA, ADC |
110 |
Significant differences in FA and ADC
between normal and CSM (ADC: 1.119 ± 0.087 vs. 1.395 ± 0.091, P < 0.01;
FA: 0.661 ± 0.057 vs. 0.420 ± 0.080, P < 0.01). FA values are
significantly associated with mJOA. However, the FA values were significantly
negatively associated with the Nurick grade. |
N/A |
The FA value of the spinal cord was
associated with post-operative recovery of spinal cord function. DTI
colormaps of spinal cord in patients with CSM can reflect compression and
functional status of spinal cord. DTI may play a significant role in diagnosing
and predicting the development of CSM. Small sample size. |
|
|
Bhosale S, et al (2019) |
Prospective cohort study(30 CSM pts)
correlating pre-op FA/ADC with post-op mJOA 1.5T |
FA, ADC
|
30 |
Pre-op FA/ADC correlated with mJOA Postop mJOA predicted with the equation; mJOA=9.77+12.1(FA) mJOA=14.2+2408.4(ADC) mJOA=9.54+11.2(FA)+1575.5(ADC) |
FA(PPV)=66.7% ADC(PPV)=28.7% |
Showed significant correlation b/w FA/ADC
and post-op mJOA No cut-off threshold for these parameters
was established Small sample size PPV is low |
|
|
Cui L, et al (2019) |
Prospective case-control (40pts with CSM, 42
control) 1.5T DTI metrics at cervical and conus and mJOA
scores pre/post-op |
ADC/FA |
82 |
FA ↓in pts at both cervical and conus
compared to control ADC↑in cervical cord and conus of both
patients and control FA of cervical cord correlated with conus in
pts FA of pts at cervical correlated with conus |
N/A |
Lumbosacral FA could be used to assess
cervical cord function post-surgery This would be important when implants are
used The correlation is premised on ecovern
degeneration and may not apply to mild and moderate CSM . 1.5 T limits the quality of metrics |
|
|
Mostafa,
et al(2023) |
Prospective case-control(60 pts with CSM,30
contol) 1.5T DTI metrics at disc level C2-C6/7 |
FA, ADC, FT |
90 |
FA/ADC
had higher sensitivity (97.0% and 88.1%, respectively) than conventional T2
WIs (13.4%) and fibre tractography (10%) for the detection of early
compressive myelopathy with cutoff values ≤ 0.56 and > 1.23, respectively,
in differentiating between patients and control groups. |
Sensitivity:FA/ADC 97%/88.1 Sensitivity T2Wi/FT(13.4%/10%) |
FA
and ADC are valuable tools for quantitative assessment of degenerative
cervical spondylotic
myelopathy in addition to routine cervical spine magnetic resonance. |
|
Table 1: The use of DTI in Metrics in the diagnosis of CSM.
Role of DTI in Predicting the post-operative outcome of CSM
Ten studies assessed the usefulness of DTI in predicting response to surgery in patients with CSM (Table 2). This is perhaps the most important potential use of DTI metrics in clinical settings. Unfortunately, the results here have been inconsistent. Rajasekaran et al. [18] showed that DTI metrics had a significant relationship with Nurrick grading. Fractional Anisotropy and ADC improved in patients who improved clinically and worsened in patients who worsened clinically. The sensitivity and the specificity of these indices were not measured, and the heterogeneity of the study population and the small sample size were some limitations of their work.
Schen and colleagues [22] prospectively studied the recovery rate of 142 patients using mJOA. In their work, FA and ADC correlated with the post-operative outcome, with FA having sensitivity/ specificity of 60.38%/75.28%, while ADC had 74.47%vs59.55%. FA was a significant independent predictor of poor outcome at cutoff=0.390. The value of ADC did not reach statistical significance in predicting the outcome.
Inter-observer reliability is a limitation that should be considered when interpreting the results of DTI images. In a study by Lee et al., diffusion tensor imaging (DTI) in cervical spondylotic myelopathy (CSM) was evaluated for test-retest and inter-observer reliability as well as agreement between measurement techniques [23]. The study discovered that inter-observer agreements ranged from poor to outstanding agreements and depended on the spinal cord level and the measuring techniques utilized. Although inter-observer agreements ranged from poor to good, the radiology resident and neuroradiologist group demonstrated high test-retest reliability at practically every spinal cord level [23]. The ROI measurements had high test-retest reliability, whereas FA assessments in patients with CSM differed greatly in terms of inter-observer reliability. DTI parameter data should be carefully understood when used in clinical settings as a result [23].
Given that most surgical strategies are aimed at the levels of pathological compression. It becomes intuitive to assume that a quantitative measurement of cord function at such levels may be of great prognostic value. Yang and colleagues [24] studied 20 patients with mild and moderate CSM and 20 controls by measuring FA, AD and MD at the level of maximum cord compression and C7-T1 levels preoperatively and post-operatively. In their series, FA was reduced at LMC and at C7/T1 levels. FA improved after surgery at LMC and C7/T1 and correlated with post-operative mJOA score.
Similarly, Tian et al investigated the correlation between preoperative DTI, MRI and post-operative outcome using the JOA score. In their cohort of 95 patients who underwent surgery for CSM, the pre-operative FA values of patients in the ‘good recovery’ group was significantly higher while the AD and VD values were significantly lower when compared to the ‘poor recovery’ group [25].
On the contrary, Kitamura et al. [26] demonstrated that using FA as a longitudinal imaging biomarker was difficult in the clinical setting. They showed that pre-operative FA/MD values moderately correlated with pre-operative mJOA scores, but FA/MD values did not change following surgery despite the change in clinical status.
Using a 3T zoomed DTI in 28 subjects, Iwasaki and co-workers [27] studied FA in patients, pre-op, 1 week, 6 months and 1-year post-surgery. They had 2 groups of patients: those with intracordal high-intensity signals and those without. FA of patients with intracordal high intensity significantly reduced after surgery and significantly increased at one week to 6 months. Those patients without intracordal high intensity did not have a significant change in their FA. Clinically, JOA scores at 6 months after surgery (13.1) improved significantly compared with JOA scores before surgery (10.8). They concluded that only FA values one week after surgery had a significant positive relationship with pre-op mJOA and 6 months after surgery.
According to them, the postsurgical FA value approximates the proper state of the damaged cord, whereas the presurgical FA value was a ‘masked effect’ due to the aligned fiber effect of compression by the degenerative process.
In developing a prognostic model, Severino et al. [28] retrospectively studied a group of 36 patients with CSM. They grouped the patients into ‘best responders’ and normal responders using mJOA improvement after surgery. FA in the best responder group was significantly higher than in the normal group. Patients with FA> 0.55 had better outcomes.
Six studies which addressed the utility of DTI metrics in diagnosis and prognosis in CSM were reviewed. Lee et al. [20] in their study of 40 subjects (20 patients and 20 controls), did not find any correlation between FA and myelopathy score even though FA was lower in patients and ADC was higher when compared with controls. They also did not find it a useful predictive tool after surgery.
According to Jones and associates, FA correlated with baseline mJOA and Nurrick scores and predicted functional recovery following surgery using NDI, p<0.04 [29,30].
Zheng et al. [31] showed that diffusion metrics like AD, ADC, MD, and RD all had a strong correlation with recovery rate. However, no metric showed a significant correlation with the mJOA score. Also, post-operative values were not derived from comparing with the pre-operative values.
|
Author |
Study type/ design |
DTI metrics |
No |
Key results |
Sensitivity/ sensitivity |
Conclusion |
|
Rajasekaran S et al. (2017) |
A prospective cohort of 35 CSM patients |
FA,ADC,RA,VR, E1, E2,
E3 |
35 |
Pre-op DT unable to predict response DTI showed a significant relationship with
Nurrick's grade ADC of improved patients also improved DTI of patients who worsened also worsened |
N/A |
Small sample Heterogeneity in study population (age, sex,
level of disease and type of surgery) The duration of the study may be
insufficient
|
|
Guan L, et al. (2017) |
A preliminary follow-up study |
FA, AD, RD and MD |
7 |
DTI's FA and RD showed significant
differences post‐surgery (FA, p = 0.026; RD, p = 0.048), consistent with
neurological assessments. T2W images did not show significant changes
pre- and post-surgery. Multi‐shot DWI performed better in diagnosis and
recovery monitoring for patients with CSM than T2W. |
N/A |
DTI metrics may serve as a sensitive
biomarker for potential CSM management. Small sample size Limited SNR and acquisition time hinder the
resolution from reaching an optimal scale A dedicated RF coil and higher magnetic
fields are necessary. |
|
Shen C et al. (2018) |
prospective, consecutive cohort study among
142 patients undergoing surgical treatment for DCM |
ADC, FA |
142 |
Area under Receiver operating characteristic
(ROC) curves were largest for FA (0.750), followed by ADC (0.719).
Multivariate logistic regression model revealed that JOA score ≤ 8 points, TA
≤ 46.02 mm2, and FA ≤ 0.390 were independently associated with poor surgical
outcomes. |
FA sensitivity = 60.38%, specificity =
75.28%; ADC (× 10−3 mm2/s) sensitivity = 75.47%; specificity = 59.55% |
JOA score is a reasonable predictor of
outcome. Limitations: possibility of bias in drawing ROIs manually, ROI uses
for DTI analysis did not distinguish grey from white matter, only the most
compressed level was used for analysis, Quantitative analysis of DTI was not
done on healthy controls, small sample size |
|
Ma X, et al (2018) |
A retrospective cohort study (58
post-operative DCM pts, 14 healthy controls) |
FA, AD, RD, MD |
72 |
FA, RD, and MD in patients were
significantly correlated with mJOA, For NODDI metrics, neurite density was
correlated with mJOA |
N/A |
a prospective study is needed to test the
value of the metrics in predicting surgical outcomes; small sample size |
|
Yang YM, et al (2018) |
longitudinal study (30 pts with CM and 20
healthy controls) |
FA, AD, RD, MD |
50 |
Post-operative anterior FA value below the
lesion level was positively correlated with the mJOA score |
N/A |
Severe compression makes it difficult to
precisely spot the region of interest. Surgery increases tissue edema makes
finding the lesion more difficult, mJOA does not assess sensory function. |
|
Kitamura et al (2019) |
Prospective cohort (15 pts) 3T MRI used |
FA, MD |
15 |
FA/MD did not change from pre-op
values despite the clinical change. Pre-op. FA/MD value moderately
correlated with the pre-op. JOA score. Pre-op. FA/MD value moderately
correlated with the post-op. outcomes after 1 year |
N/A |
It is difficult to use FA value as a
longitudinal imaging biomarker FA is a pre-op predictor of neurological
recovery after surgery. |
|
Iwasaki M, et al. (2019) |
Prospective cohort (28pts) With 3T Zoomed DTI and JOA pre/post surgery |
FA pre-op FA at 1 wk FA at 6months FA at 1yr |
28 |
FA values in CSM pts didn't differ from
normal subjects FA values pre and 6 months post-op didn't
differ FA decreased at 1 wk post-op, especially in
T2Wi pts Only FA at 1 wk pos-top correlates with JOA
|
N/A |
The study suggests that no actual fibre
damage occurs in CSM apart from compression; autopsy results have
demonstrated ischemic and Wallerian changes in CSM 'Aligned fibre effect' is a new concept Small sample size |
|
Schatlo B, et al (2019) |
Prospective two-step feasibility study (11
pts and 16 healthy subjects) |
ADC and FA |
27 |
extension produced higher ADC in the
diseased than in the control segments (p = 0.0045). FA was
significantly lower in extension (p = 0.0154) and (p = 0.0187) |
N/A |
Showed feasibility of flexion and extension
DTI with a conventional head and neck coil. A marked increase in ADC values
in extension. A longitudinal design with a larger sample size are required. |
|
Severino R, et al (2020) |
Retrospective cohort (36pts) using DTI from
3T, Pts grouped as best responders vs normal
responders |
FA mJOA, MEPs, SSEPs |
36 |
FA in best responders was significantly
higher than in normal responders FA>0.55= better outcome ↑FA preop=↑FA post-op FA was ↓ at most stenotic levels in both
study groups FA at the most stenotic level directly
correlated with outcomes in both groups |
N/A |
↑ pre-op FA = good recovery FA correlated with pre and post-op mJOA ↑Pre-op MEPs correlated with good outcome Small study size Retrospective |
|
Table 2: The use of DTI Metrics in Predicting Response to Surgery.
DTI Parameters used for the diagnosis and post-operative follow-up of CSM
Certain measurable DTI indices (diffusion metrics) have been developed and have become tools for various clinical studies on the utility of DTI in the management of patients with CSM.
Fractional anisotropy (FA) is one of the most widely used DTI parameters. FA measures the coherent directionality of the movement of water molecules along the longitudinal axes of the long white matter axon bundles. It is assumed that the longitudinal arrangement of the long axons (long and tubular) that comprise the white matter tracts and their unsheathing myelin is responsible for this unidirectional diffusion of water molecules (anisotropy) [32]. Studies have shown that FA values correlate with CSM severity and prognosis. Jones and colleagues performed a prospective study on 30 patients with CSM investigating the correlation between the clinical severity of CSM and FA values at the time of diagnosis [30].
The study demonstrated that improvement in NDI score was associated with higher FA values. Moreover, a disproportionately high FA in patients with severe CSM was associated with higher mJOA scores after surgery when compared to patients with lower FA values [30]. In another longitudinal study using mJOA as a measure of functional status, Rao and colleagues showed that FA could be used as a valid biomarker for CSM severity and postoperative prognosis [33]. Another DTI parameter that has shown promise as a measure of severity and outcome of SCM is the apparent diffusion coefficient (ADC), which appears to indicate the severity of spinal cord compression and clinical recovery after decompression surgery [34]. ADC reflects the rate of water molecule diffusion within a tissue irrespective of directional dependence [35]. It is influenced by tissue viscosity, membrane permeability, and structural directionality. ADC increases when there is damage to the tissue microvasculature, edema, neuronal loss, or cystic degeneration of the spinal cord. These changes reduce the resistance to water diffusion and increase the extracellular space [34]. Several studies have shown that ADC values can indicate the degree of spinal cord compression and clinical recovery after decompression surgery in patients with CSM. A study by Kervovsky et al. [6] compared ADC values between patients with spondylotic myelopathy and healthy controls. They found that ADC values were significantly higher in patients than in controls and correlated with the degree of spinal cord compression and clinical disability. Another study by Sato et al. [34] showed a significant positive correlation between the ADC value and the degree of spinal cord compression and a negative correlation with time after decompression surgery. Higher ADC values were associated with lower pre-operative JOA scores and poorer clinical recovery [34]. Axial diffusivity (AD), radial diffusivity (RD) and Mean diffusivity (MD) are other parameters in DTI that are used in the diagnosis and follow-up of cervical spondylotic myelopathy [36]. In a prospective longitudinal study using mJOA as a functional measure, Wen and colleagues showed that FA, MD and RD were superior to T2 signal intensity in predicting post-operative functional recovery [21].
|
Author |
Study design |
Metrics |
No |
Key results |
Sensitivity/specificity |
Conclusion |
|
Lee JN, et al. (2011) |
Case control 20 normal 20 patients |
FA, ADC, tractography pattern, t2 signal |
40 |
FA was significantly lower in patients, ADC
was higher in patients, FA/ADC were better than T2 signal changes |
N/A |
FA did not correlate with myelopathic score FA did not predict clinical response to
surgery Small sample size Case-control |
|
Jones JG et al. 2013 |
Cohort 15-nonsurgical 15- surgical patients |
FA DCSA T2I |
30 |
FA correlated with mJOA(r0.62, p<0.01) FA correlated with NDI (r-0.61, p<0.04)
|
N/A |
FA correlated with baseline mJOA and Nurrick
scores. This reached significance at C2/3 FA did not correlate with initial
patient-reported scores FA predicted functional recovery following
surgery using NDI(p<0.4) FA threshold of 0.62 correlated with symptom
severity T2i did not correlate with post-op outcome |
|
Vedantam A, et al (2013) |
Observational 25 healthy subjects (12 men and 13 women; age range, 22–85
years) |
FA, MD, transverse and longitudinalADC (tADC,
lADC) |
25 |
FA shows inverse correlation with age in
upper and middle cervical SC, rapid decrease after age 55, no difference
between genders, signal-to-noise ratio lower in middle and lower cervical SC |
N/A |
In neurologically intact individuals, tADC,
MD and FA differ between white and grey matter and individual white matter
funiculi across all levels of the cervical spinal cord. FA is sensitive to
age change. When studying SC pathology using DTI, variations in metrics due
to age and signal quality should be considered. |
|
Wang KY et al.(2017) |
Case-control (8 pts, 5 control) Tract-specific DTI study before and after
surgery |
FA, MD |
13 |
FA was lower in patients /MD
higher in pts in the lateral and posterior ROI FA/MD not different in anterior ROI |
N/A |
DTI metrics across the entire cord rather
than LMC are recommended FA/MD difference b/w patients and control
disappeared six months after surgery Region-specific metrics are more reliable Small sample size Changes in DTI metrics post-surgery weren't
shown to translate to clinical improvement |
|
Rao A, et al. (2018) |
Prospective case-control (42pts, 24,
controls) Compared FA at LMC and post-op outcome |
FA |
66 |
FA reduced in pts vs control FA at LMC correlates with pre-op mJOA but
not with post-op mJOA ↓pre-op FA =↑change in mJOA Pre-op FA<0.55 =↑change in mJOA |
N/A |
FA correlated with clinical state and
outcome Pre-op FA showed an inverse relationship
with the rate of recovery 1.5T scanner
|
Table 3: The use of DTI for both diagnosis and prognosis.
Discussion
Although there appears to be a strong suggestion that DTI metrics such as FA, ADC, and MD correlated with clinical features and response to surgery, some studies queried this observation. For example, Kitamura et al. [26] concluded that it was challenging to use FA as a longitudinal imaging biomarker in a clinical setting since FA/MD values did not change following surgery despite the change in the clinical status of their patient cohort. Mamata and his colleagues showed that almost 50% of the patients with CSM had neither elevated ADC nor reduced FA at cord compression levels. Nevertheless, they found an increased ADC and a decreased FA with age in the spinal cord [37].
The nature of the studies presented here has highlighted some limitations with the use of DTI in the management of patients with CSM. The cross-sectional area of the spinal cord and the differences in magnetic susceptibility of the surrounding tissues are sources of artefactual contamination during image acquisition [38].
The area of the spinal cord in cross-section is about the minimum voxel size commonly used for DTI, and a sub-optimal voxel size can cause a significant reduction in signal-to-noise ratio, leading to inaccurate results [39]. DTI acquisition is sensitive to patient or structural movement such as cardiac pulsation and respiration. Cardiac gating, specialized radiofrequency coils, and MR signal suppression bands are frequently used to enhance the quality of DTI in the spinal cord. The diffusion hypothesis upon which DTI is based assumes that diffusion within the spinal cord follows a perfect ‘bell type’ Gaussian distribution. In reality, however, like most biological tissues, the spinal cord often shows a non-Gaussian diffusion pattern [40].
Only five studies evaluated the sensitivity and specificity of DTI metrics (Table 3). FA showed a sensitivity range of 60-100% and a specificity of 70-75.28% [41-43]. This lower specificity has clinical implications in the interpretation of results. For example, decreased FA may be caused by reduced neuron density or increased neuron orientation dispersion, representing different microstructural changes within the cord. While microstructural characteristics are valuable in understanding the pathological basis of CSM, it is difficult to deduce from DTI, as the diffusion property of each voxel in the DTI model is characterized by a single tensor. More advanced diffusion models have been proposed to address this limitation, capable of revealing microstructural information. One of these models is the neurite orientation dispersion and density imaging (NODDI) [44]. This imaging modality is based on the fact that changes in neuronal structure and orientation can alter the exchange of information among neurons and therefore directly impact their function [45].
Most DTI protocols consist of manual settings of the Region of Interest, which has raised concerns about its reliability and accuracy. When DTI indices are averaged over large regions of interest in CSM patients with multilevel disease, subject-specific information may be lost [39] For this reason, analytical techniques confer a higher risk of bias if they involve manual processes (e.g. ROI selection) without blinding or liberal statistical assumptions. Finally, the lack of standardization of the DTI metrics acquisition protocol and cut-off values could be responsible for the mixed results in some of the studies.
Conclusion
DTI provides sensitive detection of microstructural spinal cord injury and offers encouraging, though inconsistent, prognostic information in CSM. Despite its promise, widespread clinical adoption is limited by technical constraints, model assumptions, and lack of standardized imaging protocols. Future research must prioritize large, multicenter studies employing harmonized acquisition strategies, automated segmentation tools, and advanced diffusion models such as NODDI and multicompartment biophysical modeling. Establishing reliable cutoff thresholds, integrating DTI into clinical scoring systems, and validating its longitudinal utility will be essential for translating DTI from a research modality into a robust clinical instrument for managing CSM.
Author Contribution Statement
Designed research: U.A, A.A, D.P
Performed research: U.A, A.A, D.P
Analyzed data: U.A, A.A, D.P, U.A.K
Data acquisition: U.A, A.A, D.P
Writing original draft: U.A
Review & editing: U.A, A.A, D.P, U.A.K
All authors have read and agreed to the published version of the manuscript.
Ethics Approval Statement
Not applicable for this review article
Acknowledgements
We would like to acknowledge Mr Nwalewachi, Livingson Chibike who helped proofread the manuscript and prepared it for submission.
Funding: No external funding was required for this research
Data Availability Statement: Data generated during this study are available from the corresponding author on reasonable request.
Conflict of Interest Statement: The authors declare no conflict of interest.
References
- Wang MC, Kreuter W, Wolfla CE, Maiman DJ, Deyo RA (2009) Trends and variations in cervical spine surgery in theUnited States: Medicare beneficiaries, 1992 to 2005. Spine 34(9): 955-61.
- Rowland LP (1992) Surgical treatment ofcervical spondylotic myelopathy: time for a controlled trial. Neurology 42(1): 5-13.
- Teresi LM, Lufkin RB, Reicher MA, Moffit BJ, Vinuela FV, et al. (1987) Asymptomatic degenerative disk disease and spondylosis of the cervica spine: MR imaging. Radiology 164(1): 83-88
- Boden SD, McCowin PR, Davis DO, Dina TS, Mark AS, et al. (1990) Abnormal magnetic-resonance scans of the cervical spine in asymptomatic subjects. A prospective investigation. J Bone Joint Surg Am 72(8):1178-1184.
- Kato F, Yukawa Y, Suda K, Yamagata M, Uetaet T (2012) Normal morphology, age-related changes and abnormal findings of the cervical spine. Part II: magnetic resonance imaging of over 1,200 asymptomatic subjects. Eur Spine J 21(8): 1499-1507.
- Kerkovský M, Bednarík J, Dušek L, Pukova AS, Mechl M, et al. (1212) Magnetic resonance diffusion tensor imaging in patients with cervical spondylotic spinal cord compression: correlations between clinical andelectrophysiological findings. Spine 37(1): 48-56.
- Lee MJ, Cassinelli EH, Riew KD (2007) Prevalence of cervical spine stenosis. Anatomic study in cadavers. J Bone Joint Surg Am 89(2) :376-380.
- Martin AR, Leener BD, Adab JC, Ginsberg H, Fehlings MG, et al. (2018) Can microstructural MRI detect subclinical tissue injury in subjects with asymptomatic cervical spinal cord compression? A prospective cohort study. 8(4): e019809.
- Nouri A, Tetreault L, Zamorano JJ, Yee A, Fehlings MG, et al. (2015) Role of magnetic resonance imaging in predicting surgical outcome in patients with cervical spondylotic myelopathy. Spine 40(3): 171-178.
- 10. Nouri A, Martin AR, Kato S, Kermani HM, Riehm LE, et al. (2017) The relationship between MRI signal intensity changes, clinical presentation, and surgical outcome in degenerative cervical myelopathy: analysis of a global cohort. Spine 42(24): 1851-1858.
- Tetreault LA, Kopjar B, Vaccaro A, Massicotte EM, Fehlings MG, et al. (2013) A clinical prediction model to determine outcomes in patients with cervical spondylotic myelopathy undergoing surgical treatment: data from the prospective, multi-center AOSpine North America study. J Bone Joint Surg Am 95(18): 1659-1666.
- Baker LM, Cabeen RP, Cooley S, Laidlaw DH, Paul RH (2016) Application of a novel quantitative tractography-based analysis of diffusion tensor imaging to examine fiber bundle length in human cerebral white matter. Technol Innov 18(1): 21-29.
- Xiangshui M, Xiangjun C, Xiaoming Z, Qingshi Z, Yi C, et al. (2010) 3 T magnetic resonance diffusion tensor imaging and fibre tracking in cervical myelopathy. Clinical Radiology 65(6): 465-473.
- Budzik JF, Balbi V, Le Thuc V, Duhamel A, Assaker R, et al. (2011) Diffusion tensor imaging and fibre tracking in cervical spondylotic myelopathy. Eur Radiol 21(2): 426-33.
- Lindberg P, Sanchez K, Ozcan F, Rannou F, Poiraudeau S, et al. (2016) Correlation of force control with regional spinal DTI in patients with cervical spondylosis without signs of spinal cord injury on conventional MRI. European Radiology 26(3): 733-742.
- Gao S, Yuan X, Jiang X, Liu X, Wang Y, et al. (2013) Correlation study of 3T-MR-DTI measurements and clinical symptoms of cervical spondylotic myelopathy. European Journal of Radiology 82(11): 19401945.
- Mostafa NSAA, Hasanin OAM, Al Moqbel EAHY, Nagy HA (2023) Diagnostic value of magnetic resonance diffusion tensor imaging in evaluation of cervical spondylotic myelopathy. Egyptian Journal of Radiology and Nuclear Medicine 54(175): 1-13.
- Rajasekaran S, Yerramshetty JS, Chittode VS, Kanna RM, Balamurali G, et al. (2014) The assessment of neuronal status in normal and cervical spondylotic myelopathy using diffusion tensor imaging. Spine 39(15): 1183-1189.
- Kamel O, Ismail A, shinnawy M, Elwan S, Elshimy A (2023) Role of MRI Diffusion Tensor Imaging in early diagnosis of Cervical Spondylotic Myelopathy (CSM). Ain Shams Medical Journal 74(4): 999-1011.
- Yoo WK, Kim TH, Hai DM, Sundaram S, Yang YM, et al. (2013) Correlation of magnetic resonance diffusion tensor imaging and clinical findings of cervical myelopathy. Spine J 13(8): 867-876.
- Wen CY, Cui JL, Mak KC, Luk KD, Hu Y (2014) Diffusion tensor imaging of somatosensory tract in cervical spondylotic myelopathy and its link with electrophysiological evaluation. Spine J 14(8):1493-1500.
- Shen C, Xu H, Xu B, Zhang X, Li X, et al. (2018) Value of conventional MRI and diffusion tensor imaging parameters in predicting surgical outcome in patients with degenerative cervical myelopathy. J Back Musculoskelet Rehabil 31(3): 525-532.
- Lee E, Lee JW, Bae YJ, Kim HJ, Kang Y, et al. (2020) Reliability of pre-operative diffusion tensor imaging parameter measurements of the cervical spine in patients with cervical spondylotic myelopathy. Sci Rep 10(1): 17410.
- Yang YM, Yoo WK, Bashir S, Oh JK, Kwak YH, et al. (2018) Spinal Cord Changes After Laminoplasty in Cervical Compressive Myelopathy: A Diffusion Tensor Imaging Study. Front Neurol 9: 696.
- Tian X, Zhang L, Zhang X, Meng L, Li X (2021) Correlations between preoperative diffusion tensor imaging and surgical outcome in patients with cervical spondylotic myelopathy. American Journal of Translational Research 13(10): 11461-11471.
- Kitamura M, Maki S, Koda M, Furuya T, Iijima Y, et al. (2020) Longitudinal diffusion tensor imaging of atients with degenerative cervical myelopathy following decompression surgery. J Clin Neurosci 74: 194 198.
- Iwasaki M, Yokohama T, Oura D, Furuya S, Niiya Y, et al. (2019) Decreased Value of Highly Accurate actional Anisotropy Using 3-Tesla ZOOM Diffusion Tensor Imaging After Decompressive Surgery in Patients with Cervical Spondylotic Myelopathy: Aligned Fibers Effect. World Neurosurg X 4: 100056.
- Severino R, Nouri A, Tessitore E (2020) Degenerative Cervical Myelopathy: How to Identify the Best Responders to Surgery. J Clin Med 9(3): 759.
- Lee S, Lee YH, Chung TS, Jeong EK, Kim S, Yoo YH, et al. (2015) Accuracy of Diffusion Tensor Imaging for Diagnosing Cervical Spondylotic Myelopathy in Patients Showing Spinal Cord Compression. Korean J Radiol 16(6): 1303-1312.
- Jones JG, Cen SY, Lebel RM, Hsieh PC, Law M (2013) Diffusion tensor imaging correlates with the clinical assessment of disease severity in cervical spondylotic myelopathy and predicts outcome following surgery. AJNR Am J Neuroradiol 34(2): 471-478.
- Zheng W, Chen H, Wang N, Liang Y, Xiao W, Xiong W, et al. (2018) Application of Diffusion Tensor Imaging Cutoff Value to Evaluate the Severity and Postoperative Neurologic Recovery of Cervical Spondylotic Myelopathy. World Neurosurg 118: e849-e855.
- Martin AR (2017) Multiparametric Quantitative MRI of the Cervical Spinal Cord to Measure Microstructure and Tissue Injury: Development, Validation, and Applications of a Clinically Feasible Protocol, University of Toronto, Canada.
- Rao A, Soliman H, Kaushal M, Motovylyak O, Vedantam A, et al. (2018) Diffusion Tensor Imaging in a Large Longitudinal Series of Patients with Cervical Spondylotic Myelopathy Correlated with LongTerm Functional Outcome. Neurosurgery 83(4):753-760.
- Sato T, Horikoshi T, Watanabe A, Uchida M, Ishigame K, et al. (2012) Evaluation of Cervical Myelopathy Using Apparent Diffusion Coefficient Measured by Diffusion-Weighted Imaging. AJNR Am J Neuroradiol 33(2): 388-392.
- Fornasa F (2011) Diffusion-weighted Magnetic Resonance Imaging: What Makes Water Run Fast or Slow? J Clin Imaging Sci 1: 27.
- Shabani S, Kaushal M, Budde MD, Wang MC, Kurpad SN (2020) Diffusion tensor imaging in cervical spondylotic myelopathy: a review. Journal of Neurosurgery Spine 33(1): 65-72.
- Mamata H, Jolesz FA, Maier SE (2005) Apparent diffusion coefficient and fractional anisotropy in spinal cord: age and cervical spondylosisrelated changes. J Magn Reson Imaging 22(1): 38-43.
- Kharbanda HS, Alsop DC, Anderson AW, Filardo G, Hackney DB (2006) Effects of cord motion on diffusion imaging of the spinal cord. Magn Reson Med 56(2): 334-339.
- Maier SE (2007) Examination of spinal cord tissue architecture with magnetic resonance diffusion tensor imaging. Neurotherapeutics 4(3): 453-459.
- De Santis S, Gabrielli A, Palombo M, Maraviglia B, Capuani S (2011) Non-Gaussian diffusion imaging: a brief practical review. Magn Reson Imaging 29(10): 1410-1416.
- Ellingson BM, Salamon N, Grinstead JW, Holly LT (2014) Diffusion tensor imaging predicts functional impairment in mild-to-moderate cervical spondylotic myelopathy. Spine J 14(11): 2589-2597.
- Nukala M, Abraham J, Khandige G, Shetty B, Rao A (2019) Efficacy of diffusion tensor imaging in identification of degenerative cervical spondylotic myelopathy. European Journal of Radiology Open 6:1623.
- Bhosale S, Ingale P, Srivastava S, Marathe N, Bhide P (2019) Diffusion tensor imaging as an additional postoperativeprognostic predictor factor in cervical myelopathy patients: An observational study. J Craniovertebr Junction Spine 10(1): 10-13.
- Ma X, Han X, Jiang W, Wang J, Zhang Z, et al. (2018) A Follow-up Study of Postoperative DCM Patients Using Diffusion MRI with DTI and NODDI. Spine (Phila Pa 1976) 43(15): E898-E904.
- Nazeri A, Chakravarty MM, Rotenberg DJ, Rajji TK, Rathi Y, et al. (2015) Functional consequences of neurite orientation dispersion and density in humans across the adult lifespan. J Neurosci 35: 1753-1762.
© by the Authors & Gavin Publishers. This is an Open Access Journal Article Published Under Attribution-Share Alike CC BY-SA: Creative Commons Attribution-Share Alike 4.0 International License. Read More About Open Access Policy.