The Impact of the Covid-19 Pandemic Year 2020 on Cancer Care and the Two Years Outcome compared to 2018 and 2019: A Multicenter Observational Trial of the East German Study Group (OSHO)
by Schulze S1*#, Sorge PF1#, Eiltzer L1, Seseke F2, Opitz B3, Thiele L4, Kahl C5,6, Al-Ali HK1
1Krukenberg Cancer Center Halle, University Hospital Halle (Saale), Ernst-Grube-Straße 40, 06120 Halle (Saale), Germany
2Oncology Center, Hospital Martha-Maria Halle-Dölau, Röntgenstraße 1, 06120 Halle (Saale), Germany
3Oncology Center St. Elisabeth & St. Barbara Halle (Saale), Hospital St. Elisabeth & St. Barbara Halle (Saale), Mauerstraße 5, 06110 Halle (Saale), Germany
4Oncology Center Stendal, Johanniter Hospital Genthin-Stendal, Wendstraße 31, 39576 Stendal, Germany
5Department of Hematology, Oncology and Palliative Care, Hospital Magdeburg, Birkenallee 34, 39130 Magdeburg, Germany
6Department of Internal Medicine, Hematology, Oncology and Palliative Care, Rostock University Medical Center, Schillingallee 35,
18057 Rostock, Germany
#These authors contributed equally to this work.
*Corresponding author: Schulze S, Krukenberg Cancer Center Halle, University Hospital Halle (Saale), Ernst-Grube-Straße 40, 06120 Halle (Saale), Germany.
Received Date: 23 December, 2024
Accepted Date: 02 January, 2025
Published Date: 04 January, 2025
Citation: Schulze S, Sorge PF, Eiltzer L, Seseke F, Opitz B, et al. (2025) The Impact of the Covid-19 Pandemic Year 2020 on Cancer Care and the Two Years Outcome compared to 2018 and 2019: A Multicenter Observational Trial of the East German Study Group (OSHO). J Oncol Res Ther 10: 10259. https://doi.org/10.29011/2574-710X.10259
Abstract
Background: To meet the burden of the COVID-19 pandemic on healthcare resources, oncology services had to be adapted. While a decline in newly-diagnosed cancers and therapies in 2020 was published, a coherent picture to long-term consequences of a temporary decrease in diagnostic scrutiny on outcome of cancer is missing. We report the cross-sectional and longitudinal results of COMA-19, a study designed to assess the impact of the pandemic on oncology care. Methods: Adult Patients with newly-diagnosed cancer in 2020, 2019 and 2018 from five certified cancer centers in Saxony-Anhalt, Germany were included. ADT (Arbeitsgemeinschaft-Deutscher-Tumorzentren)-based data were collected. The primary endpoint was the number of newlydiagnosed cancers in 2020 compared to previous years. Outcome after two years (survival, event-free survival, and time-toprogression) were key secondary endpoints. Results: 11855 patients were recruited (2020, n=3952; 2019, n=4176; 2018, n=3727). In 2020, the number of diagnoses was comparable to previous years (p=0·4). Alterations in patients and tumor characteristics, or delays in therapy were not seen. Systemic therapies (p=0·01) and surgeries (p=0·049) dropped by 4% each. Event-free-survival and time-to-progression were inferior in patients diagnosed in 2020 (p<0·001). Survival tended to be less favorable too (p=0.08). Negative outcomes were observed in ten entities including the four most common cancers (breast, lung, prostate, and colorectal). Minor treatment alterations in 2020 were key predictors for the negative outcome. Conclusion: Safeguarding access to oncological care under a pandemic is feasible. Yet, minor modifications in evidence-based therapy, even in high-economic regions, could have devastating consequences on outcome.
Keywords: Cancer Management; COVID-19; Oncology; Outcome; Pandemic; SARS-CoV-2;
Introduction
On 11 March 2020, the WHO declared the outbreak of severe acute respiratory syndrome corona virus 2 as the COVID-19 pandemic [1]. Far-reaching measures were imposed worldwide including social distancing (lockdowns). This pandemic placed a significant burden on healthcare resources. The infrastructure of almost all health care services was redirected to provide a maximum of intensive care resources. In many countries, health authorities advised health facilities to defer care for non-acute or non-life-threatening conditions, prioritize hospital care, and to reallocate staff to support critical COVID-19 care. The oncology care system had to be adapted to meet this storm. Early reports proposed an intentional postponing of adjuvant chemotherapy or elective surgery for “stable” cancer [2]. Screening programs were temporarily halted, diagnostic tests delayed, scheduled operations and some types of cancer treatment postponed or adapted [3-8]. Cancer societies rapidly published recommendations modifying the patients’ cancer management to maintain, in theory, high-end cancer care [4, 9, 10].
It is not surprising that with a derailed oncological care, a significant decrease in new cancer diagnoses was to be expected. According to the Surveillance, Epidemiology, and End Results (SEER) program, incidence rates for all cancers combined fell 10% in 2020 relative to 2019 [11]. Publications objectified less diagnoses in 2020 and showed that the disruption in care to vary according to pandemic stage where the pause in diagnoses was more pronounced during higher restriction periods [5-7, 12-16].
Indeed, the capacities of different oncological care domains were associated with the number of COVID-19 cases, hospitalization rate, and utilization of intensive care units [17].
Yet and more than three years later, a coherent picture of the extent of disruptions in oncological care is still missing, particularly for cancer management such as delay in therapy and treatment types, partly due to the heterogeneity in data sources, factors insufficiently controlled for in statistical analyzes, and/or moderate evidence quality [18].
Long-term consequences of cancer care disruptions and pandemic management by healthcare systems are possible only after sufficient time has passed and relevant for future pandemics. Realworld data to long-term outcome is still lacking, although early modelling studies estimated increases in avoidable cancer deaths due to the decreased diagnostic scrutiny during the pandemic [1921].
In a multicentre study of the East German Study Group for Hematology and Oncology (OSHO), the short-term oncological care, outcome including survival, and the impact of patient-, cancer-, and treatment-related factors on outcome of patients diagnosed and treated in all certified cancer centers in the federal state of Saxony-Anhalt, Germany in the pandemic year 2020 were compared to the years 2018 and 2019.
Methods
Study Design and Participants
COMA-19 is a multicenter, observational study of the OSHO. It was designed in 2020. Inclusion criteria were age ≥ 18 years and consecutive new cancer diagnoses in 2018, 2019, and 2020. Participating institutions were the five certified cancer centers in the federal state of Saxony-Anhalt according to the National Certification Program of the German Cancer Society prior to 2018. Pseudonymized data for 2018, 2019, and 2020 were collected on site in accordance with the uniform oncological basic data set of the Association of German Tumor Centers and Society of Epidemiological Cancer Registries in Germany. Data collected was identical with those reported to the cancer registry of the federal state (LKR) in accordance with applicable regulations. Coding of cancer was according to the International Statistical Classification of Diseases and Related Health Problems code (ICD-10).
Variables included were year of birth, gender, residence postcode, tumor type and date, stage of disease, therapy, date and cause of death.
Both 2018 and 2019 were included as comparators to avoid the accommodation of one-year which can influence the value of the annual percent change and challenge the interpretation of the trend measure.
Data on race and ethnicity were not collected, because all patients diagnosed with cancer were included consecutively irrespective of race or ethnicity which are not included as variables in the uniform oncological basic data set.
The protocol was submitted to and approved by the ethics committees and registered in the German Registry for Clinical Trails (DRKS00027370).
To minimize bias, the protocol was designed with defined objectives and endpoints, lost patients were accounted for in the sample size calculation, a standardize data set and validated measures for outcome were used, blind data collection was performed, outcome at enrollment was unknown as collection followed the two-step principle explained under procedures, and an independent analysis by other researchers was done.
The academic Krukenberg Cancer Center Halle (KKH) was the coordinating institution.
The study was conducted in accordance with applicable laws and regulations and in compliance with the International Conference on Harmonization of Technical Requirements for Registration of Pharmaceuticals for Human Use - Good Clinical Practice (ICH-GCP) principles. By signing the protocol, investigators confirmed compliance with legal requirements, including data protection laws.
This study followed the STROBE reporting guideline [22]. Figure-1 illustrates the COMA-19 protocol.
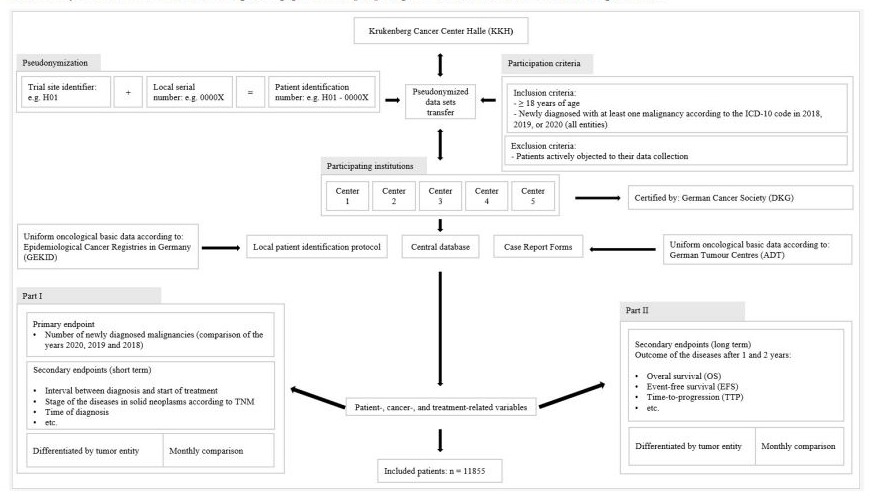
Figure-1: COMA-19 study protocol.
Procedures
The KKH collected the data centrally. Each center received a center identification number (ID). The patient ID and protocols were kept locally and filed in the study file of each center.
The protocol consisted of two parts with cross-sectional and longitudinal data. The cross-sectional data collection for the primary endpoint in 2021 (step one) was followed by the longitudinal data collection after one and two years in 2021 to 2023 (step two). Data were entered in a central database and analyzed at the KKH (Figure-1).
Outcomes
The primary endpoint of COMA-19 was the number of newlydiagnosed cancers in 2020 compared to 2018 and 2019. Outcome after one and two years including survival (OS), event-free survival (EFS), time-to-progression (TTP), and mortality incidence (MI) were key secondary endpoints. Other secondary endpoints were the number of newly-diagnosed cancer by site and time (2020 versus 2018 and 2019). Additionally, the official COVID-19 lockdowns of the Federal Republic of Germany were used to study the distribution of cases across 2020 compared to corresponding time points in 2018 and 2019. The first lock-down was from 16·03 to 04·05·2020 (lock-down-I) and the second lock-down was from 07·10 to 31·12·2020 (lock-down-II). The interval between diagnosis and therapy, stages of cancer, and the impact of patient-, disease-, and treatment-related variables on outcome for newlydiagnosed patients in 2020 compared to 2018 and 2019 were further secondary endpoints.
Statistical Analysis
We hypothesized that a monthly decline in the number of newlydiagnosed cancer of at least 10% per month is to be expected compared to 2018 and 2019. Based on known 2018 and 2019 numbers of the KKH, the number of new diagnoses was modelled using a Poisson univariate discrete probability distribution which can be used to model the number of events occurring at a constant mean rate independently of each other in a fixed time interval [23].
With alpha of 5% and a power of 80%, 1491 cases per year were required to represent a reduction of 10% (PASS software). To compensate for a failure rate (incomplete/incorrect data) of 15%, an additional 224 patients were required. Thus, a total of 1715 patients per year was calculated. Descriptive statistics were used. Continuous variables were presented as mean ± standard deviation (SD) if they are normally distributed. Otherwise as median with interquartile interval (IQR). Categorical factors are presented as absolute and relative frequencies. 95% confidence intervals were given to assess the estimated value of population parameters. Kaplan-Meier plots were used for OS, EFS, and TTP. Cox regression will estimate the influence of independent metric and categorical variables. Statistical tests were two-tailed and p values <0·05 were considered significant. Analyzes were performed using IBM Corp. Released 2021. IBM SPSS Statistics for Windows, Version 28·0. Armonk, NY, USA: IBM Corp.
Role of the funding source
The study funder, the OSHO, had oversight of study design and conduct and had no role in the data collection, data analysis, data interpretation, or writing of the publication. The funder is a nonprofit registered association.
Results
A total of 11855 newly-diagnosed patients were included. Followup data were available for 7984 of these patients (67·3%). Followup rates for 2018, 2019, and 2020 were 73·1% (2723/3727), 69·2% (2890/4179), and 60·0% (2371/3952) respectively. The median follow-up for patients diagnosed in 2020 versus 2018 and 2019 were 10 (IQR 2–22) and 17 (IQR 3–36) months respectively. Figure-2 shows the CONSORT flowchart for the COMA-19 cohort.
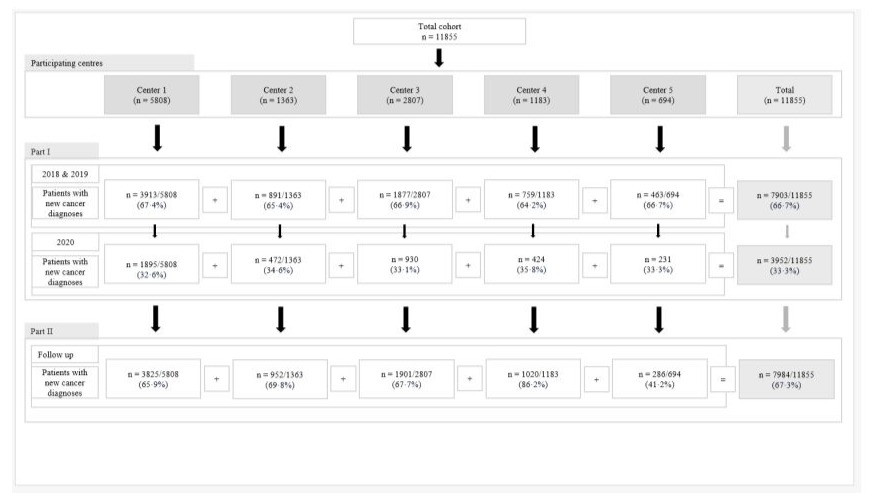
Figure-2: CONSORT flowchart of study population.
(I) Cancer Care
Newly-diagnosed patients 2020 compared to 2018 and 2019
The number of newly-diagnosed patients in 2020 (n=3952) was similar to that in 2019 (n=4176) and 2018 (n=3727) (p=0·4) (Figure-3).
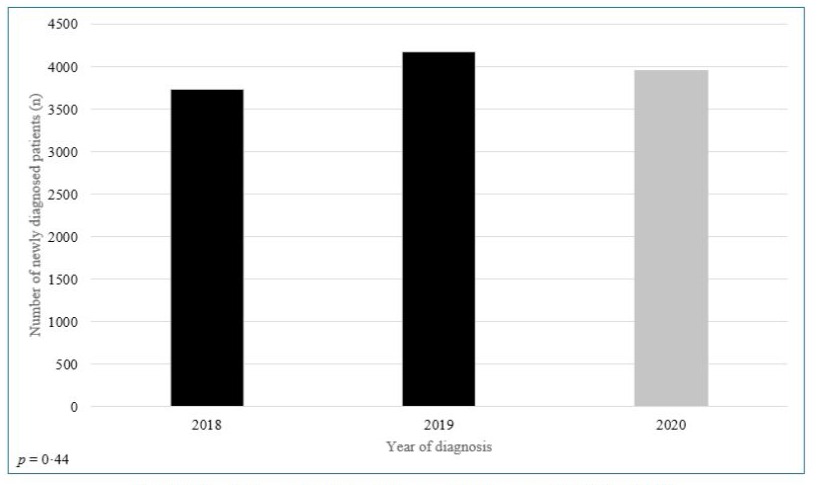
Figure-3: Newly diagnosed patients with cancer in 2020 compared to 2018 and 2019.
Patient, cancer, and treatment characteristics
The age distribution was similar in the three years with a median of 68 years (IQR 58·9–76·8). 43% of patients were ≥ 70 years old. Gender and place of residence (urban versus rural) were equally distributed in the three years (Table-1).
|
Variables |
Total cohort |
Cohort of 2018 |
Cohort of 2019 |
Cohort of 2020 |
p value* |
|
n = 11855 |
n = 3727 |
n = 4176 |
n = 3952 |
||
|
Median age at time of diagnosis (IQR), (years) |
67·8 (58·9–76·8) |
67·5 (58·9–76·6) |
67·8 (58·6–77·0) |
68·0 (59·1–77·0) |
0·37 |
|
Patients ≥ 70 years, n (%) |
5094 (43·0) |
1586 (42·6) |
1792 (42·9) |
1716 (43·4) |
0·48 |
|
Gender, n (%) |
|||||
|
Male |
6622 (55·9) |
2051 (55·0) |
2347 (56·2) |
2224 (55·3) |
0·52 |
|
Female |
5233 (44·1) |
1676 (45·0) |
1829 (43·8) |
1728 (43·7) |
|
|
Place of residence, n (%) |
|||||
|
Urban |
4130 (34·8) |
1342 (36·0) |
1429 (34·2) |
1359 (34·4) |
0·42 |
|
Rural |
7698 (64·9) |
2373 (63·7) |
2736 (65·5) |
2589 (65·5) |
|
|
Missing |
27 (0·2) |
12 (0·3) |
11 (0·3) |
4 (0·1) |
|
|
Patients with former malignancies, n (%) |
|||||
|
Yes |
832 (7·0) |
222 (6·0) |
311 (7·0) |
299 (7·6) |
0·10 |
|
No |
10965 (92·5) |
3483 (93·5) |
3844 (92·5) |
3638 (92·1) |
|
|
Missing |
58 (0·5) |
22 (0·6) |
21 (0·5) |
15 (0·4) |
|
|
Tumor staging (excluding hematologic malignancies), n (%) (neuro-oncologic tumors according to WHO, gynecologic tumors according to FIGO, all other solid tumors according to UICC) |
0·94 |
||||
|
Early tumor stages (0, I, and II) |
5943 (50·1) |
1797 (48·2) |
2158 (51·7) |
1988 (50·3) |
|
|
Advanced tumor stages (III and IV) |
3734 (31·5) |
1160 (31·1) |
1322 (31·7) |
1252 (31·7) |
|
|
Not applicable / missing |
2178 (18·4) |
770 (20·7) |
696 (16·7) |
712 (18·1) |
|
|
Treatment intention, n (%) |
|||||
|
Curative |
8421 (71·0) |
2855 (76·6) |
2790 (66·8) |
2776 (70·2) |
0·17 |
|
Palliative |
1518 (12·8) |
475 (12·7) |
570 (13·6) |
473 (12·0) |
|
|
Missing |
1916 (16·2) |
397 (10·7) |
816 (19·5) |
703 (17·8) |
|
|
Therapy modalities, n (%)** |
|||||
|
Surgery |
7860 (66·3) |
2520 (66·3) |
2832 (67·8) |
2508 (63·5) |
0·049 |
|
Radiotherapy |
2792 (23·6) |
967 (25·9) |
937 (22·4) |
888 (22·5) |
0·39 |
|
Systemic medical therapy |
4664 (39·3) |
1559 (41·8) |
1652 (39·6) |
1453 (36·8) |
0·01 |
|
Watch & Wait / Active surveillance |
154 (1·3) |
59 (1·6) |
36 (0·9) |
59 (1·5) |
0·12 |
|
Best supportive care |
2479 (20·9) |
795 (21·3) |
923 (22·1) |
761 (19·6) |
0·03 |
|
Missing |
979 (8·3) |
219 (5·9) |
338 (8·1) |
219 (5·9) |
- |
|
Abbreviation: Fédération Internationale de Gynécologie et d’Obstétrique (FIGO), Interquartile range (IQR), Union Internationale Contre le Cancer (UICC), World Health Organization (WHO) |
|||||
|
* p values for difference in mean between 2020 versus 2018 and 2019 |
|||||
|
** more than one modality per patient possible |
|||||
|
Significant p values (<0·05) are highlighted (BOLD). |
|||||
Table 1: Patient, tumor, and treatment characteristics in 2020 compared to 2018 and 2019.
In Table-2 the cancer entities are illustrated. The most frequent cancers were breast followed by lung, prostate, and colorectal carcinomas. For most tumors, the number of new diagnoses in 2020 was comparable to that of 2018 and 2019. In 2020 more head and neck (p<0·001), hepatocellular (p=0·02), and renal (p=0·04) cancers were diagnosed. Only dermatologic tumors were less frequently diagnosed in 2020 (p=0·001). No differences in tumor stages were detected among the three years (p=0·94).
Treatment intension (curative versus palliative), radiotherapies, and active surveillance were similar in 2020 compared to 2018, and 2019. A 4% drop in systemic therapies (p=0·01) and surgery (p=0·049) in 2020 was noted (Table-1).
|
Tumor entity |
Year of diagnosis |
Number (n) |
p value |
|
(2018 and 2019 versus 2020) |
|||
|
Breast cancer |
2018 & 2019 |
1246 |
0·93 |
|
2020 |
611 |
||
|
Total |
1857 |
||
|
Lung cancer |
2018 & 2019 |
1033 |
0·78 |
|
2020 |
501 |
||
|
Total |
1534 |
||
|
Prostate cancer |
2018 & 2019 |
1017 |
0·94 |
|
2020 |
499 |
||
|
Total |
1516 |
||
|
Colorectal cancer |
2018 & 2019 |
797 |
0·14 |
|
2020 |
357 |
||
|
Total |
1154 |
||
|
Melanoma and non-melanoma skin cancer |
2018 & 2019 |
766 |
0·001 |
|
2020 |
304 |
||
|
Total |
1070 |
||
|
Hematologic neoplasms |
2018 & 2019 |
569 |
0·91 |
|
2020 |
278 |
||
|
Total |
847 |
||
|
Renal cell carcinoma (incl. upper urinary tract) |
2018 & 2019 |
417 |
0·04 |
|
2020 |
242 |
||
|
Total |
659 |
||
|
Head and neck cancer |
2018 & 2019 |
291 |
< 0·001 |
|
2020 |
202 |
||
|
Total |
493 |
||
|
Urinary bladder (incl. lower urinary tract) |
2018 & 2019 |
325 |
0·85 |
|
2020 |
163 |
||
|
Total |
488 |
||
|
Gynecologic cancer |
2018 & 2019 |
322 |
0·92 |
|
2020 |
157 |
||
|
Total |
479 |
||
|
Pancreatic cancer |
2018 & 2019 |
239 |
0·98 |
|
2020 |
118 |
||
|
Total |
357 |
||
|
Endocrine malignancies |
2018 & 2019 |
204 |
0·38 |
|
2020 |
90 |
||
|
Total |
294 |
||
|
Hepatocellular and hepatobiliary cancer |
2018 & 2019 |
144 |
0·02 |
|
2020 |
96 |
||
|
Total |
240 |
||
|
Gastric cancer |
2018 & 2019 |
139 |
0·66 |
|
2020 |
73 |
||
|
Total |
212 |
||
|
Esophagus cancer |
2018 & 2019 |
100 |
0·53 |
|
2020 |
44 |
||
|
Total |
144 |
||
|
Central nervous system cancer |
2018 & 2019 |
94 |
0·88 |
|
2020 |
45 |
||
|
Total |
139 |
||
|
Sarcoma |
2018 & 2019 |
50 |
0·31 |
|
2020 |
31 |
||
|
Total |
81 |
||
|
Testicular cancer |
2018 & 2019 |
40 |
0·27 |
|
2020 |
26 |
||
|
Total |
66 |
||
|
Other* |
2018 & 2019 |
110 |
- |
|
2020 |
115 |
||
|
Total |
225 |
||
|
Total cohort |
2018 & 2019 |
7903 |
0·44 |
|
2020 |
3952 |
||
|
Total |
11855 |
||
|
* Other include: cancer of unknown primary (n = 133), small bowl cancer (n = 45), penile cancer (n = 21), anal cancer (n = 17), cardiac, mediastinal, and pleural cancer (n = 6), cancer of another male genital tract (n = 3) |
|||
|
Significant p values (<0·05) are highlighted (BOLD). |
|||
Table 2: Tumor entities in 2020 compared to 2018 and 2019.
The interval between diagnosis and therapy was not impacted by the pandemic. The mean of 21 days (SD 34) in 2020 was six days less than that in 2018 and 2019 (mean 27 days, SD 65) and there was no therapy delay across all cancer entities (Figure-4).
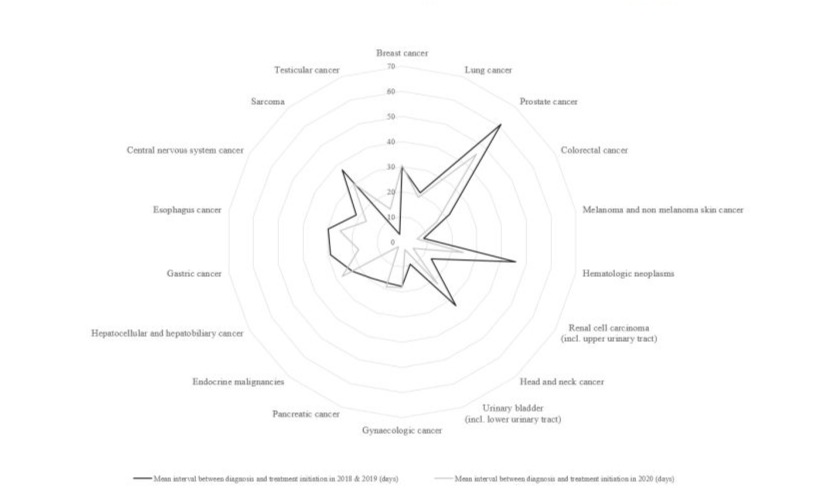
Figure 4: Interval between diagnoses-start of therapies.
The number of diagnoses was not uniformly distributed across 2020. There was a clear shift to the non-lock-down period (p<0·001). Lock-down-I and lock-down-II represented 13·7% and 23·6% of 2020, respectively. Yet, only 11·5% (453/3952) and 22 % (871/3952) of cancers were diagnosed in lock-down-I and lock-down-II respectively. Seasonal variations in diagnoses were also seen in 2018 and 2019 with less (985/7903; 12·5%) and more (1913/7903; 24·2%) new diagnoses compared to the rest of the years in the time frame corresponding to lock-down-I and lock-down-II respectively (p=0·01). Yet, 2020 lock-downs retained a negative impact on the number of new diagnoses (p<0·001).
(II) Outcome
Survival
The one- and two-years OS probabilities for patients diagnosed in 2020 were 87% and 80% respectively compared to 87% and 81% in 2018 and 2019 (p=0·08) (Figure-5a). The trend was towards an inferior survival for diagnoses made in 2020 [mean survival time 31 months (95%CI, 30·6–31·7)] compared to 2018 and 2019 [mean survival time 48 months (95%CI, 47·3–48·6)].
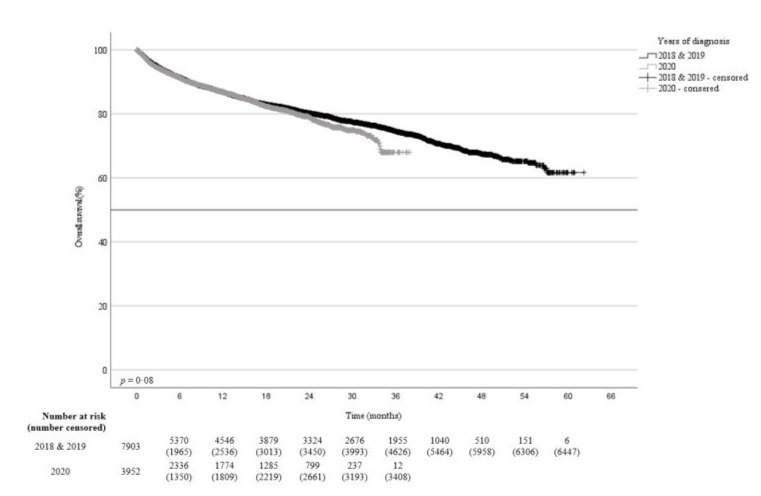
Figure 5a: Overall survival probability for patients diagnosed with cancer in 2020 compared to 2018 and 2019.
Death was documented in 1982 (532 in 2020 and 1450 in 2018 and 2019) out of 7984 (24·8%) patients. No differences in the cause of death (tumor-related versus non-tumor-related) were found for patients diagnosed in the three years where the causes of death were known (Supplement-I).
|
2018 cohort |
2019 cohort |
2020 cohort |
p value |
|
|
Causes of death |
n = 715 |
n = 735 |
n = 532 |
|
|
Tumor-related, n (%) |
381 (53·3) |
435 (59·2) |
247 (33·6) |
0·86 |
|
Non-tumor-related, n (%) |
78 (10·9) |
69 (9·4) |
43 (5·9) |
|
|
Missing, n (%) |
256 (35·8) |
231 (31·4) |
242 (32·9) |
Supplement-I: Causes of death of patients with newly-diagnosed cancer in 2018, 2019, and 2020
Patients diagnosed in 2020 with colorectal (p=0·003), renal cell (p=0·02), and urinary bladder (p=0·02) cancers as well as sarcoma (p=0·04) had a significant inferior survival compared to patients diagnosed in 2018 and 2019 (Table-3).
|
Tumor entity |
Number of patients 2020 versus 2018 & 2019 (n) |
OS |
EFS |
TTP |
|
p value univariate |
p value univariate |
p value univariate |
||
|
Breast cancer |
439 vs. 1065 |
0·93 |
0·17 |
0·01 |
|
Lung cancer |
300 vs. 768 |
0·07 |
0·59 |
< 0·001 |
|
Prostate cancer |
273 vs. 622 |
0·08 |
0·02 |
0·09 |
|
Colorectal cancer |
237 vs. 686 |
0·003 |
0·001 |
0·01 |
|
Melanoma and non-melanoma skin cancer |
142 vs. 363 |
0·72 |
0·30 |
0·23 |
|
Hematologic neoplasms |
193 vs. 437 |
0·51 |
0·26 |
0·26 |
|
Renal cell carcinoma (incl. upper urinary tract) |
103 vs. 249 |
0·02 |
0·11 |
0·88 |
|
Head and neck cancer |
141 vs. 239 |
0·36 |
0·15 |
0·14 |
|
Urinary bladder (incl. lower urinary tract) |
108 vs. 261 |
0·02 |
0·03 |
0·21 |
|
Gynecologic cancer |
96 vs. 215 |
0·58 |
0·27 |
0·02 |
|
Pancreatic cancer |
77 vs. 183 |
0·20 |
0·74 |
0·03 |
|
Endocrine malignancies |
20 vs. 88 |
0·06 |
0·64 |
0·73 |
|
Hepatocellular and hepatobiliary cancer |
59 vs. 88 |
0·09 |
0·03 |
0·15 |
|
Gastric cancer |
36 vs. 93 |
0·79 |
0·81 |
0·65 |
|
Esophagus cancer |
27 vs. 77 |
0·57 |
0·85 |
0·46 |
|
Central nervous system cancer |
27 vs. 58 |
0·91 |
0·07 |
0·10 |
|
Sarcoma |
16 vs. 32 |
0·04 |
0·01 |
0·01 |
|
Testicular cancer |
17 vs. 17 |
0·24 |
0·79 |
0·71 |
|
Other* |
60 vs. 72 |
0·12 |
0·29 |
0·84 |
|
Total cohort |
2371 vs. 5613 |
0·08 |
< 0·001 |
< 0·001 |
|
Abbreviation: Event-free survival (EFS), overall survival (OS), time-to-progression (TTP), versus (vs.) |
||||
|
* Other include: cancer of unknown primary (n = 133), small bowl cancer (n = 45), penile cancer (n = 21), anal cancer (n = 17), cardiac, mediastinal, and pleural cancer (n = 6), cancer of other male genital tract (n = 3) |
||||
|
Significant p values (<0·05) are highlighted (BOLD). |
||||
Table 3: Two-years outcome across tumor entities in 2020 compared to 2018 and 2019.
Event-free Survival
The one- and two-years EFS probabilities for patients diagnosed in 2020 were 77% and 63% respectively compared to 79% an 67% in 2018 and 2019 (p<0·001) (Figure-5b). The mean EFS time of 26 months (95%CI, 25·6–26·8) for 2020 made diagnoses was significantly inferior to the mean EFS time of 39 months (95%CI, 38·6–39·9) for patients diagnosed in 2018 and 2019. Besides colorectal (p=0·001) and urinary bladder (p=0·03) cancers and sarcoma (p=0·01), an inferior EFS for patients diagnosed in 2020 was documented for prostate (p=0·02) and hepatocellular carcinomas (p=0·03) (Table-3).
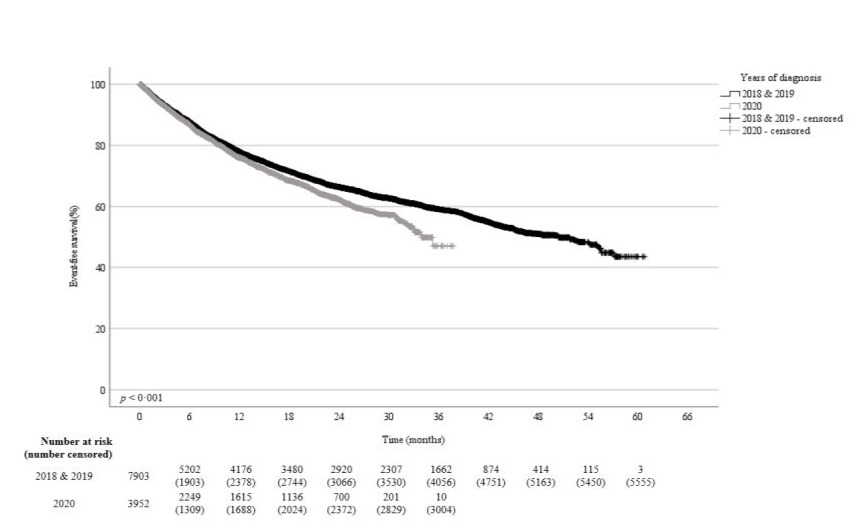
Figure 5b: Event-free survival 2020 compared to 2018 & 2019
Time-to-Progression
The one- and two-years TTP probabilities for patients diagnosed in 2020 were 86% and 74% respectively compared to 89% and 79% in 2018 and 2019 (p<0·001) (Figure-5c). The mean TTP of 30 months (95%CI, 29·4–30·5) in patients diagnosed in 2020 was significantly inferior to the mean TTP of 47 months (95% CI, 46·2–47·5) for patients diagnosed in 2018 and 2019. Patients with colorectal cancer (p=0·01) and sarcoma (p=0·01) had a significant shorter TTP if diagnosed in 2020. Breast, lung, gynecologic, and pancreatic malignancies were also associated with a shorter TTP if diagnosed in 2020 (Table-3).
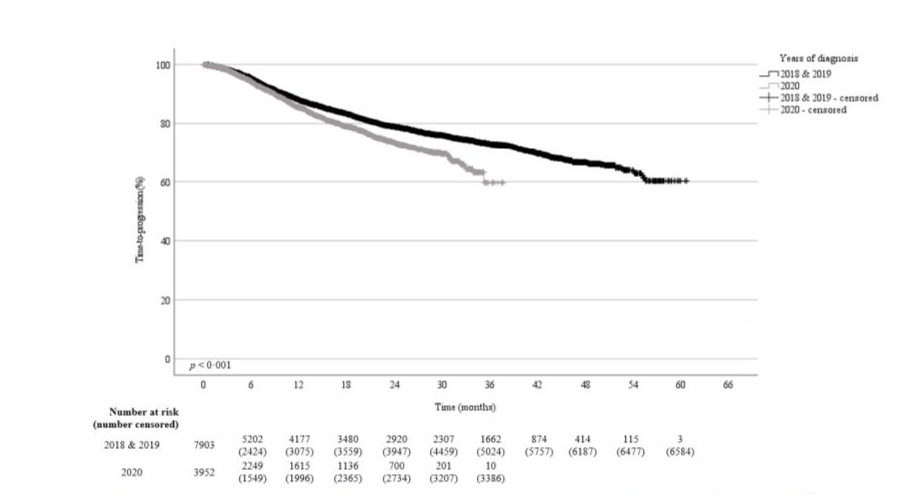
Figure 5c: Time-to-progression probability for patients diagnosed with cancer in 2020 compared to 2018 and 2019.
Predictors of inferior outcome of patients diagnosed in 2020 compared to 2018 and 2019
For entities associated with an inferior outcome if the diagnoses was made in 2020, patient-, cancer-, and treatment- characteristics were compared to patients diagnosed in 2018 and 2019 to identify predictors for the inferior outcome (Table-4 and Supplement-II).
|
Variables |
Breast cancer p value univariate |
Lung cancer p value univariate |
Prostate cancer p value univariate |
Colorectal cancer p value univariate |
Renal cell carci- noma (incl. upper urinary tract) p value univariate |
Urinary bladder (incl. lower urinary tract) p value univariate |
Gynecologic cancer p value univariate |
Pancreatic cancer p value univariate |
Hepatocellular and hepatobiliary cancer p value univariate |
Sarcoma p value univariate |
|
Age at time of diagnosis |
0·43 |
0·95 |
0·92 |
0·36 |
0·27 |
0·85 |
0·16 |
0·35 |
0·73 |
0·87 |
|
Patients ≥ 70 years |
0·10 |
0·40 |
0·67 |
0·24 |
0·30 |
0·41 |
0·27 |
0·97 |
0·75 |
0·17 |
|
Gender |
0·43 |
0·66 |
- |
0·90 |
0·10 |
0·73 |
- |
0·98 |
0·55 |
0·83 |
|
Place of residence, n (%) |
0·86 |
0·90 |
0·65 |
0·55 |
0·38 |
0·02 |
0·08 |
0·36 |
0·25 |
0·48 |
|
Patients with former malignancies, n (%) |
0·99 |
0·10 |
0·75 |
0·01 |
0·36 |
0·01 |
0·97 |
0·85 |
0·74 |
0·17 |
|
Tumor stage, n (%) |
0·22 |
0·56 |
0·85 |
0·47 |
0·39 |
0·60 |
0·63 |
0·70 |
0·39 |
0·65 |
|
Treatment intention, n (%) |
0·07 |
0·46 |
0·88 |
0·79 |
0·26 |
0·01 |
0·02 |
0·56 |
0·23 |
0·74 |
|
Therapy modalities, n (%)* |
||||||||||
|
Surgery |
0·90 |
0·03 |
0·07 |
0·95 |
0·03 |
0·998 |
0·74 |
0·003 |
0·11 |
0·95 |
|
Radiotherapy |
0·25 |
0·78 |
0·002 |
0·58 |
0·54 |
0·38 |
0·75 |
- |
0·45 |
0·09 |
|
Systemic medical therapy |
0·13 |
0·92 |
0·01 |
0·06 |
0·40 |
< 0·001 |
0·22 |
0·74 |
0·32 |
0·14 |
|
Watch & Wait / Active surveillance |
- |
- |
0·23 |
- |
- |
- |
- |
- |
- |
- |
|
Best supportive care |
- |
< 0·001 |
0·01 |
0·74 |
0·87 |
0·38 |
0·28 |
0·02 |
0·49 |
0·25 |
|
Diagnosis time point corresponding to lock-downs of 2020 |
0·06 |
0·28 |
0·09 |
0·55 |
0·58 |
0·69 |
0·13 |
0·62 |
0·34 |
0·16 |
|
Interval between diagnosis and therapy |
0·65 |
0·49 |
< 0·001 |
0·01 |
0·002 |
0·02 |
0·90 |
0·74 |
0·53 |
0·64 |
|
* more than one modality per patient possible |
||||||||||
|
Significant p values (< 0·05) are highlighted (BOLD). |
||||||||||
Table 4: Univariate analysis of patient-, cancer-, and treatment- variables for patients diagnosed in 2020 versus 2018 and 2019 for cancer entities associated with an inferior 2020 outcome.
Supplement-II - Patient, tumor, and treatment characteristics in 2020 compared to 2018 and 2019
|
Variables |
Total cohort n = 1857 |
Cohort of 2018 n = 618 |
Cohort of 2019 n = 628 |
Cohort of 2020 n = 611 |
p value* |
|
Median age at time of diagnosis (IQR), (years) |
62·5 (52·3-74·4) |
61·9 (52·3-72·3) |
62·8 (52·1-74·9) |
62·7 (52·5-75·8) |
0·43 |
|
Patients ≥ 70 years, n (%) |
585 (31·5) |
176 (28·5) |
201 (32·0) |
208 (34·0) |
0·10 |
|
Gender, n (%) |
|||||
|
Male |
14 (0·8) |
3 (0·5) |
5 (0·8) |
6 (1·0) |
0·43 |
|
Female |
1843 (99·2) |
615 (99·5) |
623 (99·2) |
605 (99·0) |
|
|
Place of residence, n (%) |
|||||
|
Urban |
625 (33·7) |
224 (36·2) |
197 (31·4) |
204 (33·4) |
0·86 |
|
Rural |
1229 (66·2) |
393 (63·6) |
430 (68·5) |
406 (66·4) |
|
|
Missing |
3 (0·2) |
1 (0·2) |
1 (0·2) |
1 (0·002) |
|
|
Patients with former malignancies, n (%) |
|||||
|
Yes |
176 (9·5) |
52 (8·4) |
66 (10·5) |
58 (9·5) |
0·99 |
|
No |
1677 (90·3) |
565 (91·4) |
560 (89·2) |
552 (90·3) |
|
|
Missing |
4 (0·2) |
1 (0·2) |
2 (0·3) |
1 (0·002) |
|
|
Tumor staging (UICC), n (%) |
|||||
|
Early tumor stages (0, I, and II) |
1526 (82·2) |
513 (83·0) |
526 (83·8) |
487 (79·7) |
0·22 |
|
Advanced tumor stages (III and IV) |
260 (14·0) |
90 (14·6) |
77 (12·3) |
93 (15·2) |
|
|
Not applicable / missing |
71 (3·8) |
15 (2·4) |
25 (4·0) |
31 (5·1) |
|
|
Treatment intention, n (%) |
|||||
|
Curative |
1695 (91·3) |
570 (92·2) |
578 (92·0) |
547 (89·5) |
0·07 |
|
Palliative |
54 (2·9) |
25 (4·0) |
18 (2·9) |
11 (1·8) |
|
|
Missing |
108 (5·8) |
23 (3·7) |
32 (5·1) |
53 (8·7) |
|
|
Therapy modalities, n (%)** |
|||||
|
Surgery |
1582 (85·2) |
523 (84·6) |
536 (85·4) |
523 (85·6) |
0·90 |
|
Radiotherapy |
1145 (61·7) |
403 (65·2) |
374 (59·6) |
368 (60·2) |
0·25 |
|
Systemic medical therapy |
1263 (68·0) |
434 (70·2) |
397 (63·2) |
432 (70·7) |
0·13 |
|
Missing |
48 (2·6) |
18 (29·1) |
18 (2·9) |
12 (2·0) |
- |
|
Diagnosis time point corresponding to lock- downs of 2020, n (%) |
|||||
|
Yes |
642 (34·6) |
239 (38·7) |
214 (34·1) |
189 (30·9) |
0·06 |
|
No |
1215 (65·4) |
379 (61·3) |
414 (65·9) |
422 (69·1) |
|
|
Mean interval between diagnosis and therapy (SD), (days) |
30·0 (39·7) |
30·9 (47·4) |
28·4 (38·3) |
30·6 (31·6) |
0·65 |
|
Abbreviation: Interquartile range (IQR), Standard deviation (SD), Union Internationale Contre le Cancer (UICC). *p values for difference in mean between 2020 versus 2018 and 2019; **more than one modality per patient possible; Significant p values (< 0·05) are highlighted (BOLD). |
|||||
Supplement-II, Table-I: Breast cancer.
|
Variables |
Total cohort n = 1534 |
Cohort of 2018 n = 498 |
Cohort of 2019 n = 535 |
Cohort of 2020 n = 501 |
p value* |
|
Median age at time of diagnosis (IQR), (years) |
67·3 (60·8-75·4) |
67·9 (61·2-75·6) |
67·7 (60·9-75·5) |
66·6 (60·6-74·8) |
0·95 |
|
Patients ≥ 70 years, n (%) |
617 (40·2) |
208 (41·8) |
215 (40·2) |
194 (38·7) |
0·40 |
|
Gender, n (%) |
|||||
|
Male |
1019 (66·4) |
342 (68·7) |
348 (65·0) |
329 (65·7) |
0·66 |
|
Female |
515 (33·6) |
156 (31·3) |
187 (35·0) |
172 (34·3) |
|
|
Place of residence, n (%) |
|||||
|
Urban |
375 (24·4) |
117 (23·5) |
134 (25·0) |
124 (24·8) |
0·90 |
|
Rural |
1152 (75·1) |
377 (75·7) |
398 (74·4) |
377 (75·2) |
|
|
Missing |
7 (0·5) |
4 (0·8) |
3 (0·6) |
0 (0) |
|
|
Patients with former malignancies, n (%) |
|||||
|
Yes |
91 (5·9) |
24 (4·8) |
30 (5·6) |
37 (7·4) |
0·10 |
|
No |
1430 (93·2) |
470 (94·4) |
499 (93·3) |
461 (92·0) |
|
|
Missing |
13 (0·8) |
4 (0·8) |
6 (1·1) |
3 (0·6) |
|
|
Tumor staging (UICC), n (%) |
|||||
|
Early tumor stages (0, I, and II) |
451 (29·4) |
146 (29·3) |
164 (30·7) |
141 (28·1) |
0·56 |
|
Advanced tumor stages (III and IV) |
1034 (67·4) |
337 (67·7) |
358 (66·9) |
339 (67·7) |
|
|
Not applicable / missing |
49 (3·2) |
15 (3·0) |
13 (2·4) |
21 (4·2) |
|
|
Treatment intention, n (%) |
|||||
|
Curative |
563 (36·7) |
188 (37·8) |
191 (35·7) |
184 (36·7) |
0·46 |
|
Palliative |
574 (37·4) |
194 (39·0) |
204(38·1) |
176 (35·2) |
|
|
Missing |
397 (25·9) |
116 (23·3) |
140 (26·2) |
141 (28·1) |
|
|
Therapy modalities, n (%)** |
|||||
|
Surgery |
406 (26·5) |
141 (28·3) |
151 (28·2) |
114 (22·8) |
0·03 |
|
Radiotherapy |
411 (26·8) |
149 (29·9) |
127 (23·7) |
135 (26·9) |
0·78 |
|
Systemic medical therapy |
793 (48·2) |
263 (52·8) |
273 (51·0) |
257 (51·3) |
0·92 |
|
Best supportive care |
582 (37·9) |
203 (40·8) |
221 (41·3) |
158 (31·5) |
< 0·001 |
|
Missing |
262 (17·1) |
62 (12·4) |
110 (20·6) |
90 (18·0) |
- |
|
Diagnosis time point corresponding to lock- downs of 2020, n (%) |
|||||
|
Yes |
534 (34·8) |
179 (35·9) |
192 (35·9) |
163 (32·5) |
0·28 |
|
No |
1000 (65·2) |
319 (64·1) |
343 (64·1) |
338 (67·5) |
|
|
Mean interval between diagnosis and therapy (SD), (days) |
20·1 (47·7) |
22·1 (65·8) |
19·2 (37·6) |
18·9 (30·9) |
0·49 |
|
Abbreviation: Interquartile range (IQR), Standard deviation (SD), Union Internationale Contre le Cancer (UICC). * p values for difference in mean between 2020 versus 2018 and 2019; ** more than one modality per patient possible; Significant p values (< 0·05) are highlighted (BOLD). |
|||||
Supplement-II, Table-II: Lung cancer.
|
Variables |
Total cohort n = 1516 |
Cohort of 2018 n = 483 |
Cohort of 2019 n = 534 |
Cohort of 2020 n = 499 |
p value* |
|
Median age at time of diagnosis (IQR), (years) |
68·9 (64·0-75·1) |
69·1 (64·5-75·4) |
68·6 (63·6-74·5) |
68·9 (63·2-75·5) |
0·92 |
|
Patients ≥ 70 years, n (%) |
656 (43·3) |
224 (46·4) |
220 (41·2) |
212 (42·5) |
0·67 |
|
Place of residence, n (%) |
|||||
|
Urban |
613 (40·4) |
209 (43·3) |
198 (37·1) |
206 (41·3) |
0·65 |
|
Rural |
899 (59·3) |
273 (56·5) |
334 (62·5) |
292 (58·5) |
|
|
Missing |
4 (0·3) |
1 (0·2) |
2 (0·4) |
1 (0·2) |
|
|
Patients with former malignancies, n (%) |
|||||
|
Yes |
111 (7·3) |
33 (6·8) |
43 (8·1) |
35 (7·0) |
0·75 |
|
No |
1405 (92·7) |
450 (93·2) |
491 (91·9) |
464 (93·0) |
|
|
Tumor staging (UICC) n (%) |
|||||
|
Early tumor stages (0, I, and II) |
978 (64·5) |
309 (64·0) |
341 (63·9) |
328 (65·7) |
0·85 |
|
Advanced tumor stages (III and IV) |
451 (29·7) |
143 (29·6) |
159 (29·8) |
149 (29·9) |
|
|
Not applicable / missing |
87 (5·7) |
31 (6·4) |
34 (6·4) |
22 (4·4) |
|
|
Treatment intention, n (%) |
|||||
|
Curative |
1097 (72·4) |
393 (81·4) |
400 (74·9) |
304 (60·9) |
0·88 |
|
Palliative |
127 (8·4) |
45 (9·3) |
46 (8·6) |
36 (7·2) |
|
|
Missing |
292 (19·3) |
45 (9·3) |
88 (16·5) |
159 (31·9) |
|
|
Therapy modalities, n (%)** |
|||||
|
Surgery |
966 (63·7) |
293(60·7) |
357 (66·9) |
316 (63·3) |
0·07 |
|
Radiotherapy |
248 (16·4) |
94 (20·5) |
97 (16·2) |
57 (11·4) |
0·002 |
|
Systemic medical therapy |
256 (16·9) |
99 (41·8) |
95 (17·8) |
62 (14·4) |
0·01 |
|
Watch & Wait / Active surveillance |
92 (6·1) |
35 (7·2) |
23 (4·3) |
34 (6·8) |
0·23 |
|
Best supportive care |
198 (1·3) |
51 (10·6) |
69 (12·9) |
78 (15·6) |
0·01 |
|
Missing |
210 (13·9) |
56 (11·6) |
64 (12·0) |
90 (18·3) |
- |
|
Diagnosis time point corresponding to lock- downs of 2020, n (%) |
|||||
|
Yes |
583 (38·5) |
215 (44·5) |
194 (36·3) |
174 (34·9) |
0·09 |
|
No |
933 (61·5) |
268 (55·5) |
340 (63·7) |
325 (65·1) |
|
|
Mean interval between diagnosis and therapy (SD), (days) |
56·3 (75·2) |
62·3 (108·3) |
60·1 (58·6) |
45·6 (41·3) |
< 0·001 |
|
Abbreviation: Interquartile range (IQR), Standard deviation (SD), Union Internationale Contre le Cancer (UICC). * p values for difference in mean between 2020 versus 2018 and 2019; ** more than one modality per patient possible. Significant p values (< 0·05) are highlighted (BOLD). |
|||||
Supplement-II, Table-III: Prostate cancer.
|
Variables |
Total cohort n = 1154 |
Cohort of 2018 n = 360 |
Cohort of 2019 n = 437 |
Cohort of 2020 n = 357 |
p value* |
|
Median age at time of diagnosis (IQR), (years) |
70·1 (61·5-78·4) |
69·5 (60·7-77·2) |
69·9 (62·0-78·8) |
70·7 (61·6-79·1) |
0·36 |
|
Patients ≥ 70 years, n (%) |
578 (50·1) |
172 (47·8) |
218 (49·9) |
188 (52·7) |
0·24 |
|
Gender, n (%) |
|||||
|
Male |
737 (63·9) |
226 (62·8) |
284 (65·0) |
227 (63·6) |
0·90 |
|
Female |
417 (36·1) |
134 (37·2) |
153 (35·0) |
130 (36·4) |
|
|
Place of residence, n (%) |
|||||
|
Urban |
401 (34·7) |
125 (34·7) |
147 (33·6) |
129 (36·1) |
0·55 |
|
Rural |
749 (64·9) |
233 (64·7) |
288 (65·9) |
228 (63·9) |
|
|
Missing |
4 (0·3) |
2 (0·6) |
2 (0·5) |
0 (0) |
|
|
Patients with former malignancies, n (%) |
|||||
|
Yes |
105 (9·1) |
25 (6·9) |
35 (8·0) |
45 (12·6) |
0·01 |
|
No |
1045 (90·6) |
332 (92·2) |
402 (92·0) |
311 (87·1) |
|
|
Missing |
4 (0·3) |
3 (0·8) |
0 (0) |
1 (0·3) |
|
|
Tumor staging (UICC), n (%) |
|||||
|
Early tumor stages (0, I, and II) |
535 (46·4) |
163 (45·3) |
203 (46·5) |
169 (47·3) |
0·47 |
|
Advanced tumor stages (III and IV) |
555 (48·1) |
182 (50·6) |
209 (47·8) |
164 (45·9) |
|
|
Not applicable / missing |
64 (5·5) |
15 (4·2) |
25 (5·7) |
24 (6·7) |
|
|
Treatment intention, n (%) |
|||||
|
Curative |
942 (81·6) |
309 (85·8) |
355 (81·2) |
278 (77·9) |
0·79 |
|
Palliative |
158 (13·7) |
45 (12·5) |
68 (15·6) |
45 (12·6) |
|
|
Missing |
54 (4·7) |
6 (1·7) |
14 (3·2) |
34 (9·5) |
|
|
Therapy modalities, n (%)** |
|||||
|
Surgery |
981 (85·0) |
311 (86·4) |
370 (84·7) |
300 (84·0) |
0·95 |
|
Radiotherapy |
224 (19·4) |
59 (16·4) |
93 (21·3) |
72 (20·2) |
0·58 |
|
Systemic medical therapy |
479 (41·5) |
172 (47·8) |
175 (40·0) |
132 (37·0) |
0·06 |
|
Best supportive care |
449 (38·9) |
130 (36·1) |
179 (41·0) |
140 (39·2) |
0·74 |
|
Missing |
27 (2·3) |
5 (1·4) |
10 (2·3) |
12 (3·4) |
- |
|
Diagnosis time point corresponding to lock- downs of 2020, n (%) |
|||||
|
Yes |
394 (34·1) |
118 (32·8) |
160 (36·6) |
116 (32·5) |
0·55 |
|
No |
760 (65·9) |
242 (67·2) |
277 (63·4) |
241 (67·5) |
|
|
Mean interval between diagnosis and therapy (SD), (days) |
19·9 (51·9) |
26·9 (76·4) |
17·4 (42·9) |
15·6 (21·9) |
0·01 |
|
Abbreviation: Interquartile range (IQR), Standard deviation (SD), Union Internationale Contre le Cancer (UICC). * p values for difference in mean between 2020 versus 2018 and 2019; ** more than one modality per patient possible. Significant p values (< 0·05) are highlighted (BOLD). |
|||||
Supplement-II, Table-IV: Colorectal cancer.
|
Variables |
Total cohort n = 659 |
Cohort of 2018 n = 209 |
Cohort of 2019 n = 208 |
Cohort of 2020 n = 242 |
p value* |
|
Median age at time of diagnosis (IQR), (years) |
68·1 (61·5-76·6) |
68·4 (61·4-76·9) |
67·8 (59·9-75·9) |
68·3 (61·7-77·1) |
0·27 |
|
Patients ≥ 70 years, n (%) |
293 (44·5) |
92 (44·0) |
87 (41·8) |
114 (47·1) |
0·30 |
|
Gender, n (%) |
|||||
|
Male |
442 (67·1) |
131 (62·7) |
139 (66·8) |
172 (71·1) |
0·10 |
|
Female |
217 (32·9) |
78 (37·3) |
69 (33·2) |
70 (28·9) |
|
|
Place of residence, n (%) |
|||||
|
Urban |
254 (38·5) |
81 (38·8) |
85 (40·9) |
88 (36·4) |
0·38 |
|
Rural |
405 (61·5) |
128 (61·2) |
123 (59·1) |
154 (63·6) |
|
|
Patients with former malignancies, n (%) |
|||||
|
Yes |
75 (11·4) |
23 (11·0) |
28 (13·5) |
24 (9·9) |
0·36 |
|
No |
583 (88·5) |
186 (89·0) |
179 (86·1) |
218 (90·1) |
|
|
Missing |
1 (0·2) |
0 (0) |
1 (0·5) |
0 (0) |
|
|
Tumor staging (UICC), n (%) |
|||||
|
Early tumor stages (0, I, and II) |
412 (62·5) |
124 (59·3) |
143 (68·8) |
145 (59·9) |
0·39 |
|
Advanced tumor stages (III and IV) |
196 (29·7) |
62 (29·7) |
58 (27·9) |
76 (31·4) |
|
|
Not applicable / missing |
51 (7·7) |
23 (11·0) |
7 (3·4) |
21 (8·7) |
|
|
Treatment intention, n (%) |
|||||
|
Curative |
583 (88·5) |
186 (89·0) |
192 (92·3) |
205 (84·7) |
0·26 |
|
Palliative |
46 (7·0) |
14 (6·7) |
12 (5·8) |
20 (8·3) |
|
|
Missing |
30 (4·6) |
9 (4·3) |
4 (1·9) |
17 (7·0) |
|
|
Therapy modalities, n (%)** |
|||||
|
Surgery |
610 (92·6) |
197 (94·3) |
196 (94·2) |
217 (89·7) |
0·03 |
|
Radiotherapy |
20 (3·0) |
5 (2·4) |
9 (4·3) |
6 (2·3) |
0·54 |
|
Systemic medical therapy |
69 (10·5) |
18 (8·6) |
29 (13·9) |
22 (9·1) |
0·40 |
|
Best supportive care |
109 (16·5) |
35 (16·7) |
35 (16·8) |
39 (16·1) |
0·87 |
|
Missing |
20 (3·0) |
7 (3·3) |
4 (1·9) |
9 (3·7) |
- |
|
Diagnosis time point corresponding to lock- downs of 2020, n (%) |
|||||
|
Yes |
234 (35·5) |
71 (34·0) |
71 (34·1) |
92 (38·0) |
0·58 |
|
No |
425 (64·5) |
138 (66·0) |
137 (65·9) |
150 (62·0) |
|
|
Mean interval between diagnosis and therapy (SD), (days) |
10·4 (40·9) |
14·5 (63·7) |
12·3 (28·2) |
5·0 (18·3) |
0·002 |
|
Abbreviation: Interquartile range (IQR), Standard deviation (SD), Union Internationale Contre le Cancer (UICC); *p values for difference in mean between 2020 versus 2018 and 2019; **more than one modality per patient possible. Significant p values (< 0·05) are highlighted (BOLD). |
|||||
Supplement-II, Table-V: Renal cell carcinoma (incl. upper urinary tract).
|
Variables |
Total cohort n = 488 |
Cohort of 2018 n = 148 |
Cohort of 2019 n = 177 |
Cohort of 2020 n = 163 |
p value* |
|
Median age at time of diagnosis (IQR), (years) |
73·2 (65·2-79·8) |
74·9 (65·2-80·2) |
72·2 (64·5-79·1) |
72·7 (65·5-81·3) |
0·85 |
|
Patients ≥ 70 years, n (%) |
285 (58·4) |
97 (65·5) |
97 (54·8) |
91 (55·8) |
0·41 |
|
Gender, n (%) |
|||||
|
Male |
355 (72·7) |
101 (68·2) |
137 (77·4) |
117 (71·8) |
0·73 |
|
Female |
133 (27·3) |
47 (31·8) |
40 (22·6) |
46 (28·2) |
|
|
Place of residence, n (%) |
|||||
|
Urban |
259 (53·1) |
89 (60·1) |
96 (54·2) |
74 (45·4) |
0·02 |
|
Rural |
228 (46·7) |
58 (39·2) |
81 (45·8) |
89 (54·6) |
|
|
Missing |
1 (0·2) |
1 (0·7) |
0 (0) |
0 (0) |
|
|
Patients with former malignancies, n (%) |
|||||
|
Yes |
34 (7·0) |
7 (4·7) |
9 (5·1) |
18 (11·0) |
0·01 |
|
No |
454 (93·0) |
141 (95·3) |
168 (94·9) |
145 (89·0) |
|
|
Tumor staging (UICC), n (%) |
|||||
|
Early tumor stages (0, I, and II) |
339 (69·5) |
85 (57·4) |
135 (76·3) |
119 (73·0) |
0·60 |
|
Advanced tumor stages (III and IV) |
100 (20·5) |
27 (18·2) |
35 (19·8) |
38 (23·3) |
|
|
Not applicable / missing |
49 (10·0) |
36 (24·3) |
7 (4·0) |
6 (3·7) |
|
|
Treatment intention, n (%) |
|||||
|
Curative |
447 (91·6) |
140 (94·6) |
167 (94·4) |
140 (85·9) |
0·01 |
|
Palliative |
23 (4·7) |
7 (4·7) |
3 (1·7) |
13 (8·0) |
|
|
Missing |
18 (3·7) |
1 (0·7) |
7 (4·0) |
10 (6·1) |
|
|
Therapy modalities, n (%)** |
|||||
|
Surgery |
475 (97·3) |
146 (98·6) |
171 (96·6) |
158 (96·9) |
0·998 |
|
Radiotherapy |
24 (4·9) |
10 (6·8) |
8 (4·5) |
6 (3·7) |
0·38 |
|
Systemic medical therapy |
159 (32·6) |
53 (35·8) |
73 (41·2) |
33 (20·2) |
< 0·001 |
|
Best supportive care |
73 (15·0) |
17 (11·5) |
35 (19·8) |
21 (12·9) |
0·38 |
|
Missing |
10 (2·0) |
1 (0·7) |
5 (2·8) |
4 (2·5) |
- |
|
Diagnosis time point corresponding to lock- downs of 2020, n (%) |
|||||
|
Yes |
191 (39·1) |
56 (37·8) |
67 (37·9) |
68 (41·7) |
0·69 |
|
No |
297 (60·9) |
92 (62·2) |
110 (62·1) |
98 (58·3) |
|
|
Mean interval between diagnosis and therapy (SD), (days) |
7·4 (37·0) |
4·7 (16·7) |
13·5 (58·1) |
3·2 (12·5) |
0·02 |
|
Abbreviation: Interquartile range (IQR), Standard deviation (SD), Union Internationale Contre le Cancer (UICC). * p values for difference in mean between 2020 versus 2018 and 2019; ** more than one modality per patient possible. Significant p values (< 0·05) are highlighted (BOLD). |
|||||
Supplement-II, Table-VI: Urinary bladder (incl. lower urinary tract).
|
Variables |
Total cohort n = 479 |
Cohort of 2018 n = 162 |
Cohort of 2019 n = 160 |
Cohort of 2020 n = 157 |
p value* |
|
Median age at time of diagnosis (IQR), (years) |
63·7 (52·8-75·3) |
64·1 (54·8-76·4) |
64·9 (50·3-76·2) |
62·4 (51·8-72·8) |
0·16 |
|
Patients ≥ 70 years, n (%) |
169 (35·3) |
59 (36·4) |
60 (37·5) |
50 (31·8) |
0·27 |
|
Place of residence, n (%) |
|||||
|
Urban |
211 (44·1) |
65 (40·1) |
68 (42·5) |
78 (49·7) |
0·08 |
|
Rural |
266 (55·5) |
97 (59·9) |
91 (56·9) |
78 (49·7) |
|
|
Missing |
2 (0·4) |
0 (0) |
1 (0·6) |
1 (0·6) |
|
|
Patients with former malignancies, n (%) |
|||||
|
Yes |
34 (7·1) |
15 (9·3) |
8 (5·0) |
11 (7·0) |
0·97 |
|
No |
437 (91·2) |
146 (90·1) |
148 (92·5) |
143 (91·1) |
|
|
Missing |
8 (1·7) |
1 (0·6) |
4 (2·5) |
3 (1·9) |
|
|
Tumor staging (FIGO), n (%) |
|||||
|
Early tumor stages (0, I, and II) |
213 (44·5) |
75 (46·3) |
66 (41·3) |
72 (45·9) |
0·63 |
|
Advanced tumor stages (III and IV) |
177 (37·0) |
52 (32·1) |
61 (38·1) |
64 (40·8) |
|
|
Not applicable / missing |
89 (18·6) |
35 (21·6) |
33 (20·6) |
21 (13·4) |
|
|
Treatment intention, n (%) |
|||||
|
Curative |
333 (69·5) |
95 (58·6) |
126 (78·8) |
112 (71·3) |
0·02 |
|
Palliative |
44 (9·2) |
12 (7·4) |
9 (5·6) |
23 (14·6) |
|
|
Missing |
102 (21·3) |
55 (34·0) |
25 (15·6) |
22 (14·0) |
|
|
Therapy modalities, n (%)** |
|||||
|
Surgery |
404 (84·3) |
140 (86·4) |
133 (83·1) |
131 (83·4) |
0·74 |
|
Radiotherapy |
117 (24·4) |
45 (27·8) |
33 (20·6) |
39 (24·8) |
0·75 |
|
Systemic medical therapy |
147 (30·7) |
42 (25·9) |
52 (32·5) |
53 (33·8) |
0·22 |
|
Best supportive care |
125 (26·1) |
40 (24·7) |
40 (25·0) |
45 (28·7) |
0·28 |
|
Missing |
22 (4·6) |
4 (2·5) |
8 (5·0) |
10 (6·4) |
- |
|
Diagnosis time point corresponding to lock- downs of 2020, n (%) |
|||||
|
Yes |
186 (38·8) |
57 (35·2) |
65 (40·6) |
64 (40·8) |
0·13 |
|
No |
293 (61·2) |
105(64·8) |
95 (59·2) |
93 (59·2) |
|
|
Mean interval between diagnosis and therapy (SD), (days) |
17·8 (51·9) |
22·1 (76·3) |
13·1 (38·6) |
18·25 (26·6) |
0·90 |
|
Abbreviation: Fédération Internationale de Gynécologie et d’Obstétrique (FIGO), Interquartile range (IQR), Standard deviation (SD). * p values for difference in mean between 2020 versus 2018 and 2019; ** more than one modality per patient possible. Significant p values (< 0·05) are highlighted (BOLD). |
|||||
Supplement-II, Table-VII: Gynecologic cancer.
|
Variables |
Total cohort n = 357 |
Cohort of 2018 n = 101 |
Cohort of 2019 n = 138 |
Cohort of 2020 n = 118 |
p value* |
|
Median age at time of diagnosis (IQR), (years) |
70·8 (60·6-78·4) |
71·1 (59·9-77·5) |
71·0 (60·2-78·6) |
70·5 (63·9-79·0) |
0·35 |
|
Patients ≥ 70 years, n (%) |
187 (52·4) |
53 (52·5) |
72 (52·2) |
62 (52·5) |
0·97 |
|
Gender, n (%) |
|||||
|
Male |
188 (52·7) |
60 (59·4) |
66 (47·8) |
62 (52·5) |
0·98 |
|
Female |
169 (47·3) |
41 (40·6) |
72 (52·2) |
56 (47·5) |
|
|
Place of residence, n (%) |
|||||
|
Urban |
151 (42·3) |
42 (41·6) |
63 (45·7) |
46 (39·0) |
0·36 |
|
Rural |
205 (57·4) |
58 (57·4) |
75 (54·3) |
72 (61·0) |
|
|
Missing |
1 (0·3) |
1 (1·0) |
0 (0) |
0 (0) |
|
|
Patients with former malignancies, n (%) |
|||||
|
Yes |
14 (3·9) |
4 (4·0) |
5 (3·6) |
5 (4·2) |
0·85 |
|
No |
336 (94·1) |
92 (91·1) |
132 (95·7) |
112 (94·9) |
|
|
Missing |
7 (2·0) |
5 (5·0) |
1 (0·7) |
1 (0·8) |
|
|
Tumor staging (UICC), n (%) |
|||||
|
Early tumor stages (0, I, and II) |
93 (26·1) |
25 (24·8) |
42 (30·4) |
26 (22·0) |
0·70 |
|
Advanced tumor stages (III and IV) |
219 (61·3) |
72 (71·3) |
81 (58·7) |
66 (55·9) |
|
|
Not applicable / missing |
45 (12·6) |
4 (4·0) |
15 (10·9) |
26 (22·0) |
|
|
Treatment intention, n (%) |
|||||
|
Curative |
155 (43·4) |
48 (47·5) |
63 (45·7) |
44 (37·3) |
0·56 |
|
Palliative |
157 (44·0) |
50 (49·5) |
67 (48·6) |
40 (33·9) |
|
|
Missing |
45 (12·6) |
3 (3·0) |
8 (5·8) |
34 (28·8) |
|
|
Therapy modalities, n (%)** |
|||||
|
Surgery |
128 (35·9) |
50 (49·5) |
62 (44·9) |
16 (13·6) |
0·003 |
|
Systemic medical therapy |
156 (43·7) |
50 (49·5) |
73 (52·9) |
33 (28·0) |
0·74 |
|
Best supportive care |
157 (44·0) |
45 (44·6) |
72 (52·2) |
40 (33·9) |
0·02 |
|
Missing |
73 (20·4) |
2 (2·0) |
11 (8·0) |
60 (50·8) |
- |
|
Diagnosis time point corresponding to lock- downs of 2020, n (%) |
|||||
|
Yes |
113 (31·7) |
36 (35·6) |
43 (31·2) |
34 (28·8) |
0·62 |
|
No |
244 (68·3) |
65 (64·4) |
95 (68·8) |
84 (71·2) |
|
|
Mean interval between diagnosis and therapy (SD), (days) |
17·8 (46·2) |
18·5 (59·8) |
16·3 (37·0) |
19·0 (42·1) |
0·74 |
|
Abbreviation: Interquartile range (IQR), Standard deviation (SD), Union Internationale Contre le Cancer (UICC). * p values for difference in mean between 2020 versus 2018 and 2019; ** more than one modality per patient possible. Significant p values (< 0·05) are highlighted (BOLD). |
|||||
Supplement-II, Table-VIII: Pancreatic cancer.
|
Variables |
Total cohort n = 240 |
Cohort of 2018 n = 50 |
Cohort of 2019 n = 94 |
Cohort of 2020 n = 96 |
p value* |
|
Median age at time of diagnosis (IQR), (years) |
70·8 (63·8-78·2) |
66·7 (60·5-76·0) |
71·6 (63·9-78·7) |
71·2 (64·4-78·8) |
0·73 |
|
Patients ≥ 70 years, n (%) |
127 (52·9) |
20 (40·0) |
55 (58·5) |
52 (54·2) |
0·75 |
|
Gender, n (%) |
|||||
|
Male |
153 (63·7) |
31 (62·0) |
63 (67·0) |
59 (61·5) |
0·55 |
|
Female |
87 (36·3) |
19 (38·0) |
31 (33·0) |
37 (38·5) |
|
|
Place of residence, n (%) |
|||||
|
Urban |
88 (36·7) |
23 (46·0) |
34 (36·2) |
31 (32·3) |
0·25 |
|
Rural |
152 (63·3) |
27 (54·0) |
60 (63·8) |
65 (67·7) |
|
|
Patients with former malignancies, n (%) |
|||||
|
Yes |
14 (5·8) |
2 (4·0) |
7 (7·4) |
5 (5·2) |
0·74 |
|
No |
221 (92·1) |
45 (90·0) |
87(92·6) |
89 (92·7) |
|
|
Missing |
5 (2·1) |
3 (6·0) |
0 (0) |
2 (2·1) |
|
|
Tumor staging (UICC), n (%) |
|||||
|
Early tumor stages (0, I, and II) |
47 (19·6) |
11 (22·0) |
21 (22·3) |
15 (15·6) |
0·39 |
|
Advanced tumor stages (III and IV) |
102 (42·5) |
21 (42·0) |
41 (43·6) |
40 (41·7) |
|
|
Not applicable / missing |
91 (37·9) |
18 (36·0) |
32 (34·0) |
41 (42·7) |
|
|
Treatment intention, n (%) |
|||||
|
Curative |
102 (42·5) |
21 (42·0) |
43 (45·7) |
38 (39·6) |
0·23 |
|
Palliative |
96 (40·0) |
25 (50·0) |
43 (45·7) |
28 (29·2) |
|
|
Missing |
42 (17·5) |
4 (8·0) |
8 (8·5) |
30 (31·3) |
|
|
Therapy modalities, n (%)** |
|||||
|
Surgery |
79 (32·9) |
19 (36·0) |
41 (43·6) |
19 (19·8) |
0·11 |
|
Radiotherapy |
7 (2·9) |
2 (4·0) |
2 (2·1) |
3 (3·1) |
0·45 |
|
Systemic medical therapy |
83 (34·6) |
19 (38·0) |
36 (38·3) |
28 (29·2) |
0·32 |
|
Watch & Wait / Active surveillance |
70 (29·2) |
22 (44·0) |
29 (30·9) |
19 (19·8) |
0·49 |
|
Best supportive care |
64 (26·7) |
6 (12·0) |
15 (16·0) |
43 (44·8) |
- |
|
Missing |
|||||
|
Diagnosis time point corresponding to lock- downs of 2020, n (%) |
|||||
|
Yes |
91 (37·9) |
24 (48·0) |
36 (38·3) |
31 (32·3) |
0.34 |
|
No |
149 (62·1) |
26 (52·0) |
58 (61·7) |
65 (67·7) |
|
|
Mean interval between diagnosis and therapy (SD), (days) |
24·8 (47·8) |
18·1 (27·3) |
25·9 (48·5) |
27·5 (55·4) |
0·53 |
|
Abbreviation: Interquartile range (IQR), Standard deviation (SD), Union Internationale Contre le Cancer (UICC). * p values for difference in mean between 2020 versus 2018 and 2019; ** more than one modality per patient possible. Significant p values (<0·05) are highlighted (BOLD). |
|||||
Supplement-II, Table-IX: Hepatocellular and hepatobiliary cancer.
|
Variables |
Total cohort n = 81 |
Cohort of 2018 n = 19 |
Cohort of 2019 n = 31 |
Cohort of 2020 n = 31 |
p value* |
|
Median age at time of diagnosis (IQR), (years) |
64·9 (49·4-78·4) |
63·4 (51·2-71·9) |
63·2 (51·6-79·2) |
65·3 (46·6-79·4) |
0·87 |
|
Patients ≥ 70 years, n (%) |
29 (35·8) |
5 (26·3) |
10 (32·3) |
14 (45·2) |
0·17 |
|
Gender, n (%) |
|||||
|
Male |
43 (53·1) |
10 (52·6) |
17 (54·8) |
16 (51·6) |
0·83 |
|
Female |
38 (46·9) |
9 (47·4) |
14 (45·2) |
15 (48·4) |
|
|
Place of residence, n (%) |
|||||
|
Urban |
25 (30·9) |
5 (26·3) |
9 (29·0) |
11 (35·5) |
0·48 |
|
Rural |
56 (69·1) |
14 (73·7) |
22 (71·0) |
20 (64·5) |
|
|
Patients with former malignancies, n (%) |
|||||
|
Yes |
3 (3·7) |
0 (0) |
3 (9·7) |
0 (0) |
0·17 |
|
No |
78 (96·3) |
19 (100) |
28 (90·3) |
31 (100) |
|
|
Tumor staging (UICC), n (%) |
|||||
|
Early tumor stages (0, I, and II) |
13 (16·0) |
2 (10·5) |
5 (16·1) |
6 (19·4) |
0·65 |
|
Advanced tumor stages (III and IV) |
26 (32·1) |
8 (42·1) |
8 (25·8) |
10 (32·3) |
|
|
Not applicable / missing |
42 (51·9) |
9 (47·4) |
18 (58·1) |
15 (48·4) |
|
|
Treatment intention, n (%) |
|||||
|
Curative |
67 (82·7) |
14 (73·7) |
26 (83·9) |
27 (87·1) |
0·74 |
|
Palliative |
6 (7·4) |
2 (10·5) |
2 (6·5) |
2 (6·5) |
|
|
Missing |
8 (9·9) |
3 (15·8) |
3 (9·7) |
2 (6·5) |
|
|
Therapy modalities, n (%)** |
|||||
|
Surgery |
60 (74·1) |
13 (68·4) |
24 (77·4) |
23 (74·2) |
0·95 |
|
Radiotherapy |
16 (19·8) |
4 (21·1) |
3 (9·7) |
9 (29·0) |
0·09 |
|
Systemic medical therapy |
11 (13·6) |
3 (15·8) |
6 (19·4) |
2 (6·5) |
0·14 |
|
Best supportive care |
23 (28·4) |
5 (26·3) |
7 (22·6) |
11 (35·5) |
0·25 |
|
Missing |
5 (6·2) |
1 (5·3) |
2 (6·5) |
2 (6·5) |
- |
|
Diagnosis time point corresponding to lock- downs of 2020, n (%) |
|||||
|
Yes |
25 (30·9) |
13 (63·2) |
7 (22·6) |
6 (19·4) |
0.16 |
|
No |
56 69·1) |
7 (36·8) |
24 (77·4) |
25 (80·6) |
|
|
Mean interval between diagnosis and therapy (SD), (days) |
34·6 (61·0) |
43·3 (85·4) |
33·5 (64·1) |
30·3 (37·0) |
0·64 |
|
Abbreviation: Interquartile range (IQR), Standard deviation (SD), Union Internationale Contre le Cancer (UICC). * p values for difference in mean between 2020 versus 2018 and 2019; ** more than one modality per patient possible. Significant p values (< 0·05) are highlighted (BOLD). |
|||||
Supplement-II, Table-X: Sarcoma.
Discussion
To our knowledge, COMA-19 is the first study where real-world short- and long-term consequences of the COVID-19 pandemic were studied according to pre-specified objectives. With a surface area comparable to that of Israel, Saxony-Anhalt is the eighth largest federal state in Germany with more than two million inhabitants. The state has the highest cancer incidence and the oldest population in Germany [24, 25]. For quality control, only patients diagnosed and treated in the certified cancer centers were included. This represented 27·4% of the estimated 14413 new diagnoses per year in the state [26]. Both 2018 and 2019 were included as comparators to avoid the accommodation of only one-year which can influence the value of the annual percent change and challenge the interpretation of the trend measure and its association with risk factors. The four most common entities included were cancers of the female breast, followed by lung, prostate, and colorectal cancer which represented half of the overall burden of cancer in COMA19 and is similar to cancer burden in Europe [27]. The number of new cancers by age and gender was comparable to what is known [25, 27].
In contrast to other reports, the number of newly-diagnosed cases in 2020 for most entities was not impacted by the pandemic even though, similar to the literature, a temporarily disrupted oncological care in higher restriction periods (lockdowns) was documented [38, 11-16, 18]. Indeed, some tumor sites such as head and neck, hepatocellular, and renal cancers were even more frequently diagnosed in 2020. The pandemic-related drop in melanoma and non-melanoma skin cancers goes along with previous observations [13].
The lack of a pandemic dependent triage of patients according to age, gender, or place of residence and the absence of delayed therapy were encouraging facts. It is well known that even a four weeks delay of cancer treatment is associated with increased mortality in various cancers [28].
Indeed, the interval between diagnosis and therapy for most tumor sites in 2020 was curtailed compared to 2018 and 2019. This likely reflected a foresight of the medical staff to deliver health services as early as possible amid the pandemic ambiguities such as upcoming viral outbreaks and further political and/or public health restrictions. Overall, radiotherapy was offered constantly over the years. Yet, there was a modest decline in surgery and systemic therapies of 4% each in 2020. Comparison with other studies is problematic because of the heterogeneity of data and the different periods of time evaluated.
Finally, literature on follow-up rates are limited. Our 60% quotient in 2020, though less than the rates of the pre-pandemic years, suggests that follow-up was basically maintained.
The largely positive short-term results of cancer management in our study highlight the enormous efforts the oncology community undertook to maintain cancer care under an unprecedented pandemic and gave hope that the long-term consequences would not be too devastating.
Regrettably, this turned out not to be true. Despite a shorter follow-up time for patients diagnosed in 2020, EFS and TTP were significantly inferior compared to patients diagnosed in 2018 and 2019. Although statistically not yet significant, overall survival also tended to be less favorable. Even if this negative outcome was not observed across all tumor sites, the four most common entities (breast, lung, prostate, and colorectal cancers) were amid the ten cancer types associated with at least one inferior outcome measure. The alterations in the 2020 treatment patterns (more palliative intentions, less surgeries, or less systemic therapies) for several tumor sites were identified as a key reason accounting for the negative outcome. These changes in treatment patterns most likely were the result of a mixture of unavoidable but also some unnecessary pandemic- and non-pandemic-related reasons.
An optimal outcome depends both on a timely and evidence-based therapy. Thus, it is not surprising that the 2020 shortened interval between diagnosis and treatment could not compensate the shift in treatment patterns in terms of OS, EFS, or TTP.
Three limitations merit mentioning. First, though a large number of patients were available for follow-up, sample size calculation and power were primarily based on the number of newlydiagnosed patients and not outcome. It must be remembered that unknown confounders can ultimately only be controlled with randomization which is not an option in this field of research. Second, intention, type, and number of active tumor therapies were documented but data regarding application sequence, dosing, delay, and or adaption was not collected. As these are additional relevant aspects in the treatment pathway influencing long-term outcome, granularity is essential to make a final judgment to the impact of the pandemic on treatment patterns and outcome. This is currently being investigated. Third, although no differences in the cause of death (tumor-related versus non-tumor-related) were found between the three study years, COVID-19 infections, both in patients and medical staff (quarantine), and their exact impact on treatment modification and long-term outcome were out of the scope of this study.
Conclusion
This real-world study shows that in addition to safeguarding optimal patient access to oncological care and maintaining constant numbers of newly-diagnosed patients under a pandemic, minor modifications in the delivery of cancer therapy, even in high-quality specialized cancer centers in a high-economic region, could have negative consequences on the long-term outcome of patients with potentially curable cancers. Disseminating goodquality real-world data, even with upsetting findings, is crucial for the oncology community, public health services, and policymakers to create awareness and draw lessons to weather future pandemics. Prioritization of available medical capacities to only one sector is always on the expense of other vulnerable sectors including oncology. Hasty recommendations modifying evidence-based management guidelines must be critically reflected and priorities for cancer therapy meticulously triaged (e. g. a reasonable delay in the management of low-risk tumors such as some dermatologic cancers is not likely to impact outcome as was the case in our study). Finally, resilience is a responsibility that can’t be delegated.
Acknowledgments
The COVID-19 study was funded by the East German Study Group for Hematology and Oncology (OSHO). We would like to thank Andreas Wienke for his expertise in providing biometric and statistical advice on the COMA-19 study. Nadja Jäkel supported us in the preparation of figures. In the cancer centers, Manuela Dawid, Elke Decker, Sandra Ehlert, Janin Ehrenberg, Nadine Ernst, Silke Heller, Sandra Haeupke, Janine Herbarth, Sabina Huseynova, Sarah Kolbitz, Katja Maertins, Katrin Losse, Manuela Oelschlaeger, Kathleen Riedel, Alexander Gabriel Schaefer, Nicole Schmidt-Boenicke, and Sylvana Uhlig were helpful in providing the data. Without their support, data collection would not have progressed so quickly.
Ethical Considerations: The protocol was submitted to and approved by the ethics committees and registered in the German Registry for Clinical Trails (DRKS00027370).
Declaration of interests: All authors declare no conflicts of interests.
Contributors
HKAA is the Chief Investigator of the COMA-19 study and has overall responsibility for the study and was involved in the conceptualisation, data curation, data interpretation, formal analysis, funding acquisition, methodology, supervision, validation, visualisation, writing – original draft, and writing – review and editing. SS was involved in the conceptualisation, data curation, data interpretation, formal analysis, investigation, methodology, project administration, software, supervision, validation, visualisation, writing – original draft, and writing review and editing. She had directly accessed and verified the underlying data reported in the manuscript. PFS was involved in data collection, data interpretation, software, validation, writing – original draft, and writing review and editing. LE was involved in data collection, data interpretation, validation, and writing review and editing. FS, BO, LT, CK were involved in data collection and gave access to the local databases, writing – review and editing. The authors were not precluded from accessing data in the study and they accept responsibility to submit for publication.
Data Sharing:
Application for access to de-identified participant data can be made to the Krukenberg Cancer Center (susann.schulze2@ukhalle.de). All data access applications will be considered on their individual merits and by consensus of the investigators and the OSHO headquarters. If applications are approved there will be no limitations on the length of time that the data are available. Data will be made available after publication of this Article. A data sharing agreement between the researcher or institutions would then be set up before release of the approved data.
References
- WHO. Coronavirus disease (Covid-19) pandemic.
- Liang W, Guan W, Chen R, Wang W, Li J, et al. (2020) Cancer patients in SARS-CoV-2 infection: a nationwide analysis in China. Lancet Oncol 21: 335–7.
- Dinmohamed AG, Cellamare M, Visser O (2020) The impact of the temporary suspension of national cancer screening programmes due to the COVID-19 epidemic on the diagnosis of breast and colorectal cancer in the Netherlands. J Hematol Oncol 13:147.
- Mathelin C, Ame S, Anyanwu S (2021) Breast Cancer Management During the COVID-19 Pandemic: The Senologic International Society Survey. Eur J Breast Health 17:188–96.
- Scheidt-Nave C, Barnes B, Beyer AK, Busch M A, Hapke U, et al. (2021) Care for the chronically ill in Germany-the challenges during the COVID-19 pandemic. J Health Monit 5: 2–27.
- Kaufman HW, Chen Z, Niles J, Fesko Y (2020) Changes in the Number of US Patients With Newly Identified Cancer Before and During the Coronavirus Disease 2019 (COVID-19) Pandemic. JAMA Netw Open 3: e2017267.
- Kaufman HW, Chen Z, Niles JK, Radcliff J, Fesko Y (2021) Patterns of Prostate-Specific Antigen Testing and Prostate Biopsies During the COVID-19 Pandemic. JCO Clin Cancer Inform 5:1028–33.
- COVIDSurg Collaborative. Effect of COVID-19 pandemic lockdowns on planned cancer surgery for 15 tumour types in 61 countries: an international, prospective, cohort study. Lancet Oncol 22:1507–17.
- Aapro M, Lyman GH, Bokemeyer C, Rapoport B L, Mathieson N, et al. (2021) Supportive care in patients with cancer during the COVID-19 pandemic. ESMO Open 6:100038.
- American Society of Clinical Oncology. Cancer screening, diagnosis, staging, and surveillance.
- The Surveillance, Epidemiology, and End Results (SEER) Program (National Cancer Institute). Impact of COVID on the April 2023 SEER Data Release.
- Dinmohamed AG, Visser O, Verhoeven RHA, Louwman M W J, van Nederveen F H, et al. (2020) Fewer cancer diagnoses during the COVID-19 epidemic in The Netherlands. Lancet Oncol 21:750–1.
- Kleemann J, Meissner M, Ozistanbullu D, Balaban U, Old O, et al. (2022) Impact of the Covid-19 pandemic on melanoma and nonmelanoma skin cancer inpatient treatment in Germany - a nationwide analysis. J Eur Acad Dermatol Venereol 36: 1766–73.
- Skovlund CW, Friis S, Dehlendorff C, Nilbert MC, Mørch LS (2021) Hidden morbidities: drop in cancer diagnoses during the COVID-19 pandemic in Denmark. Acta Oncol 60:20–3.
- Laurent L, Brugel M, Carlier C, Clere F, Bertrand A, et al. (2022) Oneyear COVID-19 outcomes on the oncology care patient pathway: Results of a French descriptive, cross-sectional comprehensive study (ONCOCARE-COV). Cancer Med 11:4865–79.
- Marques NP, Silveira DMM, Marques NCT, Martelli DRB, Oliveira EA, et al. (2021) Cancer diagnosis in Brazil in the COVID-19 era. Semin Oncol 48:156–9.
- Arndt V, Doege D, Frohling S, Albers P, Algul H, et al. (2023) Cancer care in German centers of excellence during the first 2 years of the COVID-19 pandemic. J Cancer Res Clin Oncol 149:913–9.
- De Santis KK, Helmer S, Barnes B, Kraywinkel K, Imhoff M, et al. (2023) Impact of the COVID-19 pandemic on oncological care in Germany: rapid review. J Cancer Res Clin Oncol 149:14329–40.
- Lai AG, Pasea L, Banerjee A, Hall G, Denaxas S, et al. (2020) Estimated impact of the COVID-19 pandemic on cancer services and excess 1-year mortality in people with cancer and multimorbidity: near real-time data on cancer care, cancer deaths and a population-based cohort study. BMJ Open 10: e043828.
- Maringe C, Spicer J, Morris M, Purushotham A, Nolte E, et al. (2020) The impact of the COVID-19 pandemic on cancer deaths due to delays in diagnosis in England, UK: a national, population-based, modelling study. Lancet Oncol 21:1023–34.
- Reinacher-Schick A, Ebert MP, Piso P, Huppe D, Schmitt J, et al. (2023) Effects of the Pandemic on the Care of Patients With Colorectal Cancer. Dtsch Arztebl Int 120: 545–52.
- von Elm E, Altman DG, Egger M, Pocock S J, Gotzsche P C, et al. (2008) The Strengthening the Reporting of Observational Studies in Epidemiology (STROBE)statement: guidelines for reporting observational studies. J Clin Epidemiol 61:344–9.
- Blitzstein JK, Hwang J (2014) Introduction to Probability. Chapman &Hall / CRC ISBN 978-1-4665-7557-8.
- Statista. Länder & Regionen: Sachsen-Anhalt 2023.
- Krebs in Deutschland für 2019/2020 (14th Edition). Robert KochInstitut and Gesellschaft der epidemiologischen Krebsregister in Deutschland e.V. (Eds.) 2023, ISBN 978-3-89606-323-6.
- Klinische Krebsregister Sachsen-Anhalt GmbH (Hrsg.), Krebs in Sachsen-Anhalt – Diagnosejahre 2020-2021.
- Ferlay J, Colombet M, Soerjomataram I, Dyba T, Randi G, et al. (2018) Cancer incidence and mortality patterns in Europe: Estimates for 40 countries and 25 major cancers in 2018. Eur J Cancer 103:356–87.
- Hanna TP, King WD, Thibodeau S, Jalink M, Paulin G A, et al. (2020) Mortality due to cancer treatment delay: systematic review and metaanalysis. BMJ 371:m4087.
© by the Authors & Gavin Publishers. This is an Open Access Journal Article Published Under Attribution-Share Alike CC BY-SA: Creative Commons Attribution-Share Alike 4.0 International License. Read More About Open Access Policy.