Renoprotective and Antioxidant Effects of Methanol Extract and Fraction of Oxytenanthera abyssinica Leaf in Diabetic Nephropathy in Rats
by Komi Sagnan Atchrimi1,2,4*, Atèhèzi Tougoma1,4, Samuel Odu Odeh1, Gideon Umezurike Egesie 1, Simeon Omale 2,3, Komlan Batawila5
1Department of Human Physiology, University of Jos, Nigeria
2Diabetes Research Group, Africa Centre of Excellence on Phytomedicine Research and Development (ACEPRD), University of Jos, Nigeria
3Department of Pharmacology, University of Jos, Nigeria
4Physiopathology, Bioactive Substances and Innocuity Research Unit (PBSI), University of Lomé, Togo
5Systematics and conservation of biodiversity (SCB), University of Lomé, Togo
*Corresponding author: Komi Sagnan Atchrimi, Department of Human Physiology, University of Jos, Plateau State, Nigeria. Citation: Atchrimi KS, Tougoma A, Odeh SO, Egesie GU, Omale S, et al. (2026) Renoprotective and Antioxidant Effects of Methanol Extract and Fraction of Oxytenanthera abyssinica Leaf in Diabetic Nephropathy in Rats. J Med Biomed Discoveries 8: 148. DOI: https://doi.org/10.29011/2688-8718.100148.
Received Date: 24 December, 2025
Accepted Date: 20 Janaury 2026
Published Date: 24 January 2026
Abstract
Background: Diabetic nephropathy is a major life-threatening complication in diabetic individuals. The present study investigated the protective effects and the antioxidant activity of Met-E and Met-F from Oxytenanthera abyssinica leaf. An oral dose of 400 mg/kg of Met-E and Met-F were administered during four weeks to diabetic rats. The diabetic nephropathy was experimentally evidenced by an increase in renal function markers’level (SGlu, BUN, UAlb, SCr), changes in the levels of renal oxidative stress markers (MDA, SOD, GSH, CAT) and severe alteration in kidney tissue. Results: Met-E and Met-F significantly decreased SGlu and Ualb levels in diabetic rats while a non-significant effect was recorded in BUN and SCr level compared to diabetic control. Met-E significantly decreased MDA levels and total SOD activity, but it increased instead GSH level and CAT activity. Met-F increased GSH level and decreased total SOD activity level while no decrease in MDA level or increase in CAT activity was observed. Renal tissue histology showed reduced inflammatory cells and improved renal vasculature in Met-E treated kidney than Met-F treated one. Conclusion: Met-E and Met-F of O. abyssinica showed both ameliorative effects in diabetic nephropathy. However, Met-E would demonstrate higher antioxidant and renal protection effects than its counterpart.
Keywords: Diabetic nephropathy; Met-E; Met-F; Renal function; Oxidative stress; Oxytenanthera abyssinica
Introduction
Kidney is an important organ, responsible of the elimination of blood soluble wastes and sustainability of water and electrolyte balances in the body. Unfortunately, 20 to 40% of diabetic mellitus (DM) patients develop diabetic nephropathy (DN) during their lifetime [1]. Among the various and complex mechanisms implicated in DN complications, the conditions such as: the persistent hyperglycaemia-inducing polyol and hexosamine pathways activation, the excess/inappropriate activation of protein kinase C (PKC) isoforms, the increase in reactive oxygen species (ROS), the advanced glycated end-products (AGEs) and pro-inflammatory cytokines production are the major causative and development factors [2,3]. Studies reported that kidney oxidative stress and chronic inflammation contribute equally to the development and progression of DN [4]. The increase oxidative stress results in imbalance of mitochondrial redox activities, followed by the activation of caspases and depletion of cellular antioxidant enzymes to promote further excessive reactive oxygen species (ROS) formation, DNA fragmentation and cellular apoptosis [2,5]. The inflammatory processes revealed in DN pathogenesis are NF-kB activation-based cascade reactions [6] with monocytes infiltration and injuries in the glomeruli and tubules [7]. Consequently, inflammatory response, thickening of basement membranes, expansion of mesangial matrix and interstitial fibrosis, hypertrophy and glomerular epithelial cell loss occur and result in increased albuminuria and renal dysfunction [8,9]. Clinically, increased albuminuria and decreased metabolic wastes elimination are good indexes of DN [10]. The treatment protocol of the disease includes predominantly diabetes control and lowering high blood pressure. Indeed, studies described angiotensin converting enzyme inhibitors (ACEIs) agents as adequate and effective treatment against DN progression [11]. However, health workers encounter difficulties to manage successfully DN due to the complexity of the involved mechanisms and the absence of early symptoms. Hence, in the absence of reliable and effective allopathic drug therapies, plants remedies are being extensively used as alternative medicines for better control and management of diabetic nephropathy [12]. Togo and Sub-Saharan Africa as well as other parts of the world have very rich history of herbal medicine used since decades against ailments in human. Studies have confirmed that secondary metabolites of plants are diversified low molecular weight compounds with wide range of biological properties through interaction with proteins, nucleic acids and various membrane receptors [13]. Therefore, plant derivatives are increasingly getting attention in drug development domains as to date; more than 50 % of all drugs in clinical use are either natural products or their derivatives [14].
More studies need to be carried out to improve medicinal plant’s use in our communities where a plant remedy can be used to treat a broad spectrum of diseases. Indeed, the seeds of Nigella sativa (Ranunculaceae) is traditionally used as an anti-inflammatory, antioxidant, anticancer, nephroprotective, hepathoprotective, antidiabetic, anti-ulcer, antiseptic, immunomodulatory and analgesic remedy [15]. In addition, the leaf extract of Ginkgo biloba (Ginkgoaceae) known for its antioxidant activities relying mainely on bilobalide (terpenoids), quercetin and kaempferol (flavonoids) are used in the management of cancer, neurodegenerative and cardiovascular disease [16]. In order to develop phytopharmaceuticals to improve human healthcare, many studies have evaluated and confirmed the antioxidants properties of some common plants used as home therapy or food. This include studies on Amaranthus hybridus (Linn.) (Amaranthaceae) leaf, seed or whole plant used for its anti-viral, anti-bacterial, anti-fungal and anti-inflammatory properties; Allium sativum L. (Amaryllidaceae) bulb or whole plant used in the treatment of atheroclerosis, hyperlipidemia, hypertension, diabetes mellitus, bacterial infections, cancer, fever, dyspepsia, intestinal worms and tuberculosis; Vernonia amygdalina ( Asteraceae ) leaves used to treat dysentery, gastrointestinal tract disorders [17]. The use of bamboo leaf is very common in Chinese, Indian and Japanese food as well as in both traditional and modern medicine, and investigations on bamboo species for other applications such as food additives have been documented [18,19]. In Sub-Saharan Africa where O. abyssinica (Poaceae), a bamboo species is endemic, the leaves of the plant are being used as remedy against DN symptoms mainly polyurea, albuminuria [19]. Early studies mentioned that extracts of bamboo leaf could ameliorate cell apoptosis mechanisms associated with DN pathogenesis [20]. Meanwhile, though extracts of O. abyssinica have been documented for their antioxidant capacity and antidiabetic activities [21,22], no study has yet investigated their possible effects in DN. The protective effects of methanol extract and fraction of O. abyssinica against renal oxidative stress and dysfunction are presented in this study.
Materials and Methods
Chemicals and drug
Alloxan monohydrate, methanol, ethyl-acetate, n-hexane and ethyl ether (Sigma Aldrich Chemical Co., St. Louis, MO, USA), D-glucose and Sodium Chloride (BDH/Merck, Poole, UK); Vasotec (Enalapril, Merck & Co. UK), Accu-check glucometer active (Roche Diagnostics Co., Mannheim, Germany), Distilled water (ACEPRD, University of Jos, Jos, Nigeria), Ellman reagents and TBA (BDH Laboratory supplies, Poole Dorset BH 15 1TD, UK); hydrogen peroxide (DE-SHALOM Pharm. Lab. Ltd OkeOye Osun State, Nigeria); GSH (Loba Chemie Wodehouse Road, Mumbai, India).
Plant material
O. abyssinica fresh leaves were collected from Kpéwa, Togo in December 2018 and authenticated by Professor Atsu K. GUELLY in Botany and Plant Ecology Laboratory, Faculty of Sciences, University of Lomé, Togo. A voucher specimen of Herbarium accession No: TOGO15189, was deposited in the herbarium of the Department of Botany. The leaves were shade dried and then powdered. Extract and fractions preparation The extraction was carried out with 500 g of the powder soaked in 2.5 L of 80% methanol in a glass jar. The mixture was macerated under periodic agitation for 72h at room temperature and filtrated. A direct exhaustive and successive fractionation was carried out on another 500 g of the powder using solvents with increase polarity (n-hexane, ethyl acetate and methanol). The filtrates were concentrated under reduced pressure in the Buchi rotavapor R-200. The methanol extract (Met-E) and methanol Fraction (Met-F) were collected and stored in a glass container at -4°C till further use.
Animal material
Animals Male Albino Wistar rats of 4 weeks age were purchased from animal experimental unit of University of Jos. They were put into clear and dry cages and housed at room temperature with 12 h light/dark cycle in the same animal experimental unit where they were allowed free access to laboratory standard chow and tap water for 6 weeks. The rats weighing between 170-200 g were selected and used in the experiments.
Experimental design
Diabetic was induced by single intraperitoneal injection of 150 mg/kg body weight (b.w.) of alloxan monohydrate (ALX) freshly prepared in normal saline. After 48 h, the serum glucose (SGlu) level of the rats was checked using Accu-Check Active glucometer (Roche, Germany). Rats with SGlu level ≥200 mg/dL were selected as diabetics and included in the study when they were still confirmed diabetics 4 weeks after the injection. For the experiment, animals were separated into metabolic cages which were numbered according to the grouping method and each group comprised of 3 rats. The Non-diabetic control or Normoglycaemic control (NGC) group (G1) and the Diabetic control (DC) group (G2) were orally given distilled water while groups: G3, G4 and
G5 were orally given once daily Met-E (400 mg/Kg b.w.), Met-F (400 mg/kg b.w.) and Enalapril (10 mg/kg b.w.) respectively for 27 days. At the end of the experiment on the 28th day, 24 hours urine was collected through the metabolic cage system and blood samples were collected from jugular vein immediately after the rats were euthanized by decapitation under 40% ethyl ether anaesthesia to avoid stress condition. Both kidneys were removed. The right kidney tissues were rinsed thoroughly with normal saline then weighed, minced and a homogenate was prepared with 1 g/ 4 mL (w/v) of the tissue in another phosphate-buffered saline (0.1 mol/L, pH 7.4) to get proteins extracted. The homogenate was separated into two portions and the first portion was used to estimate: Malondialdehyde (MDA) and reduced glutathione (GSH) levels. The second portion was centrifuged (6000g; - 4°C) for 20 min to obtain post-mitochondrial supernatant which was used to estimate superoxide dismutase (SOD) and catalase (CAT) activities. The left kidney tissues were fixed in 10 % formalin for histopathological investigations.
Serum Glucose and renal function biomarkers
Serum glucose (SGlu), serum creatinine (SCr), urine albumin (Ualb) and blood urea nitrogen (BUN) from serum urea were determined using the automatic Cobas c111 biochemistry analyser (Roche) in the biochemistry laboratory of Plateau Special Hospital, Jos, Plateau State.
Estimation of MDA products level
Lipid peroxidation was assessed in terms of MDA formation, according to the method of Varshney and Kale [23]. The absorbance was measured against blank at 532 nm. MDA formed (mmol/mg protein) was calculated using the molar extinction coefficient of 1.56x10⁵M-1Cm-1.
Renal antioxidants estimation
GSH level was estimated by the method of Beutler and Yeh [24], CAT activity measured through the breakdown of hydrogen peroxide was determined according to Sani et al. [25] method. The SOD activity was estimated based on the ability of the enzyme to inhibit the auto-oxidation of epinephrine at pH 10.2 using the method of Misra and Fridovich [26]. The unit of SOD activity is defined as the enzyme required for 50% inhibition of adrenaline auto-oxidation. Renal protein contents estimation The total protein content in the kidney was estimated by means of Biuret method as described by Gornall et al. [27]. Histopathological investigations The renal histopathology study was assessed to evaluate the oral administration effect of the Met-E and the Met-Fon the renal tissues of 8 weeks diabetic rats. The study was done based on the methods previously described [28,29]. Tissues were processed, paraffin embedded and sections were stained in Harris’ haematoxylin and counterstained in 1% aqueous eosin for examination under light microscope.
Renal protein contents estimation
The total protein content in the kidney was estimated by means of Biuret method as described by Gornall et al. [27].
Histopathological investigations
The renal histopathology study was assessed to evaluate the oral administration effect of the Met-E and the Met-F on the renal tissues of 8 weeks diabetic rats. The study was done based on the methods previously described [28,29]. Tissues were processed, paraffin embedded and sections were stained in Harris’ haematoxylin and counterstained in 1% aqueous eosin for examination under light microscope.
Statistical data analysis
GraphPad Prism software version 8.0.1 (San Diego, California USA) was used for data analysis. Difference between groups were analysed using one-way analysis of variance (ANOVA) followed by Dunnett’s t-test for multiple comparisons. The results are expressed as mean ± SEM (n=3) and difference between groups were considered significant at p<0.05.
Results
Serum glucose and renal function biomarkers
The effect of the treatments on the evaluated renal function parameters is summarised in table 1. The DC rats showed a significant (p<0.001) increase of 271.91% (19.86±1.59 mmol/L) in SGlu level versus NGC rats (5.34±0.37 mmol/L). Four weeks administration of Met-E and Met-F to diabetic rats resulted in a significant (p<0.05) decrease in SGlu: 54.23% (9.09±2.39 mmol/L) and 55.94% (8.75±2.95 mmol/L) respectively. The
results in Enalapril-treated rats revealed a non-significant (p>0.05) decrease of SGlu level (14.39±2.48 mmol/L) as compared to DC (19.86±1.59 mmol/L). A Significant (p<0.0001) increase of 156.18% (12.86±1.36 g/L) in Ualb level was observed in DC versus values in NGC group (5.02±0.58 g/L). A Significant (p<0.0001) decrease in Ualb level was recorded with Met-E: 74.96% (3.22±0.13 g/L), Met-F: 72.94% (3.48±0.12 g/L) and Enalapril: 68.90% (4±0.29 g/L) after administration versus diabetic control (12.86±1.36g/L). The DC rats showed a significant (p<0.0001) increase of 197.48% (46.08±0.4 g/L) in BUN level versus values in NGC rats (15.49±1.3 g/L). Administration of Met-E, Met-F and Enalapril resulted in a slight and non-significant (p>0.05) decrease in BUN level versus DC rats. A slight and non-significant (p>0.05) increase in SCr level was observed in DC animals and no decrease effect was exerted after Met-E or Met-F administration. Nevertheless, Enalapril treated group showed a slight decrease in SCr level which was not significant (p>0.05).
Table 1: Effect of treatments on UAlb, SCr, BUN and SGu after 28 days treatment
|
Treatment |
Ualb (g/L) |
SCr (µmol/L) |
BUN (g/L) |
SGlu (mmol/L) |
|
Non-diabetic
control |
5.02±0.58 |
33.86±1.20 |
15.49±1.30 |
5.34±0.37 |
|
Diabetic Control |
12.86±1.36b |
38.86±2.36 |
46.08±0.40a |
19.86±1.59a |
|
Met-E
400 mg/kg |
3.22±0.13*** |
38.86±2.36 |
34.21±2.52 |
9.09±2.39* |
|
Met-F 400 mg/kg |
3.48±0.12*** |
38.86±2.36 |
36.35±0.90 |
8.75±2.95* |
|
Enalapril
10 mg/kg |
4.00±0.29*** |
38.86±2.36 |
33.70±2.35 |
14.39±2.48 |
The values are expressed as mean ± SEM (n=3). ap<0.001; bp<0.0001 (Diabetic Control vs Non-Diabetic Control). *p<0.05 and ***p<0.0001 (Treated vs Diabetic Control).
Effect of treatment on MDA products formation
Alloxan-induced diabetic rats showed a significant (p<0.0001) increase of 232.56% (1.43±0.09 mmol/mg protein) in MDA level compared to NGC rats. The administration of Met-E exhibited a significant (p<0.001) decrease of 50.35% (0.71±0.12 mmol/mg protein) in MDA level compared to DC rats while the decrease observed in Met-F was not statistically significant. The administration of Enalapril also showed a significant (p<0.001) decrease of 53.15% (0.67±0.10 mmol/mg protein) in MDA level when compared to DC rats (Figure 1).
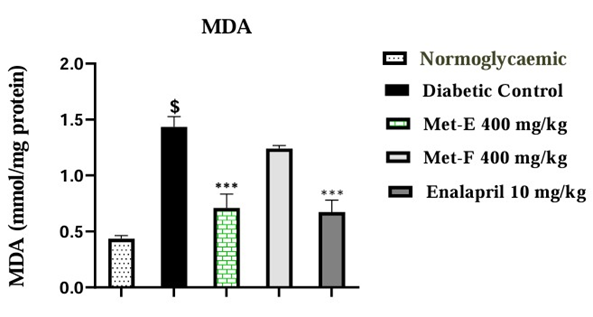
Figure 1: Effect of MET-E and MET-F on MDA level. The values are expressed as mean ± SEM (n=3). $p<0.0001 (Diabetic Control vs Normoglycaemic); ***p<0.001 (Treated vs Diabetic control).
Effect of treatment on SOD activity
A significant (p<0.05) increase of 114.81% (1.16± 0.25 unit/mg protein) in SOD activity was observed in diabetic untreated rats compared to NGC rats. Administration of Met-E, Met-F and Enalapril exhibited a significant (p<0.05) decrease of 50.86% (0.57±0.09 unit/mg protein), 56.90% (0.50±0.04 unit/mg protein) and 62.93% (0.43±0.11 unit/mg protein) respectively in SOD activity when compared to Diabetic Control rats (Figure 2).
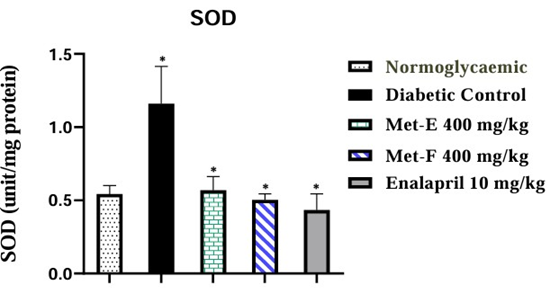
Figure 2: Effect of treatment on SOD activity. The values are expressed as mean ± SEM (n=3). *p<0.05 (Diabetic control vs Normoglycaemic and Treated vs Diabetic control).
Effect of treatment on GSH level
GSH values were significantly (p<0.0001) decreased by 68.52% (15.59±1.73) in diabetic untreated rats compared to NDC rats.
GSH activity was significantly (p<0.05) increased by 85.18% (28.87±1.81) in diabetic rats after Met-E Administration. The administration of Met-F and Enalapril caused a significant (p<0.001) increase of 123.22% (34.80±3.0) and 143.43% (37.95±4.55) respectively compared to diabetic control rats (Figure 3).
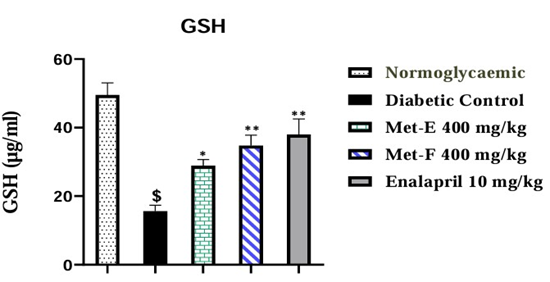
Figure 3: Effect of treatment on GSH level. The values are expressed as mean ± SEM (n=3). $p<0.0001 (Diabetic control vs Normoglycaemic); *p<0.05 and **p<0.01 (Treated vs Diabetic control).
CAT activity
The diabetic untreated rats showed significant (p<0.001) decrease of 53.95% (189.07±9.02 µg/ml) in CAT activity compared to NGC. The administration of Met-E showed a significant (p<0.001) increase of 134.95% (444.22±39.66 µg/ml) in CAT activity compared to diabetic control. No significant increase was observed in Met-F and Enalapril-treated rats (Figure 4).
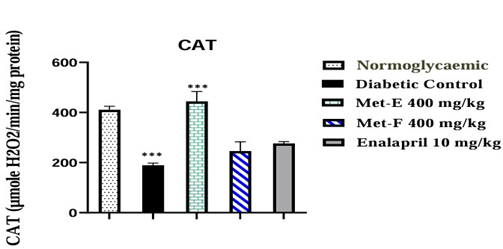
Figure 4: Effect of treatment on CAT activity. The values are expressed as mean ± SEM (n=3). ***p<0.001 (Diabetic control vs Normoglycaemic and treated vs Diabetic Control).
Histopathology Assessment
The effect of treatment on the histology of the kidney of the experimental rats was shown in (Figure 5). The kidney section from normal rat presented normal morphology with intact cell nuclei (white arrowheads) surrounded by intact cytoplasmic content. The glomeruli (white stars) were numerous and clearly surrounded by a capsular space (black arrowheads). The glomerular capsules (black arrows) were also intact with their characteristic simple squamous epithelial cells. The convoluted tubules (white arrows) and their epithelial lining were normal (A0). ALX has induced a significant renal damage evidenced in diabetic untreated (DC) rats by loss of tissue components and architecture (black arrows) with severe glomerular congestion and degeneration, severe inflammatory cells (white stars) infiltration and necrosis (A1). A section of the kidney of diabetic rats treated with Met-E showed the presence of glomeruli (white stars) with reduced capsular space as a result of hypertrophy and minor inflammatory cells (white arrows) within the tissue compared to DC. Tissue exhibited also the presence of few red blood cells (white arrowheads) and clear presence of tubules (black arrows) (A2). A Section of the kidney of diabetic rats treated with Met-F showed tissue degeneration with massive loss of tissue components. However, minor infiltration of inflammatory cells (black arrows) was displayed compared to DC and some necrosis spaces remained empty(black arrowheads). The glomeruli (white stars) are hypertrophied and congested with red blood cells (white arrows) (A3). A Section of the kidney of diabetic rats treated with Enalapril showed tissue degeneration with massive loss of tubular morphology (White arrows). Infiltration of inflammatory cells (white arrowheads) also appeared within the tissue but minor than DC. Interspersing the necrotic tissue were normal cells presented with normal nuclei (black arrows) surrounded by intact cytoplasmic components (A4).
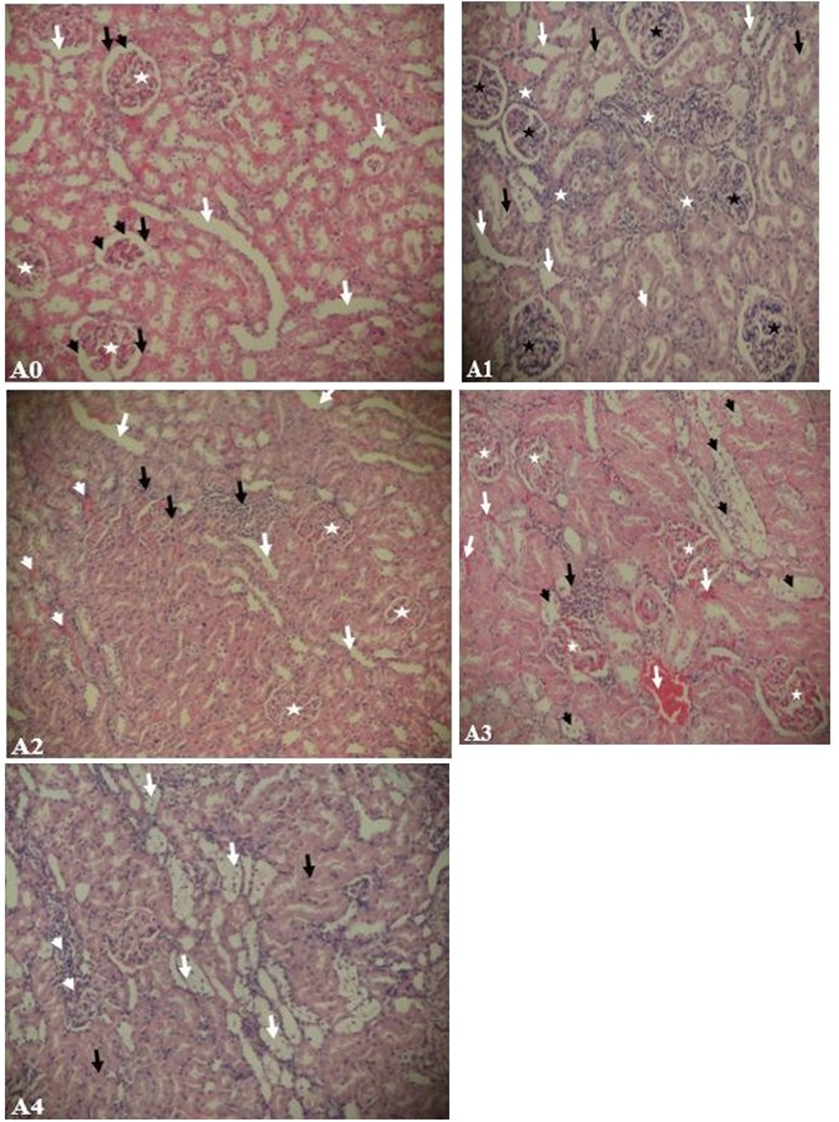
Figure 5: Kidney histology of 18-week old rats. (A0) non-diabetic rat exposed to normal nutritional and environmental conditions, (A1) eight weeks untreated diabetic rat exposed to normal nutritional and environmental conditions, (A2) eight weeks diabetic rat treated with Met-E, (A3) eight weeks diabetic rat treated with Met-F, (A4) eight weeks diabetic rat treated with Enalapril. H&E: (A1, A2, A3, A4) x100
Discussion
Progressive impairment in renal function to an end-stage renalfailure is recurrent in diabetic individuals. This study was designed to investigate the protective effects of Met-E and Met-F of O. abyssinica leave in ALX-induced DN in rat. Eight weeks after exposure to alloxan, SGlu, BUN and Ualb were found considerably higher with a slight increase in SCr level in diabetic control rats than the values in NGC rats (Table 1). In harmony with literature, an increase of such biochemical parameters are typical characteristics of ALX-induced DN [30,31]. In addition, ALX injection exhibited pathological changes in kidney tissue architecture and integrity, which were marked by severe tissue degeneration, glomerular congestion and severe tissue inflammation (Figure 5-A1). The damages might be attributed to an increase of oxidative stress and inhibition of antioxidant defence in the tissues.
After four weeks treatment with once daily oral administration initiated at the end of the fourth week, both Met-E and Met-F reduced significantly SGlu and UAlb levels in diabetic rats while there was no significant effect on BUN and SCr levels (Table 1). The remarkable elevated albuminuria in DC rats could be explained by a worsening of renal damage leading to macroalbuminuria in diabetic rats. The results showed that the standard drug, enalapril significantly reduced Ualb level similarly like Met-E and Met-F. Albuminuria indeed, is a primary most important index of renal failure. In accordance with previous studies [32], the decrease to closely normal values of Ualb level observed in diabetic rats after treatment with Met-E and Met-F suggests that the treatments might exert nephroprotective effects by ameliorating the regulation of albumin excretion. This could be interesting since the nephroprotective effect of ACEIs by improving albumin excretion was documented [33].
Met-E and Met-F may possibly prevent or improve DN by inhibiting the initiation or development of stress factor processes or ameliorating the permeability of the glomerular basement membrane to albumin [34]. The non-significant decrease in BUN level and unnoticeable changes in SCr level in our study is a tangible similarity with the reported effect of enalapril that decreases proteinuria in rats without any changes in creatinine clearance [35]. Though their mechanisms of action are yet to be investigated, Met-E and Met-F might affect more or less the renal haemodynamic system. Indeed, from the histological results (Figure 5-A2 & A3), one can suggest that both Met-E and Met-F would have improved renal blood flow and decreased hypoxia in a diabetic-treated kidney unlike in DC. However, the haemorrhage and delay in tissue recovery showed in (Figure 5-A3) revealed that four weeks administration of Met-F did not significantly enhance kidney vasculature and diminish capillary resistance caused by the chronic hyperglycaemia over the first 4 weeks.
Eight weeks after the onset of experimental diabetes, MDA level was significantly elevated in diabetic kidney’s homogenate (Figure 1) compared to normal kidney. This data is consistent with the idea of persistent hyperglycaemia caused lipid peroxidation mediated DN through increased ROS generation [7]. High glucose-induced oxidative stress would therefore play a key role in the pathogenesis of diabetes complications in human and animals [36,37]. Following alloxan injection in an experimental study, the alloxan metabolite, dialuric acid is autoxidized to alloxan intermediate radicals and generates oxidative stress biomarkers such as hydrogen peroxide, hydroxide and superoxide radicals via iron catalyst in pancreas, kidney and liver [38,39]. Most studies reported an increase in MDA level and decrease in GSH level as well as in SOD and CAT activities in diabetic kidneys due to ROS over production. The significant increase in MDA level and decrease in CAT activity as well as GSH level in diabetic kidneys in this study comply with previous reports [40,41] except SOD enzyme activity, which was controversial.
Indeed, SOD is a complex enzyme with three isoforms such as Cu/Zn-SOD (cytosolic SOD or SOD1), Mn-SOD (Mitochondrial SOD or SOD2) and EC-SOD (extracellular Cu/Zn-SOD or SOD3) identified in mammals [42]. The assay of SOD carried out in our study typically reflects the evaluation of total SOD (tSOD) enzyme activity. Ali et al. [43] also observed an increase in tSOD level in a diabetic kidney. Hence, the increase of tSOD activity might refer to renal disease progression caused by hyperglycaemia-induced an increase of ROS production. However, several reports state differences in isoforms’ contribution in total SOD activity. Indeed, Kakkar et al. [44] reported a decrease in MnSOD activity which may result in tubular injury and progression of DN independently of the observed significant increase in tSOD activity. Later, Hong et al. [45] also reported that EC-SOD might be a major contributor in scavenging ROS in a diabetic kidney. Therefore, SOD might not probably be a such reliable index of successful antioxidant activity in DN. In support to this opinion, our results indicate that the increase in tSOD activity in diabetic kidneys might be due to an upregulation of some of the isoform’s expression. The MDA level was significantly reduced after administration of Met-E and enalapril but not Met-F. This indicates that Met-E might attenuate lipid peroxidation through inhibition of the oxidative stress and could attest the similarities between the effects of Met-E and ACEIs, known to inhibit thiobarbituric acid reactive substances (TBARS) production in experimental diabetic kidney [46]. SOD level is normalized in diabetic kidneys of all treated rats. This showed an antioxidant effect of the treatments which would have scavenged oxygen radicals including superoxide anion (02-), the main SOD enzyme substrate and major activator [47]. The increase of both MDA and SOD levels in the diabetic kidney in this study could demonstrate a stage of an early renal disease development and progression that would be sustained by inflammatory mechanisms [48]. The inflammation processes caused by alloxan might be altered by Met-E as well as Met-F and enalapril which additionally increased noticeably GSH activity (Figure 3) while Met-E only was revealed significant to boost CAT activity (Figure 4).
The study revealed that Met-E was more effective in DN animal model than Met-F and the ACEIs agent. The antioxidant effect of Met-E of O. abyssinica leaves is documented [20,22] but none seems yet to exist about the plant’s methanol fraction. Both Met-E and Met-F possess phytochemicals such as polyphenols, tannins and alkaloids. However, a preliminary phytochemical study revealed that Met-F unlike Met-E would be particularly with less steroids and would not possess terpenoids while the fraction would be richer in saponins than Met-E [49]. Consequently, the greater antioxidant activity effectiveness obtained with Met-E suggest that terpenoids and steroids of the plant leaves might also possess antioxidant properties while saponins present in the Met-F may not really be endowed with such properties. The lack of large spectra of antioxidant action with Met-F could be related to the less antiinflammatory activities and delay in the tissue recovery (Figure 5-A4) compared to the effect of Met-E (Figure 5-A3).
Limitations of the study
This study has some limitations. Indeed, it has shown that treatment with Met-E or Met-F ameliorate renal function and kidney injuries in a rat model of DN. However, the precise mechanism of actions by which those fractions achieves their effects remains unclear. Though Met-E exerted more nephroprotective effects than Met-F in this experimental animal model, the chemical differences between them in terms of analytical and spectrometic analysis were not carried out in order to demonstrate the evidence of the charactirized compounds endowed with such antioxidant properties. The study has also revealed that the treatments have affected the activity of SOD enzymes. However, the evaluation of the effect of Met-E and Met-F on SOD activity in terms of tSOD appeared to be quite weak to elucidate the real underlying interactions that are involved. Further investigations would be needed to bring more clarity to the controversial results in this study and to understand the involved mechanisms.
Conclusion
The study concludes that both Met-E and Met-F of O. abyssinica leave could control hyperglycaemia and ameliorate diabetic nephropathy progression. However, the most important renoprotectieve activity revealed by Met-E shows that the crude methanol extract could be the best renoprotective supplementation from O. abyssinica leaves.
Acknowledgments
The authors are thankful to the University of Jos Animal experimental unit employees for all the support given to us during this work.
Ethical Considerations
The study protocol was in accordance with the principles approved by the ethical committee animal experimental unit of University of Jos, Nigeria (reference number: UJ/FPS/F17-00379).
Conflict of Interests
The authors have declared no conflict of interests.
References
- Dronavalli S, Duka I, Bakris GL (2008) The pathogenesis of diabetic Nature Clin Pract Endocrinol Metab 4(8): 444–452.
- Kishore L, Kaur N, Singh R (2017) Nephroprotective effect of Paeonia emodi via inhibition of advanced glycation end products and oxidative stress in streptozotocin–nicotinamide induced diabetic nephropathy. J Food Drug Anal 25(3): 576–588.
- Fukami K, Yamagishi S, Ueda S, Okuda S (2008) Role of AGEs in Diabetic Nephropathy. Curr Pharm Des 14(10): 946–952.
- Brownlee M (2005) The pathobiology of diabetic complications: A unifying mechanism. Diabetes 54(6): 1615–1625.
- Dewanjee S, Gangopadhyay M, Sahu R, Karmakar S (2013) Cadmium induced pathophysiology: Prophylactic role of edible jute (Corchorus olitorius) leaves with special emphasis on oxidative stress and mitochondrial involvement. Food Chem Toxicol 60: 188-198.
- Sun YM, Su Y, Li J, Wang LF (2013) Recent advances in understanding the biochemical and molecular mechanism of diabetic nephropathy. Biochem Biophys Res Commun 433(4): 359-361.
- Lee HB, Yu MR, Yang Y, Jiang Z, Ha H (2003) Reactive oxygen species-regulated signaling pathways in diabetic nephropathy. J Am Soc Nephrol 14(3): 241–245.
- Forbes JM, Coughlan MT, Cooper ME (2008) Oxidative stress as a major culprit in kidney disease in diabetes. Diabetes 57(6): 1446–1454.
- Horie K, Miyata T, Maeda K, Miyata S, Sugiyama S, et al. (1997) Immunohistochemical colocalization of glycoxidation products and lipid peroxidation products in diabetic renal glomerular lesions. Implication for glycoxidative stress in the pathogenesis of diabetic nephropathy. J Clin Investig 100(12): 2995–3004.
- Almdal TP, Vilstrup H (1988) Strict insulin therapy normalises organ nitrogen contents and the capacity of urea nitrogen synthesis in experimental diabetes in rats. Diabetologia 31(2): 114-118.
- Lewis EJ, Hunsicker LG, Bain RP, Rohde RD (1993) The effect of angiotensin-convertingenzyme inhibition on diabetic nephropathy. N Engl J Med 329(20): 1456-1462.
- Gayathri M, Kannabiran K (2008) Antidiabetic and ameiorative potential of Ficus bengalensis bark extract in streptozotocin induced diabetic rats. Indian J Clin Biochem 23(4): 394-400.
- Wink M (2015) Modes of action of herbal medicines and plant secondary metabolites. Medicine 2(3): 251-286.
- Tekwu EM, Beng VP, Kuete V (2013) African medicinal plants acting on the reproductive, cardiovascular, and central nervous systems. Medicinal Plant Research in Africa 805-841.
- Ali BH, Blunden G (2003) Pharmacological and toxicological properties of Nigella sativa. Phytotherapy Research 17(4): 299-305.
- Zafar F, Asif HM, Shaheen G, Ghauri AO, Rajpoot SR, et al. (2023) A comprehensive review on medicinal plants possessing antioxidant potential. Clinical and Experimental Pharmacology and Physiology 50(3): 205-217.
- Nwozo OS, Effiong EM, Aja PM, Awuchi CG (2023). Antioxidant, phytochemical, and therapeutic properties of medicinal plants: A review. International Journal of Food Properties 26(1): 359-388.
- Koide CL, Collier AC, Berry J, Panee J (2011) The effect of bamboo extract on hepatic biotransforming enzymes–Findings from an obese– diabetic mouse model. Journal of ethnopharmacology 133(1): 37-45.
- Tewari S, Patel M, Debnath AV, Mehta P, Patel S, et al. (2022) Bamboo leaf extract ameliorates radiation-induced genotoxicity: An in vitro study of chromosome aberration assay. Journal of Herbal Medicine 31: 100528.
- Ying C, Mao Y, Chen L, Wang S, Ling H, et al. (2017) Bamboo leaf extract ameliorates diabetic nephropathy through activating the AKT signaling pathway in rats. Int J Biol Macromol 105(1): 1587-1594.
- Ezeja MI, Omeh YS, Mbagwu C (2014) Antidiabetic potientials of methanol leaf extract of Oxytenanthera abyssinica. International Journal of Diabetes in Developing Countries 34(2): 116 -120.
- Yessoufou A, Gbenou J, Grissa O, Hichami A, Simonin AM, et al. (2013) Anti-hyperglycemic effects of three medicinal plants in 14 diabetic pregnancy: Modulation of T cell proliferation. BMC Complement Altern Med13(1): 77.
- Varshney R, Kale RK (1990) Effects of calmodulin antagonists on radiation-induced lipid peroxidation in microsomes. Int J Radiat Biol 58(5): 733-743.
- Beutler E, Yeh MKY (1963) Erythrocyte glutathione reductase. Blood 21(5): 573-585.
- Sani M, Sebaï H, Gadacha W, Boughattas NA, Reinberg A, et al. (2006) Catalase activity and rhythmic patterns in mouse brain, kidney and liver. Comp Biochem Physiol Part B Biochem Mol Biol 145(34): 331-337.
- Misra HP, Fridovich I (1972) The role of superoxide anion in the autoxidation of epinephrine and a simple assay for superoxide dismutase. J Biol Chem 247(10): 3170-3175.
- Gornall AG, Bardawill CJ, David MM (1949) Determination of serum proteins by means of the biuret reaction. J Biol Chem 177(2): 751-766.
- Choji T, Ngokere A, Ogenyi S, Kumbish P (2015) Histo-architechtural Evaluation of Conventional Versus Two Rapid Microwave Processing Techniques. Br Biotechnol J 8(3): 119.
- Avwioro GO (2011) Staining reactions of microwave processed tissues compared with conventional paraffin wax processed tissues. European J Exp Biol 1(1): 57-62.
- Sharma B, Siddiqui MS, Ram G, Yadav RK, Kumari A, et al. (2014) Rejuvenating of Kidney Tissues on Alloxan Induced Diabetic Mice under the Effect of Momordica charantia. Adv Pharm 2: 1-9.
- El-Demerdash FM, Yousef MI, El-Naga NIA (2005) Biochemical study on the hypoglycemic effects of onion and garlic in alloxan-induced diabetic rats. Food Chem Toxicol 43(1): 57-63.
- The Diabetes Control and Complications Trial (DCCT) Research Group (1995) Effect of intensive therapy on the development and progression of diabetic nephropathy in the Diabetes Control and Complications Trial. Kidney Int 47(6): 1703-1720.
- Marre M, Passa P, Chatelier G, Menard J (1989) Prevention of diabetic nephropathy with enalapril. Br Med J 298(6671): 459-460.
- Qiao Y, Gao K, Wang Y, Wang X, Cui B (2017) Resveratrol ameliorates diabetic nephropathy in rats through negative regulation of the p38 MAPK/TGF-β1 pathway. Exp Ther Med 13(6): 3223-3230.
- Sugimoto KI, Tsuruoka S, Fujimura A (2001) Effect of enalapril on diabetic nephropathy in OLETF rats: The role of an anti-oxidative action in its protective properties. Clin Exp Pharmacol Physiol 28(10): 826-830.
- Sepici-Dincel A, Açikgöz Ş, Çevik C, Sengelen M, Yeşilada E (2007) Effects of in vivo antioxidant enzyme activities of myrtle oil in normoglycaemic and alloxan diabetic rabbits. J Ethnopharmacol 110(3): 498-503.
- Baynes JW, Thorpe SR (1996) The role of oxidative stress in diabetic complications. Curr Opin Endocrinol Diabetes Obes 3(4): 277-284.
- Ighodaro OM, Adeosun AM, Akinloye OA (2017) Alloxan-induced diabetes, a common model for evaluating the glycemic-control potential of therapeutic compounds and plants extracts in experimental studies. Medicina 53: 365-374.
- Mathews CE,Leiter EH (1999) Constitutive differences in antioxidant defense status distinguish alloxan-resistant and alloxan-susceptible mice. Free Radic Biol Med 27(34): 449-455.
- Mestry SN, Dhodi JB, Kumbhar SB, Juvekar AR (2017) Attenuation of diabetic nephropathy 15 in streptozotocin-induced diabetic rats by Punica granatum Linn. leaves extract. J Tradit Complement Med 7(3): 273-280.
- Sharma S, Kulkarni SK, Chopra K (2006) Curcumin, the active principle of turmeric (Curcuma longa), ameliorates diabetic nephropathy in rats. Clin Exp Pharmacol Physiol 33(10): 940-945.
- Forbes JM, Cooper ME (2013) Mechanisms of Diabetic Complications. Physiol Rev 93(1): 137-188.
- Ali DK, Oriowo M, Tovmasyan A, Batinic-Haberle I, Benov L (2013) Late administration of Mn porphyrin-based SOD mimic enhances diabetic complications. Redox Biol 1(1): 457-466.
- Kakkar R, Mantha SV, Radhi J, Prasad K, Kalra J (1997) Antioxidant Defense System in Diabetes Kidney: A Time Course Study. Life Sci 60(9): 667-679.
- Hong YA, Lim JH, Kim MY, Kim Y, Park HS, et al. (2018) Extracellular Superoxide Dismutase Attenuates Renal Oxidative Stress Through the Activation of Adenosine MonophosphateActivated Protein Kinase in Diabetic Nephropathy. Antioxid Redox Signal 28(17): 1543-1561.
- Kornatowska KZ, Luciak M, Blaszczyk J, Pawlak W (1998) Lipid peroxidation and activities of antioxidant enzymes in erythrocytes of patients with non-insulin dependent diabetes with or without diabetic nephropathy. Nephrol Dial Transplant 13(11): 2829-2832.
- Abbate M, Zoja C, Corna D, Capitanio M, Bertani T, et al. (1998) In progressive nephropathies, overload of tubular cells with filtered proteins translates glomerular permeability dysfunction into cellular signals of interstitial inflammation. J Am Soc Nephrol 9(7): 1213-1224.
- Usui HK, Shikata K, Sasaki M, Okada S, Matsuda M, et al. (2007) Macrophage scavenger receptor-A-deficient mice are resistant against diabetic nephropathy through amelioration of microinflammation. Diabetes 56(2): 363-372.
- Atchrimi KS, Tougoma A, Omale S, Batawila K, Egesie GU, et al. (2023) Antihyperglycemic Effects of Methanol Extract and Fractions of Oxytenanthera abyssinica Leaf (A. Rich.) Munro (Poaceae) in AlloxanInduced Diabetic Albino Wistar Rats. Journal of Drug Delivery and Therapeutics 13(2): 1-10.
© by the Authors & Gavin Publishers. This is an Open Access Journal Article Published Under Attribution-Share Alike CC BY-SA: Creative Commons Attribution-Share Alike 4.0 International License. Read More About Open Access Policy.