New Radiation Oncology Optimization Principles Based On In-Vivo Predictive Assay and Recent Developments in Molecular Radiation Biology
by Anders Brahme*
Department of Oncology-Pathology, Karolinska Institutet, Stockholm, Sweden.
*Corresponding author: Anders Brahme, Department of Oncology-Pathology, Karolinska Institutet, Stockholm, Sweden. Email: andersbrah@gmail.com
Received Date: 01 February 2024
Accepted Date: 05 February 2024
Published Date: 07 February 2024
Citation: Brahme A (2024) New Radiation Oncology Optimization Principles Based On In-Vivo Predictive Assay and Recent Developments in Molecular Radiation Biology. Ann Case Report 09: 1625. https://doi.org/10.29011/2574-7754.101625
Abstract
The recent understanding that most TP53-intact normal tissues are Low-Dose Hypersensitive (LDHS) and Low-Dose Apoptotic (LDA) implies that the well-known fractionation window at ≈ 2 Gy/Fr defines the optimal tolerance level for most organs at risk and not at all the tumor dose as still is customary today when using IMRT. This necessitates new approaches to biologically optimized radiation therapy, requiring that the maximum dose to organs at risk should be ≤2.3 Gy/Fr, and especially that it should be of low ionization density and LET. Today we know that the fractionation window is due to a low-dose initiation of full DNA repair capability in normal tissues first after ≈½ Gy, and we should use this acquired repair advantage to its full extent up to ≈2.3 Gy where the High Dose Apoptosis (HDA) may set in. Thus biologically optimized treatments should be focused on the application of a low number of high tumor-dose intensity- and/or radiation quality-modulated photon, electron or lower LET light ion beams. Doing so, reduces the integral dose delivery and the risk for secondary cancers and generates a real tumor cure without risk for caspase-3-induced accelerated tumor cell repopulation. The light ions should truly have the lowest possible LET in normal tissues to retain the fractionation window property but still have a high LET only in the gross tumor region to simultaneously maximize tumor cell inactivation. This necessitates the use of the lightest ions, from helium to ≈boron, as this fractionation advantage is practically lost for carbon and heavier ions. This unique property of the lightest ions is combined with the highest possible apoptosis and senescence in front of the Bragg peak and can best be characterized as allowing molecular radiation therapy since surrounding normal tissues are only exposed to a low dose and LET that causes easily repairable damage. Many other new associated ideas are also discussed, such as optimal use of IMRT, molecular tumor imaging with MRSI, PET-CT and phase contrast X-rays, TP53 cell survival radiation biology, biologically optimized radiation therapy: BIOART, quantum biology of curative radiation therapy, 4D-space-time radiation therapy optimization, influence of microdosimetric heterogeneity on the dose response relation, optimal time dose fractionation, accounting for tumor hypoxia, biologically optimal radiation quality, secondary cancer risks, mutant TP53 reactivation, and optimal dose delivery techniques since they are all involved directly or indirectly in these new principles for true optimization of radiation therapy.
Keywords: Optimal Dose Per Fractionation; Optimal Time Dose Fractionation; Microdosimetry of Dose Response; TP53 Cell Survival Biology; TP53 Reactivation; Optimal Radiation Quality; Therapy Optimization; Normal Tissue Tolerance, RadiationResistant Tumor Phenotype; Secondary Cancer Risk
Introduction
The interaction of beams of different ionizing radiation with living normal tissues and tumors is one of the most complex biomedical problems since it requires detailed knowledge about the atomic and nuclear physics of the therapeutic beams as well as the complex interaction of their generated secondary electrons, and the molecular biology of living tissues and cells including their complex damage repair systems [1-3]. Detailed knowledge about radiationinduced cellular damage and repair is the key to optimal safety in the therapeutic and diagnostic use and understanding of optimal high-quality radiation beams. Biologically optimized intensity-modulated photons, electrons, and light ions represent the ultimate development of radiation therapy today approaching the border of molecular radiation therapy, as illustrated in Figures 1 and 4 [4]. Interestingly, the imparted absorbed dose and biological effect distributions to normal tissues can be designed so they are as low as possible from a radiation physical point of view; at the same time, as their therapeutic effect on radiation-resistant tumor cells is as high as possible from a radiation biological point of view [4-6]. With the lightest ions above protons: He-B, the border region between the clinical gross tumor and the associated internal target volume due to tumor and tissue motions in relation to surrounding healthy normal tissues can be set as narrow as physically possible. In addition, the optimal number of treatment fractions can be substantially reduced, and the curative gain factor on radiation-resistant hypoxic tumor cells may generally be more than doubled compared to low ionization density photons, electrons, and protons. Figure 1 shows how the optimal selection of therapeutic beams can be arranged and the intensity and energy modulation is shaped to maximize the complication-free cure probability for the patient with minimal risk for side effects in normal tissues [2, 5, 6].
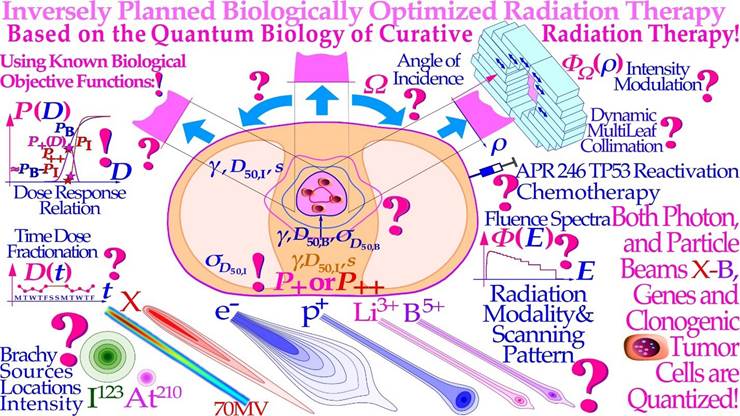
Figure 1: The fantastic power available by employing biologically optimized inversely planned radiation therapy where the intensity of each pencil beam can be directed and modulated to maximize the complication free cure [4, 6]. If the approximate sensitivity of the tumor can be determined from its response the first week of therapy and the normal tissue responses are generally quite well know from historical data (!; cf. Figures 10- 12, 23, [4, 5]), it is possible to derive the biologically optimal beam directions and their intensity modulation by dynamic multi leaf collimation or scanning pencil beams (? ; [5]). It is even possible to find the optimal combination of low and high ionization density radiation (cf. Figures 9, 14, 27 below) and their incident energy spectra as well as the ideal time dose fractionation pattern, Figure 20 [1-3], using the biologically optimized complication free cure (P+) or more complex optimization strategies (P++: P+ with concomitant constrained injury minimization [4, 5]). In addition, if we have information about the interaction of the radiation modalities of interest with other chemotherapeutic agents and compounds of preference, the combined treatment schedule can also be optimized in biological terms. During the last week of conventional curative treatment, only a hand full of tumor clonogens remains in the target volume, as indicated in the figure, and they should then preferably be treated with the most microscopically uniform and homogeneous electron or photon beams (cf. Figures 13 and 18). This is optimal since both the particle beams and the tumor cells are quantized, and thus, some tumor clonogens may be protected from lethal hits by the inevitable cold spots between the ions during the last few and normally most curative therapeutic dose fractions, Figures 13, 15, 18 [1-5]! This will be the optimal approach since the most severe hypoxia is generally gone, especially after a last weekend of effective homologous recombination repair and tumor cell reoxygenation such that an excessively elevated ionization density and LET (linear energy transfer) may no longer be necessary (cf Figure 21, [2]). Furthermore, the steepest possible dose response is achieved, and thus, the possibility of truly maximizing the complication-free cure as clearly demonstrated in Figures 18a, b and 25.
Interestingly, the present review brings in several new findings and understandings that strongly influence these processes in many important classical areas of interest that urgently need reconsideration. Based on directly observed clinical tumor reactions for the individual patient (In Vivo predictive assay) and historically established dose response parameters of most normal tissues (γ, D50, σ50, s, [6]) advanced biological therapy optimization is possible (Figure 1). Depending on the charge and mass of the particle beams, their fluence and ranges are exponentially absorbed for uncharged neutrons and photons, whereas electrons and light multiply charged ions have charge- dependent stopping powers due to electromagnetic interactions, and come to rest within a finite range in body tissues. Interestingly, in addition all ions similar to neutrons also have exponential attenuation due to their nuclear collisions, which severely reduces their fluence at a depth, especially for heavier ions beyond carbon (cf Figure 27 and [7]: Figure 8). This greatly influences their clinical usefulness for radiation therapy, as discussed in further detail in Figures 2 and 29 below. For example, the first study of Neon ions was less advantageous than initially expected due to their high nuclear attenuation. This resulted in high stopping power and fragmentation tails also in normal tissues, even though the high LET was a clear improvement for hypoxic tumors. The clinical situation was somewhat reminiscent of the problems facing neutron therapy ([7, 8], see Figures 14, 16, 29). In particular, the microdosimetric quantities in Figure 14 of different radiation therapy beams show that both carbon and particularly neon ion SOBP have too high biological effect in normal tissues both in the entrance, plateau region and behind the tumor in the fragmentation tail to be far from optimally suitable for radiation therapy. The same is surely true for oxygen ions located midway between C and Ne, and they have for some reason received high but unfortunately poorly motivated interest in recent years.
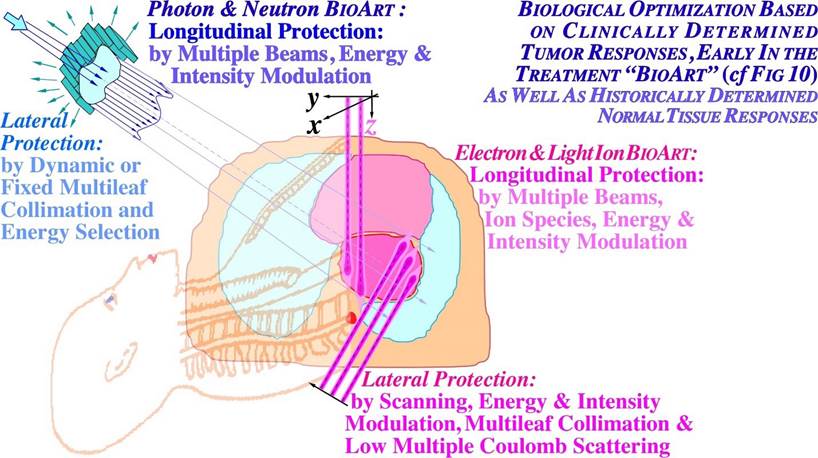
Figure 2: Illustration of the differences and similarities between biological optimization with neutral (photons and neutrons) and charged (electron and light ion) particle beams. Biologically optimized radiation therapy using the in vivo predictive-assay based BIOART approach is explained further in Figures 10-12. The light ions have advantages both with regard to attenuation, low multiple scattering penumbras and sharp practical ranges (cf [7]: Figures 7-10). Photon and neutron beams can mainly handle longitudinal protection by intensity modulation, whereas electrons and, in particular, light ions have finite practical ranges and the sharpest possible penumbras. To keep the energy deposition as low as possible in normal tissues, it is essential that the LET and attenuation be as low as possible in the entrance and plateau region of the beam dominated by “low dose radiation hypersensitive normal tissues”. This calls for the lightest ions, as also seen in Figures 27 and 29 below [2, 7]. Unfortunately, these facts have largely been neglected in modern carbon ion therapy losing the advantageous classic clinical fractionation window advantage (cf Figures 4, 6, 19, 20 [2, 3]).
High Resolution Molecular Tumor Imaging
Modern radiation therapy have reached sub mm precision in 3D absorbed dose delivery, and consequently, we also need this degree of accuracy in our diagnostic imaging techniques for true tumor localization. CT and MR have already reached this geometrical accuracy but not when we also require highly specific molecular tumor imaging. With MR, tumor-specific metabolite imaging still has a resolution of 10 to 15 mm, which could be reduced to the submm level by high field strength MRSI units (magnetic resonance spectroscopic imaging, Figure 3a, [4]). Dual energy CT may allow more tumor specific imaging, especially using molecular contrast agents but the ultimate development of 3D high resolution X-ray imaging probably may require the use of stereoscopic phase contrast flash X-rays. A potential sub mm to 10 μm, 1 msec resolution in live humans is then theoretically possible [4]: Figures 12 and 13. PET and PET-CT have reached ≈3-4 mm tumor-specific resolution in whole body imaging, and ultrasensitive PET units with a very large field of view may improve this significantly down to ≈1 mm with imaging times of a few minutes. This would even make positron diffusion unfolding feasible to further improve the geometric resolution (Figure 3b, [4]).
High Resolution Tumor Metabolite Imaging using 15 - 20 T Whole Body MRSI
With standard 3 Tesla MR units, the geometric resolution with tumor metabolite spectroscopic imaging is only ≈10 mm to 15 mm. This makes the diagnostic imaging of true tumor tissue substantially impaired, requiring larger setup margins and a significant increase in the irradiation of normal tissues will be necessary. At ≈15 Tesla, the geometric resolution with tumor metabolite imaging may reach ≈1 mm with substantial improvement in molecular spectral imaging for accurate radiation therapy planning. The highest field strength whole body MR unit at present is the 12 Tesla INUMAC system (cf. Figure 3a [9, 10]), developed in collaboration between French and German scientists mainly for brain studies with ≈1 mm resolution (http://phys.org/news/2013-10-world-powerful-mri-online.html [10] and a 14 Tesla system is being developed in China [11]). It should be possible to reduce the aperture somewhat from the present 900 mm of the INUMAC unit and use the latest type of high field strength tolerating windings to get into the 15 to 20 Tesla region with sub mm spectral resolution (cf lower middle insert in Figure 3a and [11]). To further improve the spectral resolution and reconstruction speed, the scanner should use the Fast Padè transform rather than the Fourier transform [4, 12]. This technique may further increase the effective magnetic field of the unit, which may be highly desirable for spectroscopic imaging. In Figure 3a, spectral metabolite imaging of a low-resolution prostate and high-resolution brain scanner shows a substantial improvement in the image resolution of a small-bore camera and the value of using alternative metabolites for accurate target volume definition and tumor confirmation [9]. Many further details on the new potential units have been discussed recently [13, 14].
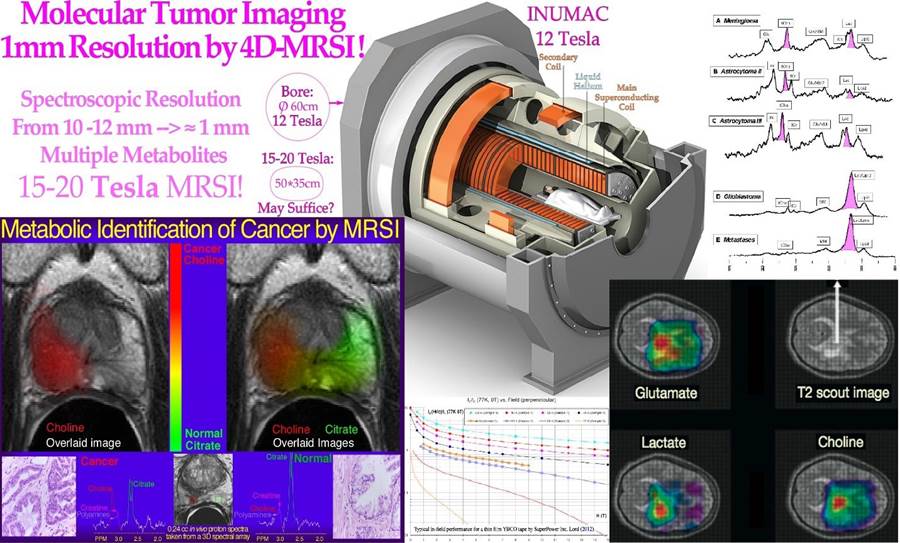
Figure 3a: MR spectroscopic imaging with different metabolites of a prostate and brain tumor (modified from [9, 10]). It is clearly seen that both choline and lactate give rather similar indications of gross tumor extension, and choline works well for the prostate to the left.
High Resolution Ultra-Sensitive Whole-Body Molecular PET Imaging
A third revolution in tumor imaging after CT and MR have been introduced by PET and PET-CT. Their unique ability to allow highly specific molecular imaging with positron emitting tracers has really improved tumor diagnostics. Unfortunately, the geometric resolution is only 3-4 mm in whole body cameras, whereas brain- and other small volume cameras may reach 1 mm and below already today. To obtain this kind of resolution, which is needed for accurate radiation therapy, it is desirable to decrease the crystal size and increase the sensitivity primarily by increasing the axial field of view from 15 cm to 25 cm to ≈120 cm. This will increase the sensitivity ≈ 50-fold and reduce the imaging time to a few minutes without needing to scan the patient or the camera to see the full extent of the disease (Figure 3b, [4]: Figure 7). Therefore, even if the cost increases by a factor of approximately four, it will be possible to substantially increase the patient throughput with the very short imaging times. Furthermore, it may become feasible to unfold random positron diffusion to improve resolution owing to the much higher number of registered local annihilation events. In addition, it will be important to correct for respiration dynamics, so one idea is to combine PET imaging in list mode with full 3D laser or projection camera optical imaging [17] so that each phase of the breathing cycle is fully synchronized with the PET data set. It may then even be possible to project all the PET data to one fixed position of the breathing cycle, for example, when simultaneous 4D CT data and projection camera data are available, not least when the 3 imaging data sets are fully integrated as in Figure 3b. With all these methods at work, a fast whole body camera may reach a resolution of ≈ 1 mm. The treatment could then be performed with breath hold in the phase where the complication-free cure of the treatment is maximized or by synchronizing treatment by a similar projection camera in the treatment room (cf Figure 36a). In fact, it could be most cost efficient if all diagnostic and therapeutic units were provided with projection cameras for Auto Set Up and full breathing cycle synchronization. This would allow almost perfect synchronization of all data sets whether using CT, MR or PET (cf Figures 36 a, b) for dose delivery and biological responsiveness imaging (Figures 10-12). With advanced imaging equipment, it would generally be much less cost efficient if two or more very expensive units were totally integrated. Often, they may not work simultaneously, and one unit may be prohibited from use when the other is working. Furthermore, we may need more than two data sets for many situations. What one may save is the setup of the patient at two different units, but with projection camera Auto Set Up this is a minor problem and there are still motion artifacts between the two diagnostic modalities even if the initial positioning is correct. The only other solution to all these simultaneousness problems would be ultrafast imaging (such as 3D flash phase contrast [6]) and dose delivery by all methods requiring accurate synchronization of all 4D diagnostic and therapeutic techniques (see Figure 36a, b). Obviously, some combined units have extra benefits such as PET-CT, but often the patient is changing position on such units between the two imaging sessions making accurate Auto Set Up even preferred, especially using 4D imaging synchronization procedures. Interestingly, today, this problem can be solved by fully integrated PET-CT units (Figure 3b [6]) since modern electronics allow the same detector to be used for CT and PET. Avalanche photo diodes, for example, can be run in a low voltage current mode for CT and then be driven on a high voltage single photon counting mode for PET. Furthermore, the open PET design [15,16] could be used to put a high contrast and resolution Phase Contrast CT, or even an ultrafast stereoscopic phase contrast X-ray unit in the middle of the PET camera where the PET sensitivity would also be maximal (almost doubled [4, 16] see also more recent ideas presented by UCD and LBL [18]).
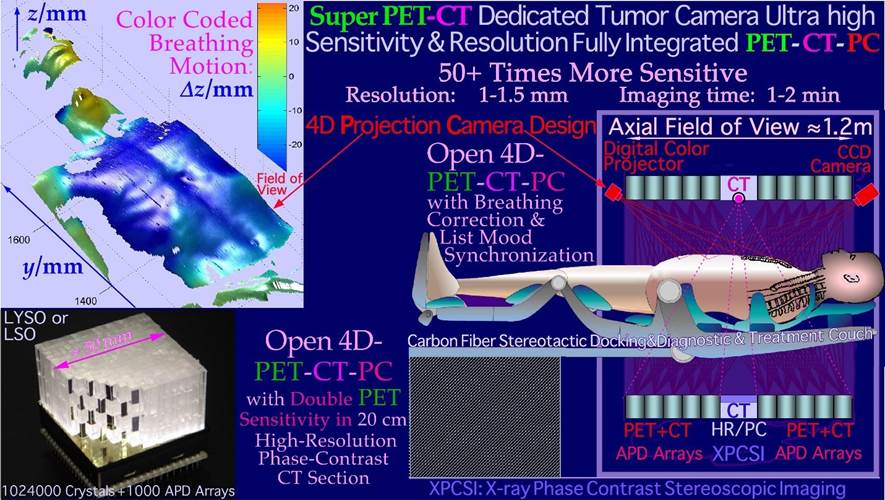
Figure 3b: Cross section through a dedicated high-resolution open 4D-PET-CT-PC tumor camera where a central opening is introduced to allow a high resolution in the unique CT region. The PET detectors may also detect peripheral CT photons but at a lower resolution sufficient for optimal PET reconstruction using CT attenuation data. The design may alternatively include a high-resolution stereoscopic phase contrast X-ray unit in the open PET configuration ([15, 16, 17] cf also Figure 10). To compensate for internal motions, a projection camera is also included to allow accurate unfolding of breathing motions based on a similarly registered 4D CT data set. Thanks to the 4D-PET-CT-PC with the Projection Camera, it would also allow projection of all breathing phases on the optimal phase for radiation therapy with full resolution and sensitivity in the PET image. In the treatment room, a similar camera could reproject the internal target volume on the skin surface of the patient as seen from the radiation source point of view in real time to show by augmented reality if the tumor is always covered by the collimator opening, as shown in Figure 36b.
Radiation Biology of TP53 in the Cell Survival of Tumors and Normal Tissues
The recent Repairable-Homologous-Repairable (RHR) damage formulation based on the interaction cross-sections for radiationinduced cellular inactivation, repair, misrepair and apoptosis in TP53 intact and mutant cell lines can be used to truly optimize radiation therapy. The newly understood tumor and normal tissue response characteristics requires renewed thinking about many aspects the biological optimization of radiation therapy. It has already been suggested that most TP53-intact normal tissues are generally LowDose Hypersensitive (LDHS, see lower left insert of Figure 4) and that the inherent microscopic heterogeneity of higher Linear Energy Transfer (LET) ion treatments the last week of treatment would benefit from a low LET round up, as shown in Figures 15, 18a, b, and 21 [1-3] below. The ability of the new method to quantify apoptosis [1] has helped identify the early Low-Dose Hypersensitivity (LDHS) and Low-Dose Apoptosis (LDA) of most normal tissues and tumors with intact TP53 and ATM genes. This mechanism has probably been developed by nature’s natural proses of preferential survival advantage select to ensure minimal risk for severe mutations to the genome before the DNA repair system is fully functional after a dose of ½ - 1 Gy [1-3, 19-21]. As a compensating measure, the apoptosis-inducing caspase 3 gene product (Figure 4 lower right) remarkably “remembers” this protective induced low dose apoptotic cell loss and starts cellular repopulation to reestablish homeostasis in the tissues after being irradiated. This useful mechanism in normal tissues, e.g., after accidental injury or irradiation or other damage, is a well-known problem after suboptimal radiation therapy where it can cause accelerated repopulation of remaining clonogenic tumor cells at the end of a treatment [22]. A clear curative intent is probably the principal way to avoid this tumor reactivating mechanism to just ensure normal tissue recovery. These studies also identified that maximum apoptosis is induced by the lowest LET ions largely as they have the highest fluence of δ -electron-induced apoptosis produced by the primary ions per unit dose [1, 6]. With a too high LET, apoptosis and senescence will instead be high in the normal tissues in front of and behind the tumor, which definitely is undesirable from a complication-free cure point of view, even if hypoxic tumors may marginally benefit from a high LET (cf Figures 27 and 29 below, [3, 7]). Modern carbon ion therapists has largely disregarded this elevated LET in normal tissues just because it is lower than at the Bragg peak but not as low as that of electrons and X-rays that is providing a significant normal tissue advantageous fractionation window (cf figures 6, 7, 19, 21)!
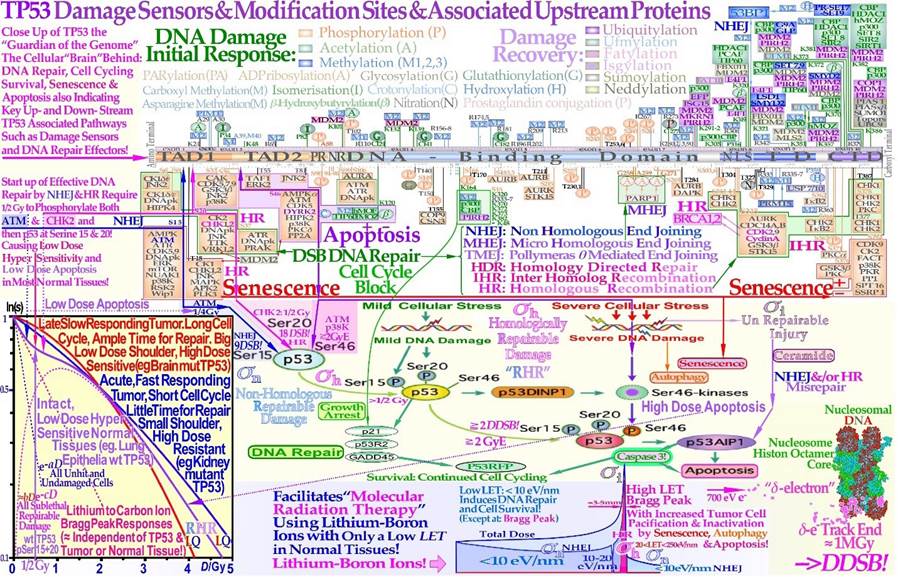
Figure 4: The guardian of the genome: TP53 largely determine the cellular response to different types of radiation [1-3, 6, 19-21]. Mild stress phosphorylates the serine 15 and 20 sites on p53 by ATM and CHK2, resulting in cell cycle block and DNA repair. This results in LDHS in normal tissues but generally not in tumors that often suffers a mutant TP53 gene, as seen in the cell survival insert. Local high doses and high ionization densities (LET) are resulting in DDSBs (Dual Double Strand Breaks see lower right corner [3, 4, 23, 24]) that increase the severity of the damage. Thus, phosphorylating the serine 46 site, e.g., via p38K or ATM, and a High-Dose Apoptotic (HDA) response may get triggered. DDSBs are the most common multiply damaged site and their probabilities are determining the biological effectiveness of different types of radiation as seen in Figures 9, 27, [24]. Lithium-Boron ions allow a unique therapeutic use by inducing massive apoptotic-senescent tumor cell response mainly within the Bragg peak (cf Figures 26, 27, σh: homologically repairable damage and σi: direct inactivation cross-sections [1]: Figure 8, [2]). In front of and beyond the Bragg peak, the LET is low, and nonhomologically easily repairable damage is mainly induced (σn: “NHEJ” cross-section [1]: Figure 8, [2]). This unique property of the lightest ions can best be characterized as molecular radiation therapy since the highest possible apoptosis and senescence can mainly be induced in a 5 mm size spot with mainly low dose and especially low LET in the surrounding normal tissues [1, 2, 6].
The increased flexibility of the new RHR formulation which is describing the shape of the cell inactivation probability has resulted in a significantly augmented description of the low- and high- dose apoptosis- and LET- induced cell kill, especially in TP53 normal and mutant tumors with increased survival and often mutant DNA repair-genes causing a low dose radiation resistant phenotype, (LDRR). It is well known that the nonhomologous end-joining (NHEJ, [1-3]) pathway is the dominating DNA repair process at low LET, and it is very fast. Ku70, Ku80, and a DNApk dimer bind together the broken DNA ends in a few seconds and simultaneously recruit p53 [19], such that the multiple DNA strand ends at high-dose and LET local damage can be repaired together in the right order except possibly for the δ - electron generated dual DSB (DDSB) [24]. This process is essential especially at high LET levels when the MRN dimer complex often replaces Ku-DNApk heterodimers not least if the cell is in the S or G2 phase of the cell cycle, and the homology-searching mechanism of Homologous Recombination (HR) is needed for high-fidelity repair [24, 25]. This makes HR more important than NHEJ at very high LETs, partly as less low- LET-type damage is induced ([1]: Figure 8 with three ions (B, C, and N) and three different cell lines, [26-29]:C), where the last reference [29] is a true molecular confirmation of the predictions of RHR formulation ([1]: Figure 8, [2]). Interestingly, the new repair formulation allows for the quantification of concurrent independent NHEJ and HR repair, as well as the HR repair of NHEJ misrepair, alone or concurrent with other ongoing HR repair processes. These new DNA repair terms (cf. lower left corner of Figure 4) make it possible to describe cellular repair far beyond the conventional Linear Quadratic model (LQ). Interestingly, the new DNA repair-based formulation inherently describes LDHS and LDA as they are linked to the DNA repair system of most, if not all, normal tissues, as described in more detail in Figure 4. This figure illustrates how the TP53 gene works as a complex cellular mastermind and controller by determining how the structure of DNA damage should best be repaired and whether senescence and apoptosis are needed, [1-3, 30-32]. DNA damage by ionizing radiation can induce augmented phosphorylation of three Serine sites (nr 15, 20, 46) cf [11]) on TP53, following the increase in the extent of damage through some of its key upstream proteins, such as ATM, CHK2, and p38K as well as 53BP1 or BRCA1,2 to signal whether the currently best repair process is going to be NHEJ or HR. Most experimental tumor cell lines suffer from a mutant TP53 gene, making the early/low dose (0.5- 1.5 Gy) radiation response more gradual without low-dose LDA and thus no LDHS. Thus making a low dose radiation resistant (LDRR) phenotype as shown in the tumor type cell survival insert in Figure 4 (cf also Figures 5-7 and the U1690 SCLC cell survival in Figure 33). As TP53 intact cells are irradiated, after ¼ Gy, ATM is autophosphorylated and in turn phosphorylates the serine 15 site on p53 trying to start NHEJ repair. After a total of ½ Gy or 18 DSBs, CHK2 is also phosphorylated and phosphorylates the serine 20 site on p53 to achieve fully efficient DNA repair with both HR and NHEJ up toward 1 Gy [1- 3, 19-21]. As seen from the lower left insert in Figure 4 and Figures 5 and 6, this last step results in a switch in normal tissue sensitivity from an initial LDHS stage before the full serine 15 and 20 phosphorylation of p53 generates a more radiation-tolerant state. In fact, the well-known experimental demonstration that the LDHS property can be eliminated by low-dose preirradiation is a clear indication that the first ½ Gy is needed to starts up efficient DNA repair. After that, the cellular repair system is fully activated and functional, with reduced cell loss and almost a survival plateau toward 2 Gy [1,2,15, 33- 36].
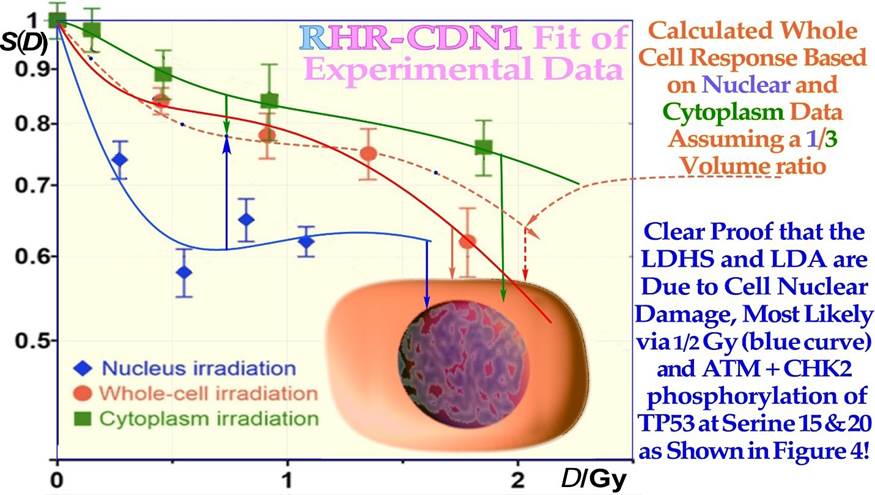
Figure 5: Demonstration that LDHS is a cell-nuclear phenomenon by avoiding cytoplasmic irradiation, and the LDA response is clearly strengthened. Cytoplasmic irradiation may react to direct mitochondrial damage, possibly partly through its maternal DNA, and with less p53, so it is likely a general phenomenon in most cells (Experimental data: [37] cf Figures 4, 6, 7, CDN1 is a Closest Distance Norm linear fit, not least square! [3]).
It is clear from Figures 4-6 that doses well above 2 GyE are needed for significant tumor cure, and the dose to normal tissues should be just above 2 Gy or below to ensure optimal radiation recovery, as clearly shown in Figure 7 with the pale blue dotted tangent line through the origin indicating the shallowest damage slope per unit dose to normal tissues. The LDA and LDHS of normal tissues are caused by 5- 15% acute low-dose apoptosis (Figures 4-7 and [1, 20, 21]), but interestingly, most likely, due to the compensating measure of caspase-3-induced cellular repopulation [24], late effects are therefore few as it try to compensate the apoptotic cell loss. This will re-establish homeostasis in normal tissues thus minimizes late normal tissue damage and generate a fractionation window, but it may sometimes also repopulate malignant tumor clonogens if they are not entirely eradicated by the treatment [24]. This means that LDA and LDHS truly protect normal tissues from potential low-dose mutations before NHEJ and HR are fully functional and can address the damage. Interestingly, the recent publication on DNA repair quantification using the RHR formulation demonstrated that this early low-dose cell loss before establishing full repair efficiency is mainly due to an intact TP53 gene in most normal tissues. The cell loss is due to LDA induction ([1]: Figures 7, 9 a, b and 12 a, c, d), in general agreement with [20, 21] and the present study’s Figure 4, but may also happen for those tumors that harbor intact TP53 and ATM related genes. This direct LDA and its associated LDHS is most likely a general property of intact normal tissues and the cells natural way to protect them self from low-dose, potentially cancerous, mutations before full DNA repair efficiency is established after ≈ ½ Gy [1,20, 36]. The normal therapeutic 2 Gy fractions generate 75 DSBs and possibly also one δ-electron generated dual DSB (DDSB) that may induce High-Dose Apoptosis (HDA) via serine 46, as shown in Figure 4. In fact, these DDSBs as shown recently [23] are the key effectors of all curative radiation therapies, as described in great detail and shown in the lower right corner of Figure 4, and explain why normal tissues at risk should never receive more than ≈2.3 Gy of low LET per treatment fraction, as discussed in further detail in Figures 19 and 20 below. Most tumor cell lines and more than 50% of all clinical tumors are characterized by a mutant TP53 gene that commonly eliminates most LDHS and early LDA to obtain a low-dose radiation- resistant LDRR phenotype and an LQ-tumor-like survival shoulder, as seen from the insert in Figure 4 and Figure 6. As shown for mouse embryo fibroblasts with key repair genes knocked out, both CHK2-/- and particularly ATM-/- cells lose all the LDHS of wild-type (wt) cells, highlighting the importance of the low-dose phosphorylation steps (Figure 4, [1]: Figure 13, and [19, 38]). Obviously, there are also some wt TP53 and wt ATM tumor cell lines that may show LDHS properties (cf [35] and Figure 32, [1, 2]).
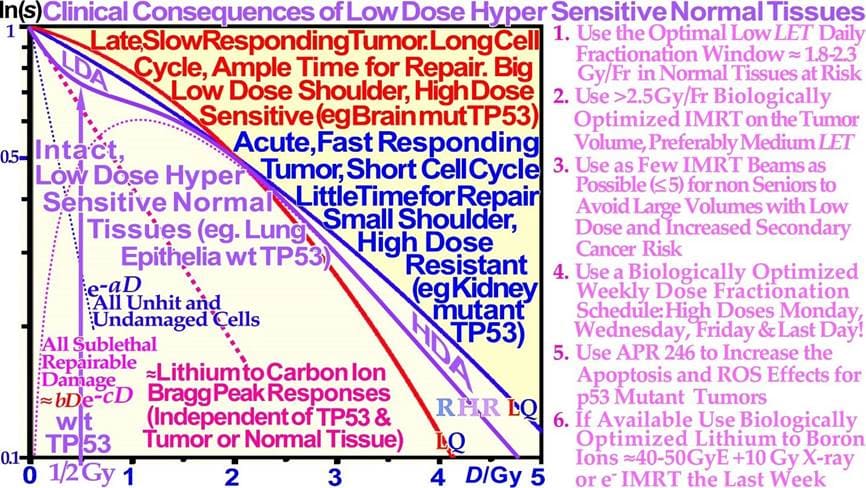
Figure 6: Close-up of the characteristic cell survival curves of intact LDHS normal tissues and most tumor cell lines that often have a mutant TP53 gene, resulting in a low-dose radiation resistance (LDRR) phenotype due to a lack of LDA (cf Figure 4 insert). As seen from the low dose curve shapes, such tumors generally need light ions with low LET in normal tissues or high IMRT doses for effective cure. On the right side, some of the key clinical conclusions drawn from these curve shapes are summarized (cf [1-3] for further details). In radiation therapy, this means that the fully functional DNA repair system should continue to be utilized until more severe high-dose apoptosis sets in after 2- 2.5 GyE, as seen in Figure 4. Thus, there is a low-LET optimal radiation therapy fractionation window in normal tissues ≈ 1.8- 2.3 Gy/Fr to minimize normal tissue damage, as seen indirectly in Figures 4-7 and further discussed in detail below (cf. [2]: Figure 5 [3, 39]).
The most recent RHR paper also investigated LDHS and LDA for light ions, demonstrating that it generally peaks for low-LET ions (≈20 eV/nm, [2]: Figure 3), where for reasons related to ion interaction physics, the highest low-energy δ-electron production per unit dose occurs, as the LET is low but sufficient to induce apoptosis, and the ion fluence per unit dose is highest. Thus, apoptosis peaked here (31% measured at 3 Gy of 40 eV/nm B5+ ions ([1]: Figures 7, 11, 12, 13)), and a clear but small LDHS was observed ([3]: Figure 16, [40]), mainly due to the early dual NHEJ only and HR misrepair (5% at 0.5 Gy, estimated ([1]: Figures 7, 8 and 9b)). The 31% value was not just LDA but mainly serine-46-induced HDA since at high LET, the LDA and HDA regions almost overlap to make an almost straight exponential survival curve (HDA sets in after ≈2+ GyE or 0.7 Gy high LET, as shown in Figure 4). Therefore, even if there is a weak low-LET ion LDHS and LDA, it is most likely not sufficient to establish a real light ion fractionation window with carbon ions but surely with the entrance plateau and fragmentation tail of low-LET lithium ions (cf lower lain of Figure 4 [1, 6], Figures 6, 7 [2, 3, 34]: with 60Co and Figure 33 with mut p53-reactivated, as well as for lowest-LET boron ions and 60Co in Figure 32). In fact, as the LET goes above ≈55 eV/nm, the low dose hypersensitivity is almost gone since then 0.6 Gy ≈ 2 GyE, and the δ-ray multiplicity reaches ≈3, so cells increasingly follow directly the high-dose apoptosis HDA pathway. This results in an almost straight high DDSB and δ-electron density exponential cell survival curve, as indicated in Figures 4, 6, and 32 [1, 3, 23]. The high DDSB production should therefore always be reserved for target tissues either by high-dose low LET or preferably Bragg peaks from the lightest ions beyond protons up to boron (cf. Figure 9). Thus, LDA, (cf. [41] for LDA) HDA and DDSB are very valuable therapeutically in the tumor, but unfortunately often lost by a mutant TP53 gene. Even more important can the often associated senescence be (cf Figure 31, [1-3, 42- 44]), as also described in Figure 4, since it does not cause later problems with caspase-3 activation of tumor clonogens [22]. Interestingly, these therapeutic processes together are the key functions of molecular radiation therapy, not least by the associated low LET in normal tissues simultaneously retaining the fractionation window capability but also because the lightest ions simultaneously maximizes tumor apoptosis and senescence [1, 2, 4, 23, 41]. A very interesting way to increase these therapeutic properties on TP53 mutant tumors, which are known to be a major clinical problem due to LDRR, as seen in Figures 4 and 6, is to use a p53 reactivating compound as described in more detail in Figure 33 below. To further elucidate the development of the cell survival curve shape description, some key steps are summarized in Figures 7 and 8, considering the normal lung epithelial cell data [1-3, 29] and V79 hamster cells, respectively. From the 1940s to 1960s, the logarithmic Linear Model (Ln-) was established, with a back extrapolated (slope D0) initial cell number (n) larger than 1 to account for cellular division and repair during irradiation. Alternatively, the so-called quasithreshold dose (Dq, which is actually related to LDHS, as seen in Figure 7) was also used to indicate that the linear extrapolation seemed to start from a dose that was wasted due to tumor cell repopulation and repair. Clearly, this was a rather crude way to describe the early cell survival that often was of low clinical importance at the time but truly not today [16]. From the late 1960s, the still currently dominating linear quadratic model could better describe the slight curvature of the quasilinear medium-dose cell survival by its α and β factors of most tumors but did not account so well for the low- and high-dose survival, at least for most normal tissues, as seen in Figure 7. It also misses a true repair term, as a high repair requires a high β, but that means less survival since the term is negative, so α needs to be reduced to better describe the survival, which may only work in a small-dose region, and α loses its original meaning. This illogical effect, and the fact that it gives a poor description of LDHS normal tissue survival, has misled two generations of radiation biologists to trust it rather uncritically even if it describes experimental often TP53 mutant tumor cell lines better than Ln. The beauty of the third Repairable- Conditionally Repairable (RCR) model is that it is very simple and describes what occurs at large to the cells using Poisson statistics with a simple exponential term for missed cells and a linear exponential term for the correctly repaired fraction of sublethal hit cells. Thus, it is a logical continuation of the Ln expression, as seen in Figure 7 and [45]. It therefore can describe the LDHS quite well and solves the repair and overkill problem at low and high doses seen with the LQ model. The repairable- homologically repairable formulation (RHR) goes a few steps further by accounting for the two major DNA repair pathways, as mentioned above, and their associated misrepair processes, as seen in the lower right corner of Figure 7. This formulation can therefore handle cell lines with mutant and/or knocked-out repair genes, high and low LETs, and apoptosis induction [1-3].
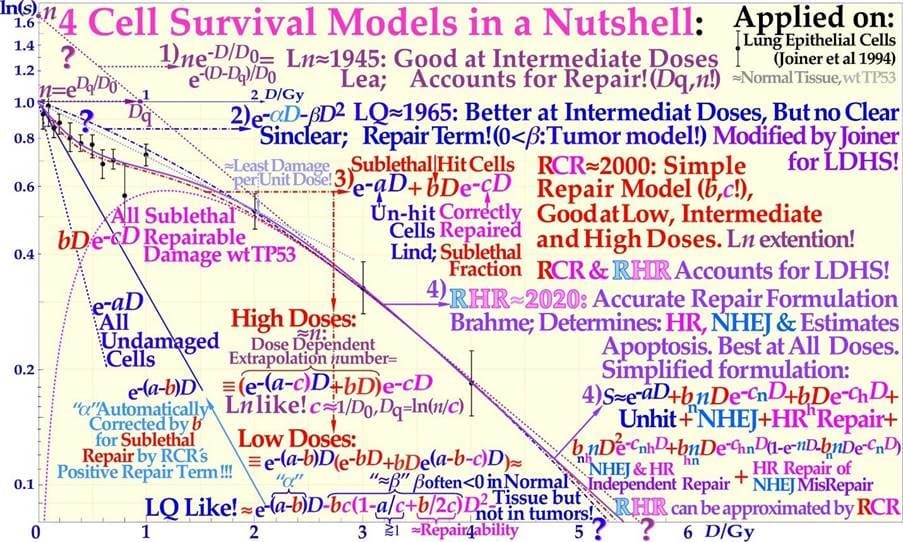
Figure 7: Cell survival curve models have during the last century been developed from the linear exponential model with back extrapolated effective initial cell number (1), n, Ln) to the currently dominating linear quadratic formula (2), LQ), which does not even account well for cell repair as Ln does. The more recent repairable- conditionally repairable model (3), RCR [45] handles the cellular repair of sublethal damage considerably better and separates it clearly from unhit survival. The most recent repairable- homologically repairable (4), RHR) formulation further accounts separately for nonhomologous and homologous recombination repair, as shown in the lower right corner, and can estimate the apoptotic and senescent fraction and individual repair processes (cf. [1]: Figures 1- 3 [23]: Figure 2b). Interestingly, the least damage per unit dose is obtained between 1.8 and 2.3 Gy/Fr, as indicated by the fine dotted pail blue tangent line with the shallowest slope possible through a point on the survival curve and the point of unit survival [2]. For further details, see [1-3, 23, 34, 45].
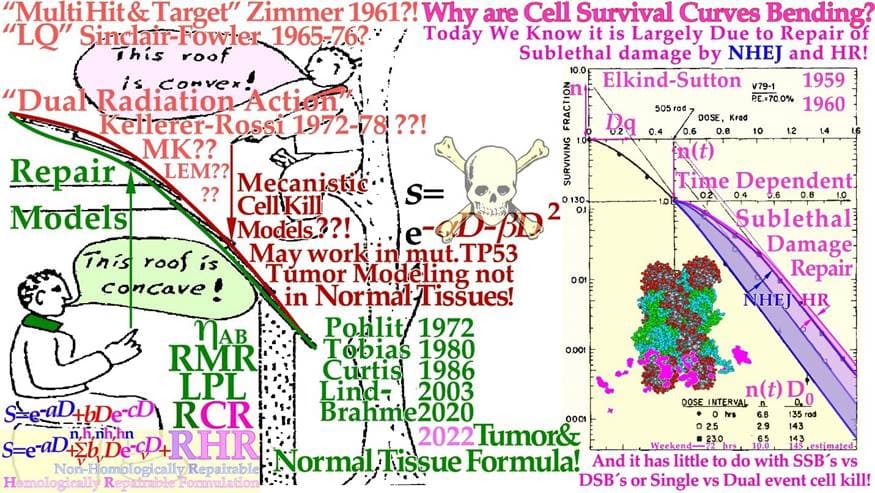
Figure 8: The development of cell survival models characterizing the shape of the cell survival curve from target inactivation type theories first summarized by Zimmer to the repair models initiated by Pohlits Cybernetic repair model [46] and the DNA repair formulation separating slow homologous repair from other faster repair types. Elkind’s early cell survival experiment demonstrating the importance of the fast 24 hrs NHEJ repair, here modified to include also the slow Homologous Recombination repair that play an important role in the 3-day weekend brake of conventional radiation therapy (cf also the insert of Figure 20). Renewed repair thinking is essential for understanding normal tissue survival, as shown in Figures 4-6 and especially Figures 7, 20 [1-3, 23, 47]. The very interesting incomplete repair model of Thames is a kind of bridge between the two groups following Elkind type data (cf insert in Figure 20, [3]). The underlying cartoon by Wolfgang Pohlit mid 1970s trying to bridge the two different schools, but unfortunately the difference is much more serious than this humoristic point of view (cf [1-7])!
It is thus extremely important to consider the significant differences between the cell survival of most tumors and generally LDHS normal tissues when designing optimal radiation therapy protocols, as shown in Figures 6- 9. It is unfortunate that the bulk of established tumor cell lines mostly suffer from TP53 and associated mutations, so they can easily grow in the laboratory and it lead to the erroneous conclusion that all cell lines have LQ-like shoulders, almost making the LQ model a dogmatic model of true cell survival. In fact, it is most likely that all intact normal tissues have wild-type TP53 and ATM genes and thus are linked to LDHS and LDA, as recently indicated (Figure 4, [1-3, 21]), and it is probably an inherited growth advantage to avoid cancerous transformations after lowlevel genetic damage that may otherwise not be correctly repaired. The intriguing reason why it went undetected for such a long time is that too few studies were conducted on live normal tissues at low doses and with sufficient accuracy until Joiner [35] found low dose hypersensitivity in mouse renal cells. Furthermore, LDA-associated accelerated repopulation via caspase-3 is a natural way to compensate for LDA and LDHS at the end of an irradiation sequence to truly re-establish normal tissue homeostasis [2, 18] and thereby practically hide all the earlier low-dose cell losses (LDA) in subsequent studies.
The more conceptual changes in cell survival description during this period are shown in Figure 8 as the initial target based theories of plain cell kill gradually had to be replaced by the cellular repair models that could better describe the temporal processes and the influence of the true DNA repair processes. Fortunately, the most commonly used LQ-model may still be useful to describe the fractionation sensitivity at least of TP53 mutant tumors (cf Eq 2, 3) that are most common clinically and largely miss LDHS and instead show a clinically problematic LDRR phenotype, but it is unsuitable for normal tissues. Today, the LDRR tumors may require modern IMRT approaches, light ions and/or adjuvant p53 reactivating compounds (see below). The high biological effectiveness of ion beams as well as low energy electrons and photons are almost totally described by their slowing down spectra of δ-electrons (0.2-1.5 keV), as shown in some detail in Figure 9. Interestingly, the dense clusters of ionizations by these δ-electrons can severely damage dense volumes of hetero chromatin in the cell nucleus mainly by forming dual DSBs on the periphery of their nucleosomes, and they are the most common multiply damaged sites on DNA that are hard to repair for the main cellular repair processes NHEJ and HR, as indicated in the lower right corner of Figure 4 and Figure 9 [23]. In fact, the DDSB that dominates the low LET cell kill ([22, 23]: Figures 5-8) is the key effector of radiation therapy since >99% of the simple ≈75 DSBs per cell nuclei are perfectly repaired at 2 Gy of low LET and at the same time there are only 1-2 δ-electrons that can potentially generate dual DSBs and more commonly kill cells. Light ions generate ≈3 times more δ-electrons, and their RBE is ≈ 3 mainly due to the associated higher DDSB production, as seen in the upper left panel of Figure 9. Thus the DDSBs are truly our best tool and effector to inactivate a tumor by radiation and we do not need too many of them as we get from carbon and heavier ions [23]. The euchromatic regions that are more common in tumor tissues are characterized by more spares beads on a string chromatin that reduce the nucleosome density and the number of DDSBs that a single δ-electron can reach, as seen by the few higher multiplicity DDSBs produced (cf [23]: Figure 14). Only a few triple DSBs and hardly any quadruple DSBs are seen. Interestingly, the same tendency is seen whether it is measured as pKu70, pKu80, 53BP1 or pDNApkcs foci with carbon ions or photons. The percentage of DDSBs seems to vary between ≈5-25% and is similar for photons and medium LET carbon ions as it is mainly generated by very similar types of δ-electrons. The very extreme cell kills are far from optimal (cf [23]: Figure 13), as they are also associated with higher cell kill in normal tissues in the entrance and plateau region of the beam (cf Figure 27). Interestingly, these severe phenomena are mainly linked to heterochromatin, where the nucleosomes are so densely packed that a single δ-electron can reach up to ≈ 2-4 nucleosomes on its own. This is also the main reason there are so many more DDSB clusters in heterochromatin (≈ 3.5 fold [23]).
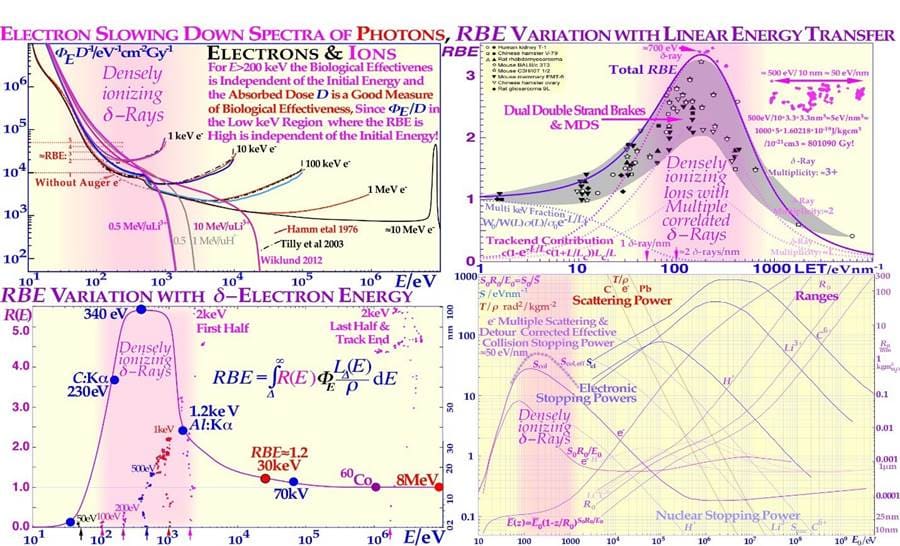
Figure 9: The pink regions show where a high fluence of δ-rays is generated, either in low keV electron or photon beams or ion beams in their electron slowing down spectra, and they show up in δ-electron and ion RBE distributions. The peak ion biological effectiveness or RBE appears when the cellular inactivation cross-section saturates at high LETs (upper right panel [48]), since the cross-section cannot increase with LET any more, and at higher LETs, the biological effectiveness decreases because of a quasiconstant cross-section and a narrower ion track width, an increasing probability of radical- radical recombination when secondary electrons and ionizations are generated more and more closely together and an “overkill” effect sets in. The dashed curves are taken from [47] and describe the average response of the multiple experimental data sets very well (modified from [48]) as the δ-electron multiplicity increases along the ion track [23]. Interestingly, the peak δ-ray LET (≈25 eV/nm), but the effective LET is almost doubled by multiple scattering, secondary electron production and multiple scattering detours to ≈50 eV/nm at the track ends (upper right corner and lower right Scol) of ≈500-700 eV electrons (lower panels)! The ion RBE peak at approximately an LET of 120-200 eV/nm thus corresponds to a δ-electron trackend multiplicity on the ion track of ≈ 3 and higher ([23]: Figures 13 and 14), and an RBE ≈ 3, which is too much overkill as a single or a couple DDSBs, is generally sufficient, again making boron ions a good alternative to carbon (cf [7]: Figure 16)
Biologically Optimized In Vivo Predictive-Assay Based Treatment Planning
During the last thirty years, the field of cellular and not least molecular radiation biology has developed substantially and can today describe the response of heterogeneous tumors and organized normal tissues to radiation therapy quite well. An increased understanding of subcellular and molecular responses is leading to a more general systems biological approach to radiation therapy and treatment optimization. It is interesting that most of the characteristics of the tissue infrastructure, such as the genetic make-up (cf Figure 4) as well as the vascular system and the nutritional and the degree of hypoxia (cf below), must be considered to obtain an accurate description of tumor and normal tissue responses to ionizing radiation. A brief description of some of the most important concepts, and processes is possible, starting from the key functional genomics pathways of the cell that are not only responsible for tumor development but also for the response of the cells to subcellular damage such as radiation therapy. Some of the key mechanisms for cellular damage and damage repair are discussed above, and the key question is how these repair processes can be brought to interact to inactivate the tumor without severely damaging surrounding normal tissues using suitable radiation modalities such as light ions, electrons and photons using biologically optimized radiation intensity- and quality- modulated radiation therapy (IMRT and QMRT [5, 7, 38, 49-51]). The use of such methods may lead to a truly scientific approach to radiation therapy optimization, not least when in vivo predictive assays of radiation responsiveness become clinically feasible, as shown in Figure 10 [49, 50]. Brief examples of such an approach using the efficiency of IMRT showing how sensitive normal tissues can be spared at the same time as highly curative doses are delivered to a tumor that is often radiation resistant. The present method maximizes the probability of eradicating the tumor, while at the same time, adverse reactions in sensitive normal tissues at risk are truly minimized using optimal time-dose fractionated IMRT photon electron or light ion beams.
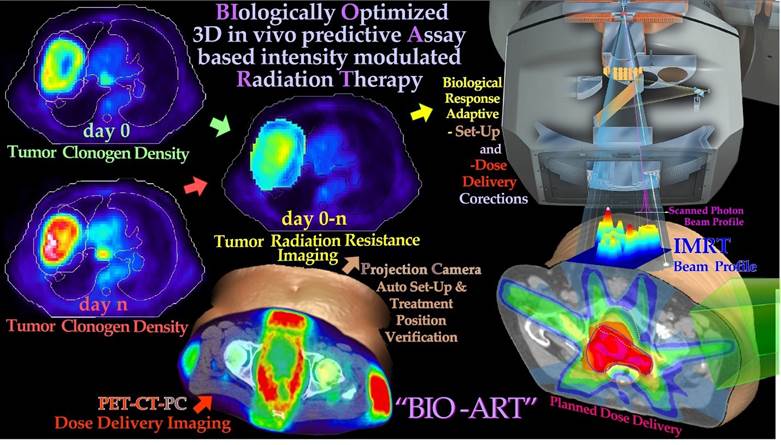
Figure 10: PET-CT-PC can be used to derive tumor responsiveness information that can be used to plan, verify and biologically optimize using the in vivo predictive assay based radiation therapy method (cf Figure 3b and BIOART [49-51]). By measuring the tumor cell kill early in the treatment, 3D in vivo predictive assay information about radiation responsiveness is obtained for accurate prediction of the optimal dose delivery based on measured hypoxic tumor cell response status and adaptive control [5, 49-51]. Different imaging methods from various body regions exemplify aspects of the adaptive feedback procedure. The normal tissue responses are approximately known from historical data [38].
3D in vivo PET-CT dose delivery monitoring is possible both with scanned high energy photon and light ion beams, to further optimize the treatment based on the observed patient specific mean dose delivery. This may differ from the planned dose delivery without considering organ and patient motions and set up uncertainties [52]. Both these data sets, when used together, will allow a high degree of therapy optimization where practically all major sources of treatment error can be picked up as long as they influence tumor cell survival during the first week or two of therapy, and can thus be corrected for using biologically optimized adaptive treatment techniques. The lower left in vivo dose delivery image (Figure 10) was made using 50 MV photon beams in a fourfield box technique with the help of a 64 slice PET-CT camera with ≈ 4 mm resolution [53]. Interestingly, the patient was a bit too rapidly positioned on the diagnostic couch to not lose too many positron counts, and the left side of the body was partly located outside the couch top, causing a substantial rotation (≈20°) of all the surrounding fatty soft tissues with peak PET activity (no auto setup on the PET-CT!). Thus, it appears that the whole fourfield box technique was performed with severely oblique beams [53]. Even if larger than normal set up errors it indicate a set up problem that for example may broaden penumbras in regular treatment procedures. The projection camera (PC, [17]) and PETCT information can be used to verify the BIOART approach. By measuring the tumor cell kill early in the treatment, 3D in vivo predictive assay information about radiation responsiveness is obtained for accurate prediction of the optimal dose delivery based on known or estimated hypoxic status (Figures 23 and 24). Both with light ions and scanned high energy photon beams, 3D in vivo PET-CT dose delivery monitoring can adaptively optimize the treatment based on the observed mean dose delivery, which may differ from the planned dose delivery without considering organ and patient motions as seen here. Both these data sets, when used together, will allow a high degree of therapy optimization where practically all major sources of treatment error in principle can be picked up as long as they influence tumor cell survival and can thus be corrected for using biologically optimized adaptive treatments techniques by the “BIOART” technique, shown and quantified in more detail in Figures 11 and 12 [51].
Optimal Dose Distribution for Heterogeneous Tumor Eradication
It is possible to express the optimal dose distribution necessary to eradicate a tumor to any desired probability or cell density with uniform recurrence probability once the density and radiation resistance of the clonogens are known [54]. This allows the interesting use of the first three data sets of Figure 10, as shown in further detail in Figure 11 based on:
- Geometric information about the location of the tumor on the background of normal tissue anatomy and the approximate initial density of tumor cells given by the first PET-CT image just before the treatment.
- Information about the density of tumor cells preferably after approximately 1 week of treatment.
- Calculated spatial radiation resistance distribution of the tumor cells determined from 1 and 2.
With this information it is possible to approximate the density of trapped positron emitters owing to the metabolic activity in functional tumor cells. If the PET image approximately quantitates the density of positron emitters in the tissue such that scatter and attenuation of the annihilation photons are accurately taken into account, the imaged emission density PET0 to PET7 ratio is largely determined by the effective radiation resistance of the tumor cells to fractionation D0,eff (cf Figures 7 and 19 for the definition), as shown in the lower left in Figure 11. When this quantity is known, we can use the simple equation for the optimal dose delivery [51, 55] to the right in Figure 11, e.g., aiming at 95% tumor cure (ns≈ 0.05). A correction for the increased vascularization due to the reduced internal tumor pressure as tumor cells are lost, as seen in the upper part of Figure 11, is also needed. These calculations do not take the possible adverse effects on normal tissues into account but can be performed by physical dose optimization, as further shown in the upper part of Figure 12, leading to a loss in tumor cure by ≈ 15%. Interestingly, the information collected in Figures 10 and 11 can also be used for a stricter biological treatment.
The Dose- Response Relation of the Tumor and Advanced Biological Therapy Optimization
For true biological optimization, we really want to know how to find the dose distribution that maximizes the probability of curing the patient without unacceptable or severe normal tissue side effects and minimal late sequelae [5, 53]. To this end, we need to quantitate the probability of eradicating the tumor for a given dose delivery, while at the same time, we need to know the risk for severe normal tissue damage, as discussed in detail elsewhere [5, 54]. Fortunately, the early PET-CT data from the first week of treatment can be used to quantify the tumor cure probability. According to binomial, Poisson and preferably extreme value distribution statistics, the probability of eradicating all clonogenic tumor cells is closely related to e−N, where N is the mean number of surviving tumor clonogens, as shown in the lower part of Figure 12 [2, 55]. The interesting property of this expression is that it includes the individual patient’s initial tumor spread, n(r), and vasculature data as well as in vivo predictive assay data on tumor radiation resistance, D0,eff(r), to make the patient individual tumor response prediction and treatment optimization as reliable as possible. In true treatment optimization, we now have to combine the benefit probability of curing the patient: PB with the probability of avoiding severe injury or adverse reactions: PI. The interesting property of this expression is that it includes the individual patient’s initial tumor spread and vasculature data as well as in vivo predictive assay data on tumor radiation resistance to make the tumor response prediction and treatment. Optimization as reliable as possible.
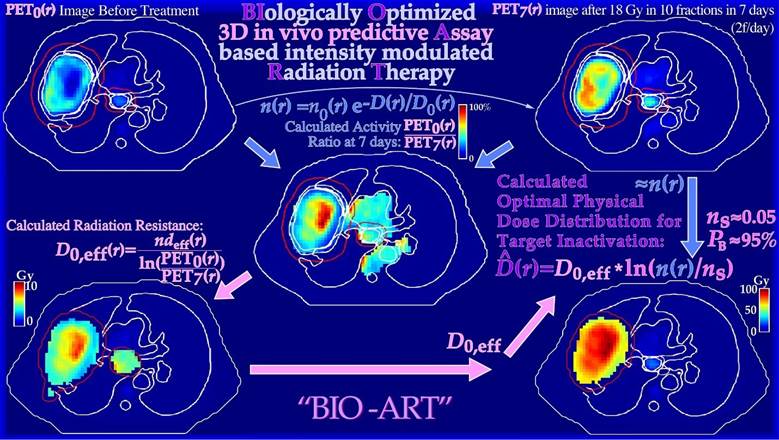
Figure 11: True dose responsiveness imaging applied on a large lung cancer. By taking the ratio of the tumor FDG uptake before therapy and after a week of treatment and 18 Gy of tumor dose, in this case, it is possible to quantify the change in tumor uptake and the effective radiation resistance, D0 or D0,eff. From D0,eff and the tumor cell density, it is possible to estimate the optimal dose level necessary for tumor eradication (lower right panel, [51]) without considering the risk for normal tissue damage, which is generally is fairly low for light ion and photon IMRT treatments [53].
If they were statistically independent processes, the probability of achieving a complication-free cure P+ would be simply P+ = PB (1 – PI). However, in most clinical studies, adverse reactions in normal tissues are often closely correlated to the local control as both increase with the dose delivery, and a more accurate expression for P+ is given by
P+ = PB − PI + δ(1− PB) PI (1)
Where δ is on the order of 0.2 or lower for many normal tissue tumor configurations [56]. It has been noted that Eq. (1) is a compromise between the additional cure and injury that is too crude when the dose is increased because some forms of severe treatmentrelated morbidity may be considered less desirable than a recurring tumor. However, the statistically independent expression is even worse, as it corresponds to δ = 1 and the last uncured injury term in Eq. (1): (1− PB) PI is then five times larger. Recently, an even better way to solve this clinical optimization problem has been developed. This so- called P++ optimization strategy first maximizes P+ by intensity modulation, selection of optimal beam directions, and radiation modalities [5, 60, 61]. By this P++ approach, the achieved P+ is then relaxed by a fraction of 1%, and this P+,min value is used as a constraint on P+ not allowing lower values, while instead, the injury PI is minimized. This strategy almost simultaneously optimizes P+ and minimizes PI by selecting slightly improved angles of incidence and intensity modulations. A reduction of P+ of 0.5% may result in a decrease in complication probability by as much as 5%. This approach is, of course, highly desirable, not least in countries where the risk of legal action even after a slight overtreatment may be a reality. The optimal way to fractionate the treatment plan in Figure 12 is in view of the new fractionation window idea, described in more detail in Figure 20 and Eq 3!
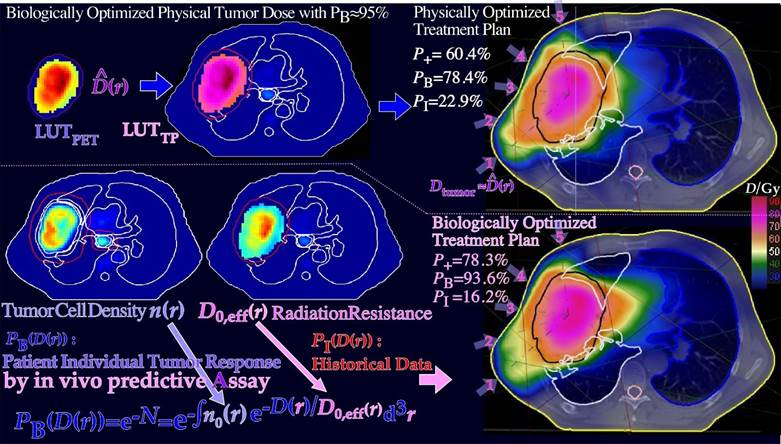
Figure 12: The optimal dose distribution in Figure 11 can be used as an objective for inverse physical dose therapy optimization (upper half figure). Even more accurately, the tumor cell density, n(r), and estimated D0, eff(r) of Figure 11 can be used for biologically effective dose delivery optimization using the clinically observed tumor response and historically observed dose- response data for normal tissue side effects that are systematically much more similar between patients than the effective tumor response that can vary substantially [56]. Interestingly, the complication-free cure increases from 60% to almost 80% by introducing the biological optimization method based on the 3D in vivo predictive assay and even one step further by optimal time dose fractionation (cf Figures 4-8, 19, 20 and Eq. (3) [1, 2]), and it is most ideal for molecular radiation therapy with a few lithium ion beams (see below).
The Quantum Biology of Curative Radiation Therapy
As shown in Figure 1, both the therapeutic beams and the tumor consist of individual particles and cells, so the ultimate cure depends on the probability that all remaining tumor cells have truly been hit at the end of the treatment. This means that only a tenth of a cell can be allowed to survive to have 90% tumor control probability, since that means that out of ten patients, only one will on average have a single surviving tumor clonogen that may repopulate its tumor (cf Figure 13). Therefore, as in quantum mechanics it is generally not possible to state the exact state of the patient after a treatment whether he is cured and is alive and well or not, we can only state the probability range to expect based, e.g., on the ExtremeValue Distribution ([2], cf also “Schrödinger’s cat”). In fact, radiation therapy is truly the perfect example of an extreme value distribution, as it is well known that only the last few most radiation-resistant tumor clonogens that survived the initial major part of the treatment (≈60 Gy/70 Gy≈ 85%) without being killed remain to finally form the tumor control probability curve, as recently described in great detail (Figure 13, [2, 3]). It is therefore not surprising that the tumor control probability can be rewritten to perfectly follow the cumulative extreme value distribution [2].
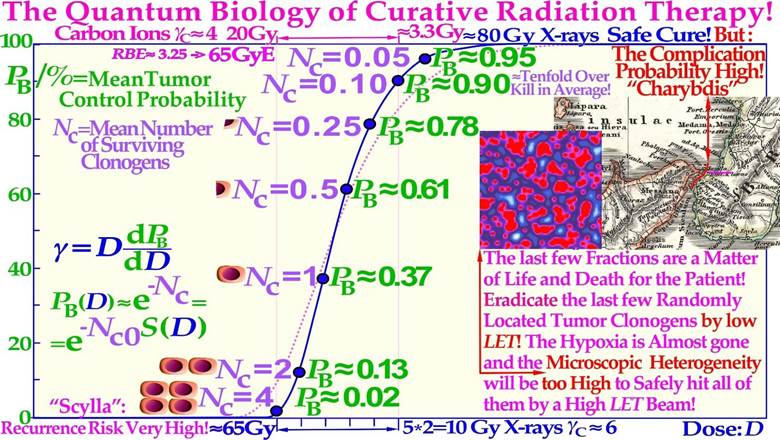
Figure 13: The last few radiation treatment fractions will determine the outcome of the treatment, and they are not at all deterministic as it depends on random hits. To eradicate the last few randomly located tumor clonogens, a too high LET with a high microscopic standard deviation in dose delivery should not be used. As shown here, the last five 2 Gy fractions of low-ionization-density electron or photon therapy increase the cure probability from a few percent up to approximately 90%, whereas the last 3.0-3.3 Gy of carbon ions, on average, may only reach ≈75% (cf Figures 15, 18, 20 and 25). Therefore, with a handful of remaining spread-out tumor clonogens (Nc ≈ 4, cf Figures 1, 18, and 20), a low LET is essential in finding the optimal way between “Scylla and Charybdis” cf Figure 18. The present Figure is a bit schematic and not corrected for the relative variance Vr of the carbon ion tumor control curve (≈ pink dotted line, Figure 18 [2]), but Figures 15, 18a, 20 and 25 are fully corrected (cf also the clinical data in Figures 18b, 26). An increased carbon ion dose just results more normal tissue injury (Figure 18)!
The Scylla and Charybdis of Radiation Therapy
Like Odysseus on his travels had to pass through the strait of Messina, he had to be extra careful since on the west Sicilian side, there were the vortices of Charybdis and on the east Italian peninsula side there were the six headed monster Scylla as shown on the old Italian map inserted in Figure 13. A similar difficulty faces radiation therapy as we try to raise the dose as much as possible to get rid of the tumor, but not too much as it may harm the patient. It is well known that the tumor control probability rises steeply first at the end of the treatment, as shown in Figures 13 and 18. The linear alignment of the DSB´s on the ion track, and the high density of the DNA damage close to the ion tracks (cf. [3]: Figures 1-5, [23]: Figures 5, 11-13) increases the Relative Biological Effectiveness (RBE) in the gross tumor, due to increased probability of severe damage when the cell density is high. However, this is a major disadvantage towards the end of the treatment when the remaining dose is low and very few tumor clonogens are left. These may not be covered completely owing to the high microscopic heterogeneity and standard deviation in dose delivery [8, 62, 63] at high LETs and the low total doses as the RBE is high but also due to the high skewness of the extreme value distributions (S≈1.14 cf sec 5.2 and especially the last few GyE as seen in Figures 13, 15). This is due to the microscopic dose heterogeneity of high-ionization-density ions as shown in Figures 13-18. Therefore, the normalized dose-response gradient is actually shallower [58, 63-65], resulting in an increased risk for microscopic cold spots to fall on tumor clonogens. In part, this is due to the lower dose with high LET and thus in total fewer and more aligned DSBs but equal number of therapeutic DDSB hot (and cold) spots [24], so sufficient cell kill will occur within dense tumor cell populations, but generally not so likely with only a few remaining tumor clonogens. The random “hot spots” then practically need to hit or come close to all the remaining clonogens to ensure a high probability of permanent cure and patient survival, which will be less likely, as seen in Figures 15 and 18. The dose-response gradient γC is therefore shallower at high LETs, as indicated in Figure 13 and clearly seen in Figures 15, 18a, b, 20 and 24-26 below [2, 8, 47, 63- 66]; in addition, the hypoxia of the tumor should simultaneously be less of a problem with very few remaining viable tumor cells (cf Figure 22). Using a lower LET toward the end of the treatment can thus reduce this disadvantage of the high heterogeneity and the resultant lower-dose-response slope at high LET´s. Therefore, a steeper clinical γC value (cf Table in Figure 15) and higher tumor cure are achieved with less dose delivery and better normal tissue sparing, thus improving the complication-free cure, as described in further detail in Figures 13-21 and particularly in Figure 18a, b [2].
Influence of Microdosimetric Heterogeneity on the Dose Response Relation
Microdosimetry and nanodosimetry is the science of the stochastic nature of the energy depositions in particle and radiation beams in general when we go into the microscopic molecular scale of energy depositions so both the beam and the target objects are quantized. Thus, indeed, one step further than presented in the plain Figure 1. Interestingly, this means that the classical Linear Energy Transfer (LET) concept is replaced by the stochastic quantity lineal energy: Y and we have to consider its mean value in a small! m size volume, such as the frequency and dosimetric mean lineal energy, denoted and respectively. These two quantities can now be used to describe the relative Variance Vr of the energy deposition in different radiation beams simply by taking the ratio = Vr +1. In Figure 14, this basic microdosimetric quantity has been measured in different radiation therapy beams as a function of the frequency mean lineal energy in μm size objects. Starting from the left side, we can see that low energy electrons and photons have a low variance, but in high energy beams it reaches ≈ 5 due to the effect of the slowing down spectrum (cf upper left panel of Figure 9) whereas protons and π-mesons have 5-10 times more and photo nuclear, fission, and high energy -neutrons 2-5 times the high energy electron and photon value [8].
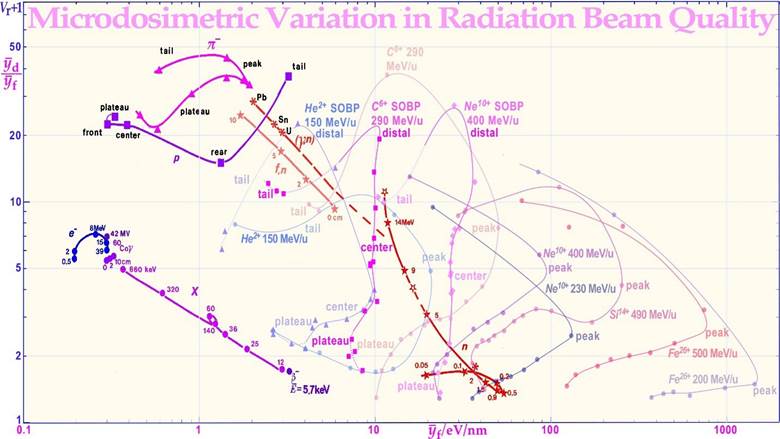
Figure 14: The variation of the microscopic relative variance for different radiation modalities. The variance of the energy deposition (Vr + 1 = / , where is the dose mean lineal energy value) as a function of the frequency mean lineal energy or ≈ mean LET at different locations on the depth dose curve. Interestingly, the SOBP has low variance except near the distal edge, where range straggling and very high LET Bragg peak -values combine to make Vr high. For the SOBP, the frequency mean lineal energy is fairly constant for both carbon and neon ions, but the plateau in front of it and tail has only marginally lower -values. The unmodulated carbon beam has a much higher peak -value at its Bragg peak. MeV-electrons, neutrons (50 MV photonuclear, fission, and high-energy monochromatic), pimeson, proton and all SOBP ion beams have a rather high variance in energy deposition. Except for high LET ions and low energy neutrons this has the advantage that the region of lowest energy deposition is not too low (few microscopic cold spots) but instead the mean LET is rather low and so is the biological effectiveness.
Interestingly, Vr is related to the σm2 = (σD/)2 of Figure 15 (cf. [8], updated with more recent He, C, Ne, Si and Fe data from NIRS).
For light ions, the distal region is also high, meaning that the biologically important is high, whereas is almost constant over the Spread Out Bragg Peak (SOBP) and not much lower in entrance and plateau region for C and Ne ions, whereas helium a-particles have a good normal tissue sparing. It is notable that the
Bragg peak has an approximately 5 fold higher value than the entire SOBP that averages over a large volume. For low LET and
-value radiation, the shape of the tumor dose-response relation is accurately described using the binomial, Poisson or even the extreme value statistical probability distributions for having no viable surviving tumor clonogens at the end of the treatment. As the dose is increased during the treatment, the number of surviving tumor cells is reduced until at high doses, the number of surviving clonogens tends to zero, and the cure probability approaches unity along a sigmoidal curve, as shown in Figures 13 and 15. The curve shape is reminiscent of the cumulative distribution function of a random variable, which, by definition, also starts from zero and finally reaches one or 100% when all random events have been counted. Interestingly, the curve shape is within a few % described by the cumulative generalized gamma distribution, but even more exactly using the perhaps more well-known extreme value distribution, which is known to describe the distribution of outliers of random processes, when the rest of the distribution is approximately normal distributed.
However, for high LET and value radiation the microscopic hot spots, due to their very high heterogeneity, naturally increase the effect on tumor cure and normal tissue damage in randomly located high-dose regions when there remain many tumor and normal tissue cells, whereas cold spots delay cure at high doses, as it becomes increasingly uncertain to hit the last few remaining most radiation-resistant clonogenic cells by random hot spots as seen in Figures 15 and 16. Interestingly, a switch to electrons/ photons during the last week of therapy, will recover the steep tumor response and a high tumor cure at a lower patient dose equivalent, as seen in the calculated Ne10++e− curve in Figure 15.
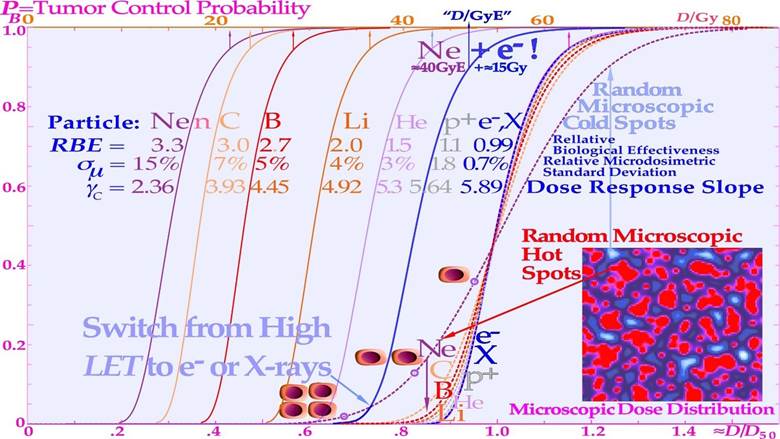
It should be pointed out here that even if the total dose delivery was perfectly uniform until the last week of treatment, what truly matters is the microscopic heterogeneity of the last 10 GyE of low LET or ≈3 Gy ≈ 10 GyE of high LET on the finally remaining few tumor clonogens (approximately five in a curative treatment) that lift the cure probability from a few percent to almost 100% as seen in Figures 13 and 15 (cf [1]: Figure 20). In fact, the shallow final high LET dashed line dose responses seen in Figure 15 means that approximately 20 GyE finally have to be delivered for high cure probability with high LET ions, that is an extra fraction or two, and consequently with increased risk for normal tissue damage as shown in Figure 18! The effect of the microdosimetric relative standard deviation σm=σD/ on the slope γC of the dose- response relation was pointed out many years ago by approximating the tumor control curve using an over simplified error function [43, 63] that by necessity is linked to zero Skewness and a Kurtosis of 3.0. However, the real statistical probability distributions behind the dose- response relation is the extreme value distribution with a Skewness ≈ 1.1395 and a Kurtosis of 5.40 independent of the number of cells and their effective radiation resistance [2]. This results in rather rapid rise in response at low doses and an extended high dose tail making safe high tumor cure the normal tissue damage first increases rather rapidly and the complication free cure is reduced both on high dose tumor cure side and the low dose normal tissue damage side by the skewed extreme probabilities requiring very high doses and high risks for complications. This also means that the normal tissue damage first increases rather rapidly and the complication free cure is reduced both on the high dose tumor cure side and the low dose normal tissue damage side by the skewed extreme value distribution (cf Figure 18a, b)! Thus, the classical normal probability distribution should be avoided for example when considering the influences of dosimetric and microdosimetric uncertainties and tumor and normal tissue heterogeneities. In Figure 15, this is thus taken into account by using the full extreme value distribution according to [2], now also convolved by the microdosimetric relative standard deviations for e− and X-rays, H+, He2+, Li3+, B5+, C6+, and Ne10+ ions with σm ≈0.7%, 1.8%, 3%, 4%, 5%, 7%, and 15%, respectively, for 8 µm diameter cell nuclei (cf [61]: Figure 10 and [47]: Figure 14). The significant reduction in the γC value is clearly seen in Figures 15, 16 18a, b and by the thin line curves in Figures 24 and 25, as the microdosimetric relative standard deviation increases with increasing atomic weight, LET, and RBE. This problem has been well known for neutron therapy [8], where the relative standard deviation is almost as high as for carbon and neon ions (cf tabulation in Figure 15) partly due to the high LET and low therapeutic dose (≈20-23 Gy).
 .
.
Figure 15: The change in shape of the tumor control probability curve for a uniform cell line using different radiation modalities as a function of the absorbed dose (upper scale). The lower scale and dashed line curves are normalized to the ≈50% tumor control dose that is approximately proportional to the dose equivalent, to more clearly see the effect of the microdosimetric relative standard deviation on the γC value with increasing the LET (cf digital values in the table). Not only are the hot spots often in the form of Dual Double-Strand Breaks (DDSBs, cf lower right corner of Figure 4; [3]: Figure 2, [24]) and cold regions become more extreme with increasing LET, but the RBE first increases, thus reducing the total dose by approximately threefold with carbon, neutrons, and neon, increasing the relative standard deviation, and reducing the γC value more than therapeutically desirable. For mixed high- and low-LET treatments such as neon ions Ne+e−, an extra upper Gy-equivalent scale is needed.
The interesting clinical neutron and photon dose- response data set of Lionel Cohen [67, 68] also supports this fact, as was later analyzed quantitatively and showed a reduction in the dose- response steepness by ≈ 50 % for neutrons, compared with photons, as seen in the upper left panel of Figures 16 and 18b [69]. This is in good agreement with the data calculated in the tabular portion of Figure
15. Figures 16, 22, 25, and 26 also show in other clinical data that it is difficult to reach γC values above 4 with neutron and carbon ions almost as calculated for the intrinsic maximum value achievable slope considering the microscopic heterogeneity of the energy depositions as shown in the lower right corner of Figure 26. It should be pointed out that in the case of the lung tumors as in Figure 26 that are known to be quite hypoxic even though they are sitting in the middle of the lungs as shown by PET imaging e.g. in Figures 10-12. This is due to the fact that high pressure venous blood are pumped from the heart directly to the lungs (≈10 cm distance) for oxygenation and when it reaches the tumor periphery it squeezes the outer most tumor vessels and thereby reduces the venous blood flow through the tumor so it is truly hypoxic. Furthermore, the lack of local alveolar regions in the tumor makes it stay strongly hypoxic as seen in Figure 10 and 11 and first after a weak of therapy (≈18 Gy) and tumor cell loss, the tracer can reach the tumor core. This is the key mechanism for lung tumor hypoxia and therefore a steeper tumor response is obtained with carbon ions than with photons even though the intrinsic microdosimetric heterogeneity of high-LET beams limit it to a γC value below ≈ 4 (cf also Figures 22 and 26). Epidermoid cancer data of Lionel Cohen [68] was probably less hypoxic and the hypoxic advantage of neutrons didn’t really show up in his data set as seen in Figure 18b. The intrinsic microdosimetric heterogeneity of high-LET beams and their low therapeutic doses showed early on that a combination of photon and high-LET neutron beams often was advantageous [8, 38, 59, 70]. Figures 17 and 18 further demonstrate how the microdosimetric heterogeneity not only influences the tumor cure but also naturally has a similar reduced steepness influence on the normal tissue damage curve. It is also seen that the microdosimetric variance actually increases the early rise in the tumor cure curve mainly due to microscopic hot spots in high densities of clonogenic tumor cells. However, this early advantage is rapidly lost at high doses due to microscopic cold spots when the clonogenic tumor cell densities and numbers are very low. The rather low final dose increments in High-LET and high-microscopic heterogeneity treatment will cause microscopic cold spots where some of the few remaining tumor clonogens may survive and it is equally unlikely that the heterogenic hot spots fall on all the remaining tumor clonogens. However, after such a noncurative treatment with caspase-3 induced apoptosis, an accelerated repopulation of normal tissues, as well as of remaining clonogenic tumor cells, may be induced [24].
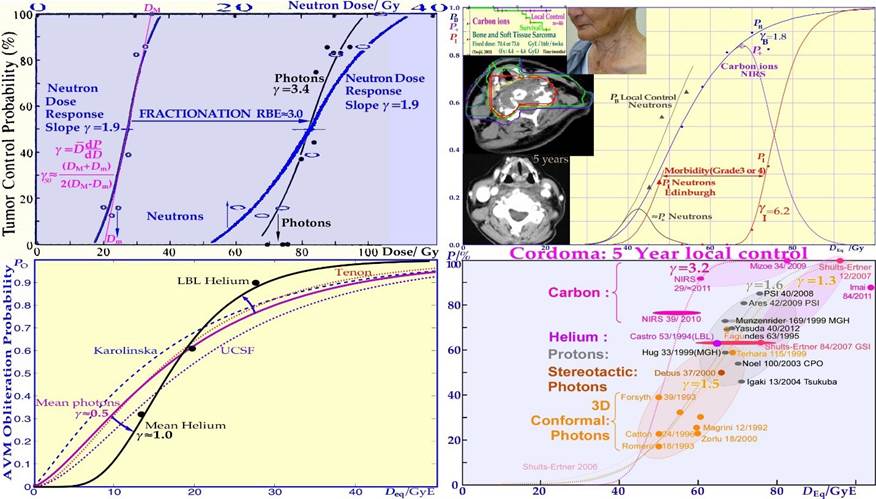
Figure 16: The clinical neutron and photon dose- response data set of Lionel Cohen (upper left panel). Bone and soft tissue sarcoma, upper right, are very effectively treated by carbon ions similar to neutrons (PB). However, the normal tissue morbidity is much lower with ions since the LET in normal tissue is lower for plateau carbon ions than for neutrons, resulting in a significantly increased complication-free a cure (≈ 85% for carbon ions and ≈ 15% for neutrons). Very good cosmetic results and healing of the bony structures are seen in the lower and top inserts (cf also Figure 27; Clinical data: NIRS, Chiba, Dose response calculation: Karolinska). Arterial Venous Malformation obliteration data for helium ion treatments at Berkeley compared to photons (lower left). A clear-cut improvement in dose response is seen partly due to the increased apoptotic cell kill with intermediate LET Bragg peaks in small-to- medium sized target volumes. Light ions are probably the modality of choice for these nonmalignant but life-threatening malformations. A comparison of the 5-year local control for the treatment of chordomas, lower right, by conformal photons, IMRT photons, protons and helium carbon ions is shown. The right shallow curves with photons (conformal and IMRT), and protons pertain to low LET radiation, whereas the left curve pertains to carbon ions. The higher γC value and local control with carbon ions may be due to tumor hypoxia similar to lung tumors (Figure 26). The increased tumor control of ≈ 20% with a ridge filtered beam (NIRS) compared to lateral Bragg peak scanning (GSI) may partly be due to the increased synergistic effect by simultaneously delivering the low and high LET beam components.
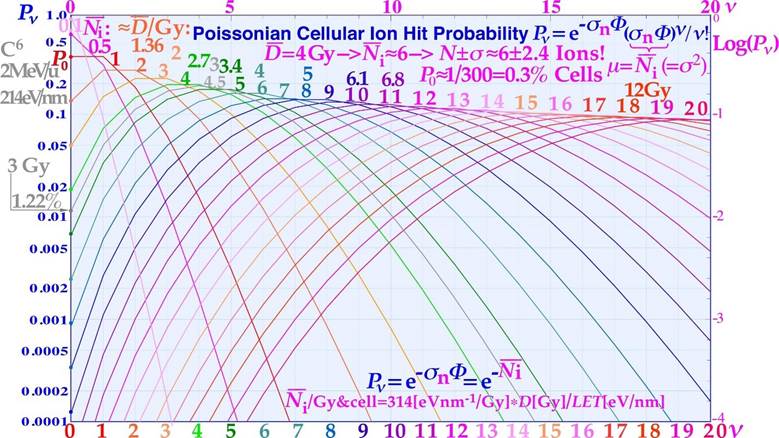
Figure 17: The intrinsic microdosimetric heterogeneity can also be expressed by the Poissonian probability of having a lethal cellular hit. When probability for no hits, P0, is increased at low doses and high LET´s the probability of random tumor clonogen survival is getting higher! At 3 Gy carbon ions, the probability of no hit is more than 1%.
Φ =Fluence of ions; σn =Cross-section of nucleus; ν =Hits/cell nucleus.
The normal tissue damage effects are shown in more detail in Figure 18a, demonstrating that the clinical influence on normal tissues is reversed since the hot spots in more densely populated normal tissues cause increased damage and thereby further reduce the complication-free cure. Consequently, both the tumor control steepness and the width of the therapeutic window will shrink with a too high LET, thereby reducing the probability of achieving complication-free cure, as clearly demonstrated in Figure 18a and b. Thus, a too elevated LET both reduces tumor cure and increases normal tissue damage, so the selection of optimal LET is truly critical for maximizing complication-free cure (cf Figures 13-18 and [3]: Figure 22). From this point of view, boron ions are more advantageous than carbon, at least for medium-sized tumors [7] and a low LET round up may be the optimal way to recover a steep response and a high complication free cure with boron and heavier ions. Here, we can conclude that at the end of the treatment, the lowest possible LET is optimal to minimize the significant dose heterogeneity effects and simultaneously minimize the normal tissue injury (cf Figures 18a, b and 21). This calls for high-energy electron or photon IMRT or even QMRT, as seen from the table in Figure 15. In addition to the radiation modality or ion species and the tumor clonogen number, there are several other clinical factors influencing the steepness of the dose response relation. One of these factors is the heterogeneity of the tumor with regard to cell numbers and their sensitivities, as determined by cellular differentiation, the degree of hypoxia, and the nutritional status (cf Figures 24-26, [6, 64-66]). Some of these heterogeneity factors, such as hypoxia, are actually reduced with an elevated LET, but the intrinsic ion heterogeneity is still limiting the highest possible γC value and will limit this positive influence on the hypoxic γ value (see the tabulation in Figure 15 and Figure 26; more details are provided in the recent overviews (cf [2] and [49]: Figures 8.5n, 8.10, 8.23c).
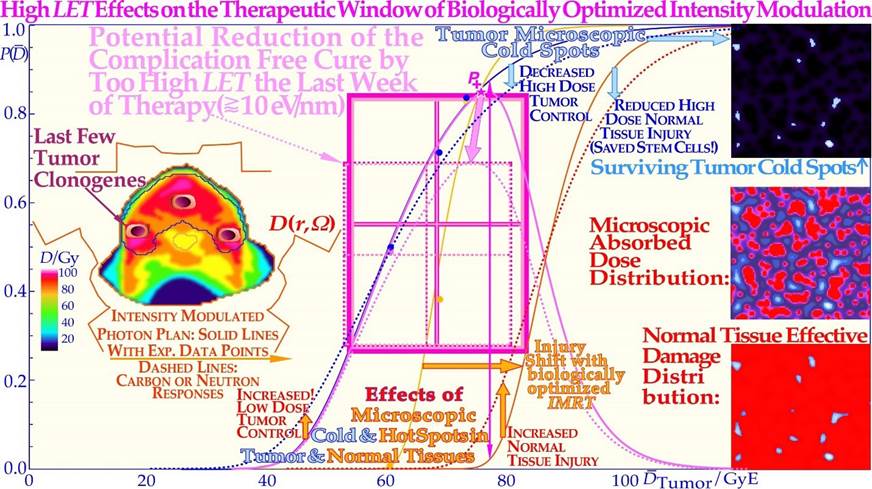
Figure 18a: A A too-high LET have adverse effects both on the complication-free cure (P+) as it reduces the high dose tumor cure and simultaneously increases normal tissue injury (dashed lines; solid lines: [38, 51]: Figure 4, [71]). Interestingly, there is a very costefficient clinical solution to this problem: by switching to electrons, photons, and in special cases even protons during the last week of treatment. This will lead to a steeper tumor response ([1]: Figures 20 and 22, [7]: Figure 16, [49]: Figures 8.10 a, b), generating a higher complication-free cure, all at a lower delivered dose equivalent (see Figure 15 for Ne + e-) and reduced risk of damaging normal tissues, as demonstrated here. P (D$) is the probability of tumor control or normal tissue damage as a function of the mean tumor dose (cf also Figure 18b).
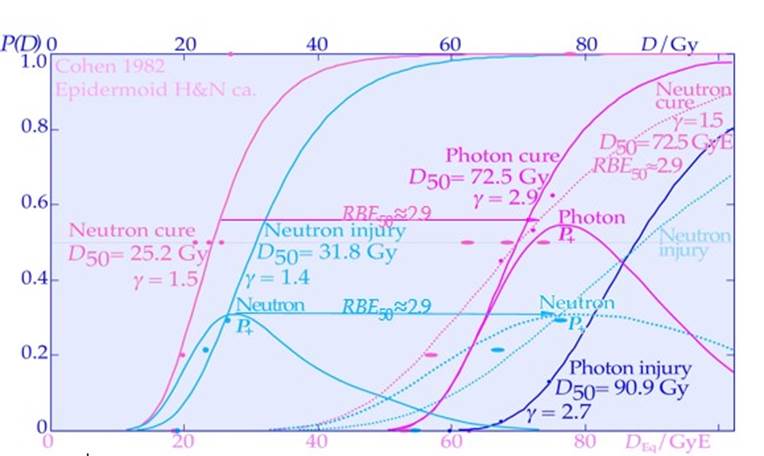 .
.
Figure 18b: Clear clinical neutron and photon dose response data showing the reduction in complication free cure by a too high microscopic heterogeneity in dose delivery using neutron therapy. The adverse effect of a too-high LET on the complication-free cure reduces the tumor cure and simultaneously increases normal tissue injury (doted lines and lower DEq scale for neutrons; solid lines and upper scale: from [67] and [59]: Figure 9,). Interestingly, the cost-efficient clinical solution is to switch to electrons or photons the last week of therapy with very few remaining hypoxic tumor clonogens and reduced need for high LET dose delivery. Interestingly, the effective RBE for the tumor and normal tissue responses are very similar as also shown in Figure 18a. The loss in dose response slope does not change the dose interwall between the curves but mainly the complication free cure distance between them as especially seen at peak P+ around 78 GyE! P+ for simplicity determined from Eq (1) with δ ≈ 0.
Optimal Time Dose Fractionation
The rapid and efficient repair of sublethal damage induced by low LET radiation between ≈ 0.5-2.3 Gy can be used to optimize the treatment outcome during fractionated radiation therapy. Most normal tissues poses a general low-ionization density daily fractionation window as seen in Figure 19 [2, 3, 38, 71, 72], as was mentioned in connection with Figures 4- 7. In fact, to minimize the effect of the LDHS, in normal tissue there exists an optimal daily fractionation window at approximately 1.5- 2.3 Gy/fraction where the shallowest tangent from the origin touches the cell survival curve at approximately 2 Gy (cf. Figures 7 and 19). This is therefore the optimal dose/fraction to an organ at risk near the tumor when very high therapeutic doses to the tumor must be delivered. Using such a dose per treatment fraction in the normal tissues around the tumor also means that the tumor dose is significantly higher, by a factor of approximately 1.2- 2, and the tumor will suffer significantly more damage, especially with mutated DNA repair genes. The fact, that the 2 Gy/Fr dose level has been generally used over the last 70 years in clinical radiation therapy to maximize cure and minimize normal tissue damage, which indirectly supports the existence of the LDHS phenomenon in most normal tissues as explained in molecular terms in Figures 4 and clinically in Figures 6, 7 and 19. As discussed above the first quarter to half Gy induces Low Dose Apoptosis (LDA) to avoid mutations in normal tissues before full DNA repair is induced at about half a Gy. It is then optimal to deliver a further dose of ≈1.5 Gy with full repair capacity induced and a very shallow dose response as seen in Figure 19. At higher doses the risk For High Dose Apoptosis (HDA) induction instead becomes a problem as seen in to the right in Figure 4.
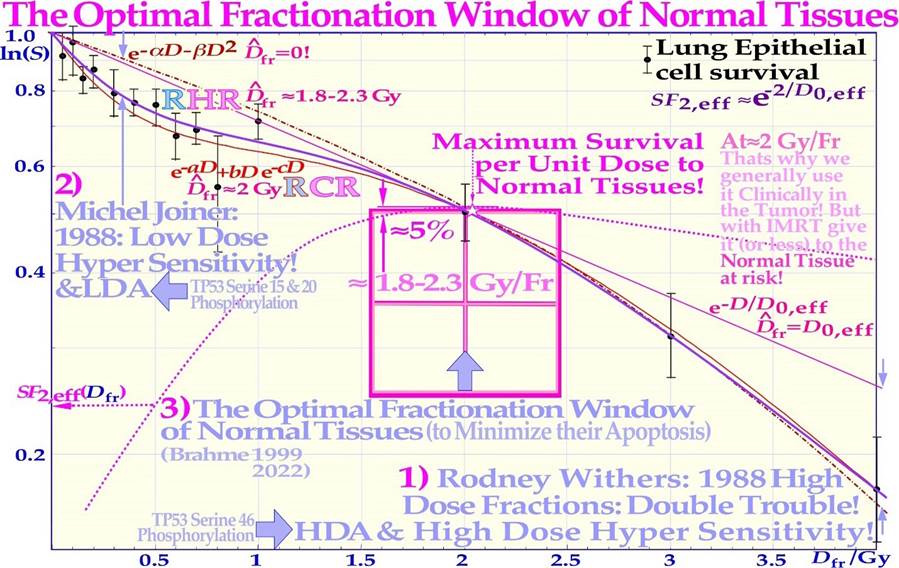
Figure 19: The fast low-dose initiation of full DNA repair first causes low-dose hypersensitivity and apoptosis but is followed by almost a plateau of effective repair and improved cell survival per unit dose. In normal tissues, there is therefore a daily fractionation window ≈ 2 Gy/Fr (≈1.8- 2.3 Gy, [2]: Figure 5), where the least detrimental response is obtained (SF2 ≈ 0.52 and D0,eff ≈ 3.1 Gy) for a given therapeutic dose level having to be delivered to the neighboring tumor volume (cf Eq 3). The dashed curve shows how the surviving fraction at 2 Gy (SF2) varies with the dose per fraction on the horizontal axis, having a clear maximum near 2 Gy. This is probably the main reason why in classical radiation therapy, where the tumor and normal tissue doses were often rather similar, the dose was best tolerated ≈ 2 Gy per fraction. For light ions with largely a low LET in normal tissues, such as lithium to boron ions, the normal tissue dose should preferably also be in this range unless there is a substantial high LET dose spillover to critical normal tissues surrounding the tumor region. With well-optimized IMRT dose delivery, the tumor dose could simultaneously be ≈ 1.5 or more times higher, and in addition, the biological effectiveness is significantly increased. This makes the total increase in therapeutic effect in the tumor approximately two to three times higher and more, particularly for smaller tumors. Unfortunately, this recommendation was not well understood by the community, who conservatively continued giving 2 Gy/Fr to the tumor. Now is the time to change, as discussed in further detail around Eq (3).
In addition to this daily fractionation window, by giving higher doses per fraction on days where there is a longer time for sublethal damage repair before the next treatment, it is largely possible to compensate for the two missing dose fractions over the weekend and thereby better maximize HR repair. The optimal weekly fractionation window is illustrated in full detail in Figure 20, showing that simply by increasing the dose on Friday and utilizing the weekend for repair (cf insert), a gain in complication-free cure (P+) of approximately 6% can be achieved. Due to the effective weekend repair, the dose fraction on Monday could also be increased to gain a further 3% in P+. A total gain in P+ of approximately 12% is possible by giving high doses Monday morning and Friday evening, lower doses Tuesday and Thursday evening, and rather high doses midday on Wednesday and the last day of treatment, as seen in Figure 20 [3, 72].
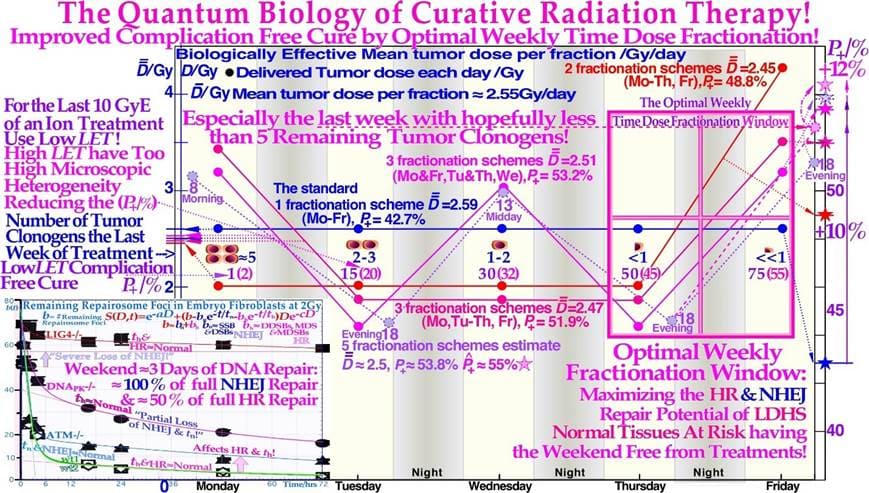
Figure 20: Improvement in complication-free cure by up to 12% (P+, right scale), using an optimal weekly fractionation schedule to make the weekend free from treatments and maximizing the sublethal damage HR repair in normal tissues as seen in the lower right insert. The insert also shows decreased reparability with key DNA repair genes knocked out [3, 39]. The fast NHEJ is clearly separated from the slow HR repair, especially for wt1 and wt2. As expected, the fast part was almost totally lost for the Lig4 knockout cell line. Interestingly, the improved normal tissue repair capability is particularly valuable during the last week of treatment when the tumor burden is reduced and normal tissues suffer the most after a several weeks of treatment. Nevertheless, the last treatment fraction should be high to use the extra repair potential at the end of treatment. Clearly, the advantage of a low-LET round-up after a high-LET treatment will generally optimize the whole treatment procedure, not least using the present fractionation approaches. As seen in the middle row of cells and violet numbers, a low LET round up regain the highest possible P+.
High-dose fractions should be given only when there is a longer delay until the next dose fraction: either more than 60 h over weekends or more than 29 h when followed by a lower dose. Such a fractionation schedule maximizes the use of sublethal DNA damage repair particularly via the HR pathway in tumor-surrounding normal tissues. The tumor, often with a mutated TP53 gene and/or repair genes (e.g., ATM and DNApk), has no advantage with a 60- 100% longer repair time, as shown in the lower left insert in Figure 20 (cf [3]: Figure 10 and its accompanying table). Furthermore, as shown in the lower left insert in Figure 20, this dose level also allows NHEJ to function very effectively daily, and HR to ≈ 50+ % over the weekend for most normal tissues. To conclude, if the dose per fraction to normal tissue is approximately 2 Gy and the dominating NHEJ repair pathway is intact, a normal tissue, minimal damage weekly fractionation window is established [2, 39, 72], as inherently described by the current repair model; and it applies to all ions from helium almost up to boron ions (cf Figure 32 and [1]: Figure 7) by most importantly largely avoiding an elevated LET´s in normal tissues!
The 4D-Space-Time of Ion Therapy Optimization
Interestingly, the proposed switch to a low LET simultaneously increases the steepness of the dose- response relation and thus enhances the therapeutic window and increases the complicationfree cure through less normal tissue injury and simultaneously solving all the high-LET heterogeneity problems indicated in Figures 13-21. The reason it works so well, is that there is no longer an excessive microdosimetric variance in the final dose delivery, causing an increased dose response steepness, less normal tissue damage, and a higher curative response. In retrospect, there is actually a clinical demonstration of the value of using low-LET dose delivery in addition to high-LET treatments in the interesting US clinical trials of neutron therapy. Not only was it shown that the first ever gantry- mounted about 1m thick pure electrolytic iron multileaf collimator (to minimize neutron activation) in Seattle provided much less normal tissue damage than the ordinarily used block collimation inserts (grade 3 and 4 cumulative late normal tissue toxicity rates was reduced from 39% >10% [71]) but also the use of mixed beam treatments where a photon addition was found to be quite advantageous, as discussed in detail elsewhere [8, 49, 73-82]. The above discussion was not too well understood at that time, and the results could most likely have been improved even further, as discussed here, but it is not excluded that the somewhat better dose delivery with photons may also have contributed to the improvements even if a small net survival advantage was seen with neutrons for prostate cancer [79]. Interestingly, the optimal transition from a high to low LET should be when only a handful of tumor clonogens remain and most of the severe hypoxia is gone, preferably following the last weekend of neutron or ion treatments, giving an extra valuable HR-dependent DNA repair and hopefully a tissue reoxygenation boost, as shown by the insert of Figure 20.
In fact, the discussion above about the last week of therapy should also apply at least partly to the previous week because the periphery of the initial internal target volume [83] may only harbor a lower density of tumor cells either due to microscopic growth or diffusion of tumor cells and/or to an added setup margin to account for organ motions and establish set up uncertainties [83], as seen in Figure 21. Independent of the exact reason, this margin is also unlikely to harbor high numbers of hypoxic or radiation-resistant tumor cells, and it therefore does not truly benefit from an elevated LET treatment that unfortunately is likely to cause unnecessary normal tissue damage, as discussed above and explained in Figure 18. Therefore, the last part of the second-to-last week of therapy may also benefit from a switch to low-LET irradiation (see the few tumor clonogens in the penumbra region in Figure 21), although now possibly together with a dedicated high-LET boost but only to the original gross tumor volume that still may harbor some hypoxic or radiation-resistant clonogenic tumor cells [4, 8, 47, 63, 66, 69]. Interestingly, the last week and a half of the treatment can thus largely be considered a low-LET treatment of the periphery of the four-dimensional space- time internal target volume [83], as shown in Figure 21, for simplicity and clarity drawn assuming an initial cubic tumor volume. The target volume is shown to shrink in the fourth time dimension for simplicity and clarity and to obtain a real 4D perspective. The true tumor volume may shrink slightly during treatment but not necessarily, e.g., if we truly manage to induce massive senescence (cf Figure 31, [6] and [42-44]). The initial setup margin (pale pink) and the few remaining gross tumor clonogenic cells at the beginning of the last week of therapy (green volume in Figure 21) are all randomly located in the 4D space- time internal target volume [83]. This volume will benefit from the lowest possible LET to secure the highest complication- free cure and steepest possible tumor response, avoiding tumor microdosimetric cold spots as well as avoiding peripheral organs at risk of hotspot damage with high-LET beams (Figure 18 and [3]: Figures 20 and 22, [7]).
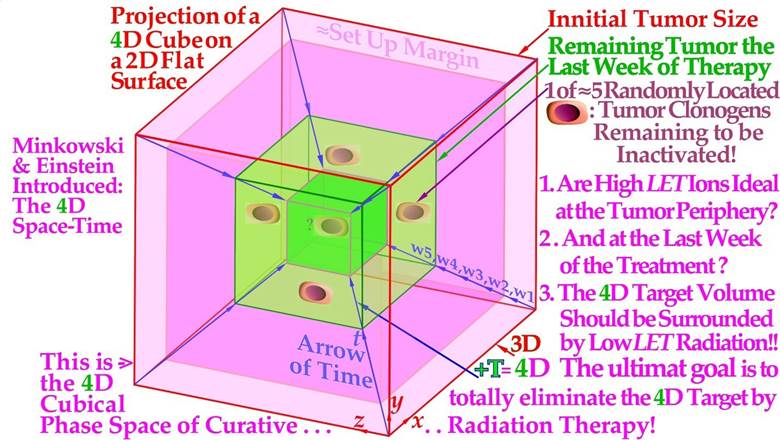
Figure 21: A cubic 4D space- time internal target volume is projected on a 2D flat surface showing the need for low-LET electrons or photons to round up an optimally performed high LET light ion treatment. Like a 3D cube in 2D is two squares with all corners connected, and a 4D cube in 3D is two 3D cubes with all their cubical corners connected, in this case with the blue fourth dimension time arrows connecting the pink and green cube corners in this Figure. The periphery of the 4D internal target volume [81], including the initial setup margin (pale pink) and the few remaining gross tumor clonogenic cells (green volume), will substantially benefit from the last 10- 15 GyE being delivered with minimal LET and microdosimetric variance using electron or photon beams. Interestingly, both the few remaining clonogenic tumor cells in the gross tumor and the setup margin are best eliminated with an optimized 15 GyE low-LET treatment round-up, and for bulky tumors, the first 5 GyE of those may include a concomitant higher-LET initial gross tumor boost in case of a possible risk of an hypoxic remainder [8]. This is different from the fractional 4D problem of dynamic therapy [84].
Accounting for Tumor Hypoxia
The biological effect of low-to-medium LET radiation is dependent on the local oxygen concentration in the cells since oxygen radicals then mediate a substantial part of the cell death. Often, this makes well oxygenated normal tissues suffer radiation treatment more than generally hypoxic tumors. With low LET, an often 2- 3 times higher dose is needed to eradicate hypoxic tumor cells compared to well-oxygenated tumor cells. For high LET radiation, such as light ions, this so-called oxygen enhancement ratio is reduced for hypoxic tumors (OER≈1.5- 1.7). Furthermore, light ion Bragg peaks that are applied only in the tumor volume further improve this fact since the high dose and LET are then mainly present in hypoxic tumor cells and not in normal tissues. With QMRT, the highest LET Bragg peaks could even be reserved for the hypoxic core of the tumor [49-52].The clinical problems of a very small hypoxic tumor cell fraction (10-5) affects an otherwise well-oxygenated tumor are clearly demonstrated in Figure 22. In the first approximation, it does not matter whether the cells are spread out or nodal. The blue curve shows the response of the well oxygenated fraction as a function of the dose equivalent in GyE, so the same curve holds approximately for photons and carbon ions (the real carbon curve slope should due to heterogeneity effects actually be more similar to the red curve). The difference comes from the few hypoxic cells that are easily cured by the carbon ions, dotted red curve, so the total tumor is just shifted a GyE or two. With photons, the hypoxic cells need some 15 Gy extra (dotted pink curve) due to their high OER, so they totally dominate the tumor response, and these few most resistant cells determine the low clinical response slope γC ≈3 a severe reduction from the oxic value of almost 7 for ≈ 5 cm tumor (γC ≈lnN/e, cf Figure 13).
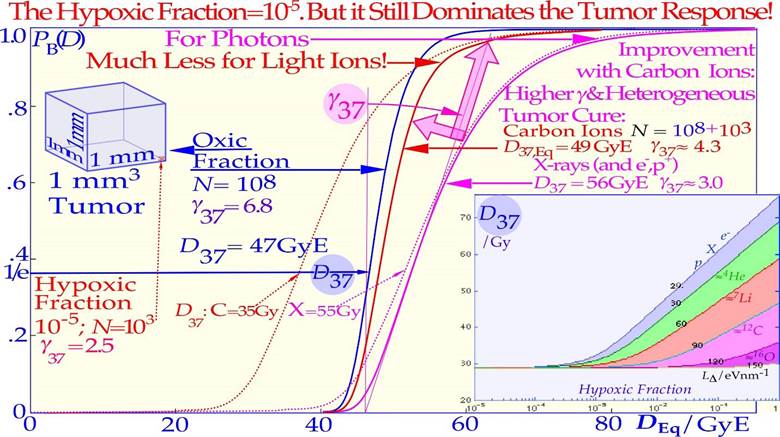
Figure 22: A very small hypoxic compartment can totally dominate a low LET treatment, whereas with higher LET lithium and carbon ions, they are not such a big problem and only marginally increase the effective dose needed for cure. With increasing hypoxia, D37 (and D50), the low LET dose causing 37% (and 50%) tumor cure, increases rapidly, as seen in the right insert. However, the normalized slope (γ37)of the dose‒response relation (DRR) first decreases at low LET values as the hypoxic fraction increases due to increasing tumor heterogeneity and a dominating small hypoxic compartment and then increases as most of the tumor clonogens become hypoxic (cf Figure 26 insert). The figure shows how the loss in (γ37) and increase in D37 and D50 are substantially smaller with high LET lithium or carbon ions, as shown in more detail in Figures 24-26.
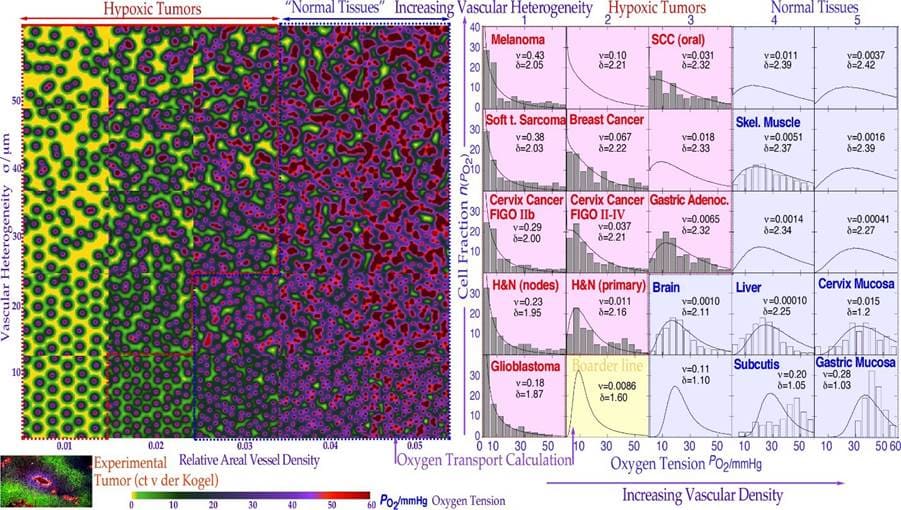
Figure 23: Illustration of how a reduced density and increased randomness in the geometric distribution of blood vessels reduces oxygenation, particularly at large distances from the vessels, and increases the number of cells with significant hypoxia (Po2 < 5%). The color look up table (lower left scale) was adopted from that of hypoxic tissue markers (lower right insert, courtesy van der Kogel). The vascular model of oxygen diffusion as seen to the right is given here by the solid line cellular oxygenation curves and often agrees very well with many clinically observed Eppendorf data sets for tumors (pink panels with gray histograms in the left half) and normal tissues (blue panels with open histograms in the right half). It is clearly seen that most tumors have a significantly low oxygenation and radiation-resistant cell fraction as opposed to most normal tissues that are well oxygenated and radiation-sensitive and lack a severe hypoxic cell fraction that characterizes hypoxic tumors.
The change in oxygenation status in 25 cubic cm-sized pieces of tissue of varying vascular density (x-axis) and vascular heterogeneity (y-axis) are shown in Figure 23. The calculated oxygen tension distribution in a section of the cube is color coded the same way as the experimental tumor sample [85,86]. In the right half, the average oxygenation curves of each cube are shown (solid line curves) in rather good agreement with experimental Eppendorf histogram data (tumors: pink shading, normal tissues: blue shading [86]).
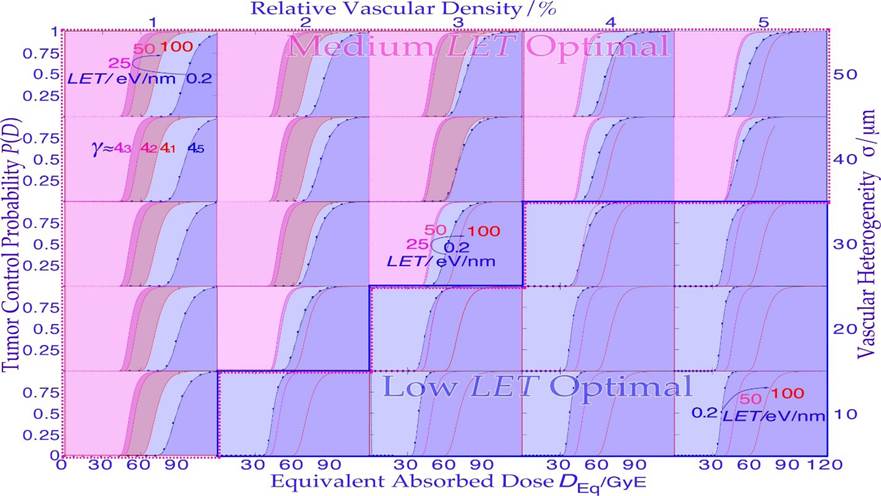
Figure 24: Overview of how the effective DRR is influenced by the LET off the beam from 0.2 eV/nm photons via 25, 50 to 100 eV/nm carbon ions for each cubic tissue type taken from Figure 23. Interestingly, the medium LET in the neighborhood of 25 eV/nm is most efficient for most hypoxic tumors (pink background), whereas X-rays or electrons are optimal for more well-oxygenated tumor tissues such as nonradiation-resistant tumors (lower right corner, blue background, cf Figure 18b).
It is quite clear that a low vascular density and high heterogeneity are characteristics of most hypoxic tumors in the upper left corner of the diagram. The oxygenation curves in Figure 23 are converted to dose response relations of varying steepness as the hypoxic fraction and mean LET increase, generally requiring higher doses as the hypoxic fraction increases, as seen in Figure 24. Furthermore, it is seen how a small hypoxic fraction in a tumor significantly reduces the slope of the DRR with low LET photons (cf Figure 22). Interestingly, the most advantageous dose‒response relationship with the lowest equivalent dose to the patient is generally at a quite low mean LET near 25 eV/nm (Unfortunately, the effect of microdosimetric heterogeneity is not considered in Figures 22-24). However, since the microdosimetric heterogeneity mainly affects the higher LET curves, the conclusions are still largely valid. To show the detailed effect of the microdosimetric heterogeneity, Figure 25 shows a close-up of Figure 22, where some of the key light ions (Li, B, C) are compared with photons (and electrons). Here, the effective RBE of the ions is also considered, as seen by the fine red lines for carbon ions, and the hypoxic fraction was doubled to make it slightly closer to common clinical situations requiring 64-68 Gy with photons. An RBE of ≈ 1.5 is sufficient to make the hypoxic fraction have a marginal influence on the hypoxic dose response relation for carbon ions, and boron is rather similar, with a few percent higher PB. Lithium ions can bring the γc value up to 5 and may reach an increase in PB of ≈ 10% compared to carbon. However, the principal gain with these lighter ions is actually in the lower LET in normal tissues, largely recovering the fractionation window of photons and electrons (cf Figures 6 and 7, [2]).
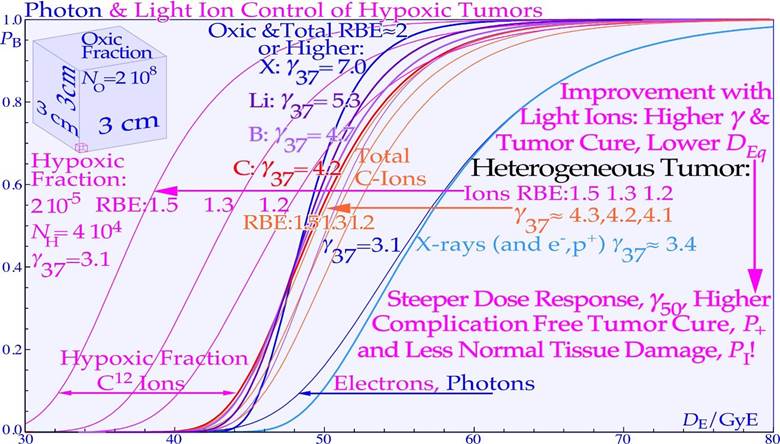
Figure 25: A more detailed study of the dose response relation of hypoxic tumors taking the microdosimetric heterogeneity of the ions into account (cf Figures 15, 18 and 22, [2]). An RBE of ≈ 1.5 is almost sufficient to make the hypoxic carbon response equal to that of well-oxygenated cells (thin and thick red curves, γ37 ≈4.2). However, boron and lithium ions with γ37 values of ≈4.7 and 5.3, respectively, may reach this RBE and thus have a 10% higher cure probability than carbon ions. Of course, this is only a mildly hypoxic tumor but a rather common kind requiring ≈ 66 Gy photons for 90% cure probability. The new approach switching to electrons, photons or even protons in the last 10 GyE may still be even better, especially for severely hypoxic tumors. Many clinical tumors are close to the lowest γ37 value (≈2-3.1 as in this case) due to hypoxia, and lithium to boron ions can bring this low point back up to γ37 ≈ 4-5 region with a steeper and more effective dose response not least with a well-designed low LET round up!
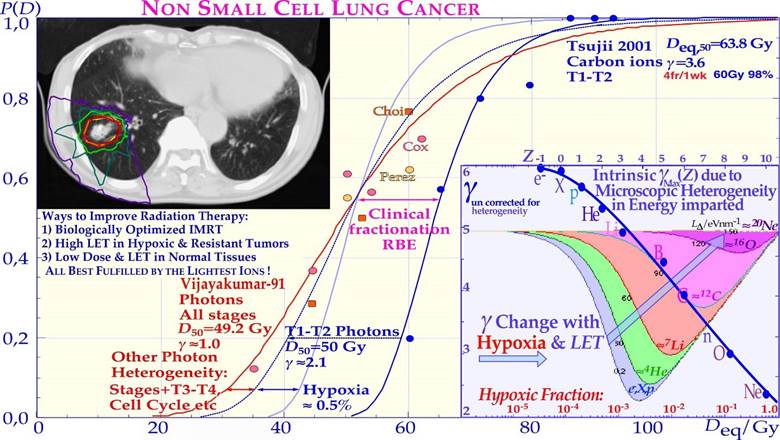
Figure 26: Comparison of Clinical results using photons with carbon 12 ions showing an advantageous steep DRR for lung tumors. There is significant improvement in efficiency, and cure compared to conventional radiation therapy. The increased steepness improves the therapeutic window and is due to a more efficient killing of hypoxic tumor cells. The change in the normalized dose- response slope as a function of the hypoxic fraction and ion species is shown in the lower right insert. The normalized slope of the Dose Response Relation (γ37) in the first approximation decreases in low LET beams as the hypoxic fraction increases due to the increasing tumor heterogeneity with a dominating small hypoxic compartment, as seen in Figure 22. After ½ % hypoxia, it starts to increase again as most of the tumor clonogens become hypoxic (decreasing tumor heterogeneity). However, as the microdosimetric heterogeneity comes into play in beams of increasing LET, the intrinsic loss in γ to γMax (cf. Figures 15- 18) limits the regain in slope, as shown by the inserted blue curve. This effect will be less pronounced in the low D37 values shown in Figure 22 but may influence the D50 and D90 values. Most of the loss in the dose- response slope for photons is due to hypoxia. The variation in sensitivity over the cell cycle [3] and with tumor stage can also affect the response slope, not least for photons.
The clinical data on hypoxic lung tumors treated by carbon ions and photons are summarized in Figure 26, clearly showing the value of higher doses and less normal tissue limitations by carbon ions even though the γC value is fairly low, as expected from their microdosimetric heterogeneity. It is still significantly better than that for photon treatments, partly due to a larger influence of hypoxia but also due to a wider range of tumor sizes and other photon-related tumor heterogeneities. It is most likely that this group of small lung tumors (T1-T2) could advantageously be treated with lithium ions resulting in fewer normal tissue reactions.
Radiation Quality
From the interesting cell survival curves in Figures 5-7 and dose response relations for photons and light ions in Figures 15, 16, 22, 24-26, one can naturally ask which beams are most suitable for radiation treatments to minimize adverse reactions in normal tissues and maximize the complication-free cure.
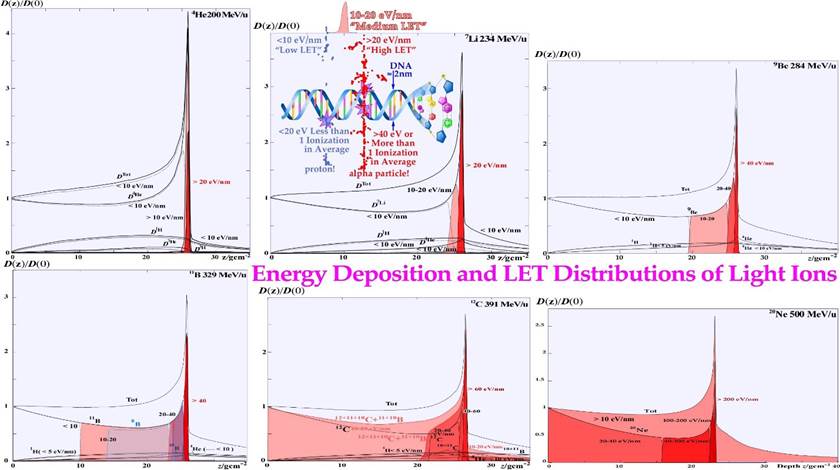
Figure 27: Depth dose and LET distributions for the 5 lightest ions after protons: helium, lithium, beryllium, boron, carbon and neon that were carefully tested at Berkeley. The dose fraction delivered at an ionization density below 10 eV/nm is unshaded because when an ion passes, a 2 nm DNA string less than 20 eV is on average deposited, so no local ionization is generally obtained on average, as seen inserted in the upper middle panel. It is clearly seen that lithium has a high ionization density only in the Bragg peak, whereas carbon has it 5 cm in front and 10 cm behind the Bragg peak. Lithium is therefore the most conformal radiation modality, only providing significant apoptosis and senescence in the few mm Bragg peak, which is perfect for inducing programmed cell death only by its peak ionization (cf [6]). The high LET component increases rapidly from only a few percent for protons and 50% for helium and 80% for lithium. For carbon, the high LET region extends ≈5 centimeters in front of the Bragg peak and ≈10cm behind it. Beryllium and boron ions are located between lithium and carbon and are of interest for medium size tumors.
This question was recently discussed in some detail [2, 3, 6, 7, 23], and many of the new biological ideas discussed here may need renewed consideration. The classical quantities discussed in the photon era are the penumbra width (P80-20≈3-5 mm), skin dose (D0.5≈3040%) and HVD (R50) dose max depth (R100), and with electrons, the therapeutic and projected range (R85, RP) and bremsstrahlung background (DX≈1-5%) need to be added. With light ions, many of these are still highly relevant, such as penumbra width, skin dose and fragmentation tail (DFr), which can become quite substantial from carbon and beyond, as seen in Figure 27. To look close up on what is probably the most interesting ion for radiation therapy of bulky tumors: boron 8, and to compare it with the presently dominating carbon 12 ion, their dose and LET distributions are assembled together in Figure 28. Most interesting is that we can see a significant reduction in the plateau region ionization density with boron 8 ions (and 11 cf Figure 27). Not only is all the medium LET region of carbon replaced by low LET boron ions, but the ≈5 cm wide high LET region in front of the carbon ion Bragg peak is only 2 cm with boron ions, and the fragmentation tail is practically all low LET. Interestingly, this will increase boron apoptosis and senescence in the tumor and simultaneously reduce it in normal tissues, as recently demonstrated experimentally ([1]: Figs. 7, 9, 10, [2]: Figs. 3, 6,[3]: Fig. 22, [7]: Figs. 4, 16). The only drawback is that Boron 8 is unfortunately difficult to produce since it is our lightest β+ emitter with a half-life of just under a second. Interestingly, this makes it possible to visualize the dose delivery in real time during treatment by whole-body PET- CT imaging. This is possible since the acceleration is fast (msec) and as the ion comes to rest in the tumor, it will emit its positron within a second or two so it has to be imaged during treatment unless the treatment is done in a fraction of a second and the patient can instantly be moved to the PET-CT camera (20% is left after ≈1.8 s). It is possible to produce boron 8 in flight in a boron 10 beam on a liquid deuterium target, but the yield is quite low (less than 0.001 [87] as two neutrons need to be removed). It will probably be more efficient to use a beryllium 9 beam on a liquid hydrogen target to knock out a single proton and use the filtration techniques developed at Karolinska for [88-90, cf also 91, 92], or the interesting method developed at CERN may even be the most optimal approach [93].
The SOBP method generates strong variations in ionization density and absorbed dose. The variation is a factor of approximately two over the whole target volume for carbon ions, with a too low LET at the anterior end and too low dose and too high LET at the distal part of target volume, as seen in Figure 29. This significantly increases the risk of microscopic cold spots at the distal part of the target volume ([3]: Fig 22, [7]: Fig 16). A more scientific approach would be to use mixed-modality treatments that can make the absorbed dose and biological effect almost constant, as seen in Figure 30 [3, 7, 39, 47, 95], or even locally elevated, e.g., in regions of strong hypoxia [2, 47, 66, 86, 95]. The very flexible method of mixing two ions with largely different ionization densities ([7, 39, 53, 86, 95,96], such as He or Li and B or C, is more flexible than using the Spread-Out Bragg Peak method, which in fact, works well only for protons, as seen in Figure 29. The very high distal LET and very low dose, as seen in this figure in a region that is largely consisting of a set up margin, is a suboptimal treatment considering heterogeneity and side effects.
What truly requires new thinking is the 4-dimensional aspects discussed in Figures 20 and 21, such as the time dose fractionation, the internal target volume and the quantum biology effects the last weeks of the treatment, and they are very important to consider (cf. Figure 21; counting dose, energy and lineal energy is actually already 7 dimensions). The new idea to more seriously consider the microdosimetric heterogeneity of the beams (cf. Figures 13-18) and to take it into account, especially the last week and a half of the treatment [2], is an interesting opportunity to at the same time recover the steep dose response relations, e.g., of well oxygenated head and neck cancers for photons (γC ≈5-6 [69]). Interestingly, this can be achieved by switching the last week of an ion treatment to a low LET
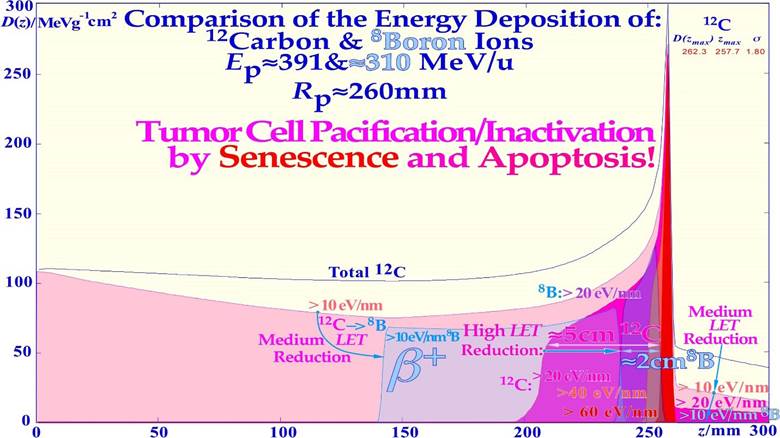
Figure 28: Carbon ion with superimposed boron ion beam depth dose and energy deposition density distributions (LET) for biological effect comparison. The adverse biological effects of carbon ions in the entrance and fragmentation tail regions are significantly reduced by boron ions (blue shading). With sensitive organs at risk in front of and behind the tumor volume, the high LET reduction will also be a further important advantage of boron ions, as they will generate more apoptosis in the tumor than carbon ions, as recently demonstrated [1-3, 7]. Interestingly, this is also likely to partly reestablish the important low LET fractionation window of photons in normal tissues with boron ions (cf Figure 7, and [2]: Figure 5)! Unfortunately, the carbon ions also get far too dense DDSB clusters toward the Bragg peak, as shown recently ([23]: Figures 13 and 14), also indicating the need for lighter ions.
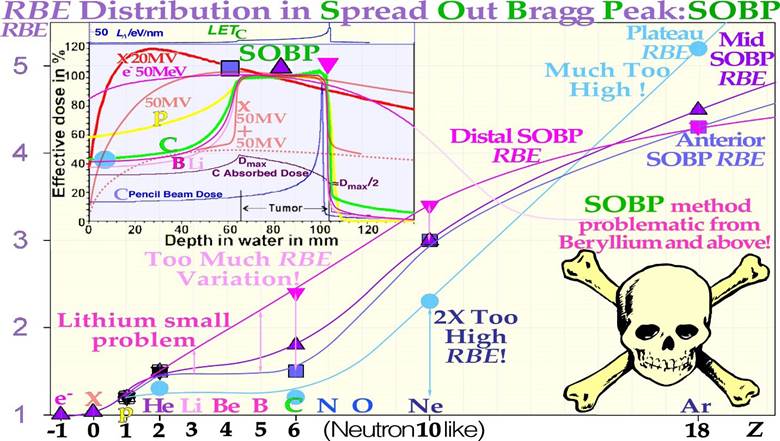
Figure 29: The relative biological effectiveness varies over the SOBP. This will make the dose at the distal target volume low and LET very high, making the risk for microscopic cold spots high and increasing the risk for a recurrent tumor [2]. Two perpendicular highenergy electrons and photons, beams make a sharper and better high-dose dose distribution than a proton SOBP even if the dose behind the tumor is lower with p (but accompanied with neutrons [7, 8]), making He, Li, B, and C ions most interesting from a therapeutic point of view. With B or C ions and He or Li ions, the method with two different intensity modulated beams will eliminate the single beam SOBP problem above, as shown in more detail in Figure 30. round up with minimal microscopic dose delivery heterogeneity, and thus at a time when the most severe hypoxia is gone. Thus, replacing the last one or two ion treatment fractions by 10-15 Gy preferably using electrons or photons but also protons will do, e.g., at an ion center, as discussed in further detail in Figure 21 above.
Apoptosis is nature’s own way to eliminate unwanted cells during the development of practically all organs and is therefore not generally associated with an inflammatory response accompanying the more common necrotic type of cell kill. Furthermore, the light ions also have an increased induction of senescence, that is, permanent cell cycle arrest, as seen in Figure 4. Senescence is therefore probably the most desirable endpoint of all cancer therapies, as the tumor cells can then lose their reproductive ability and slowly disappear depending on the remaining cellular half-life of ≈2.5 y. As seen in Figure 31, the chordoma treated was reduced to half its size or 10% to 15% of the initial volume six years after the treatment [49, 95, 97-99]. Because more ions per unit dose and cell kill are needed at medium to low ionization densities, more effective apoptotic and senescent responses are obtained at ionization densities of 20 eV/ nm to 40 eV/nm, as shown theoretically and experimentally [1, 2, 7, 39]. Interestingly, helium, lithium and beryllium combine a high local apoptotic and senescent tumor cell inactivation only a few mm around their Bragg peaks and can thus be regarded as the ultimate stereotactic, conformal and even molecular radiation therapy modalities [6, 49, 55, 87].
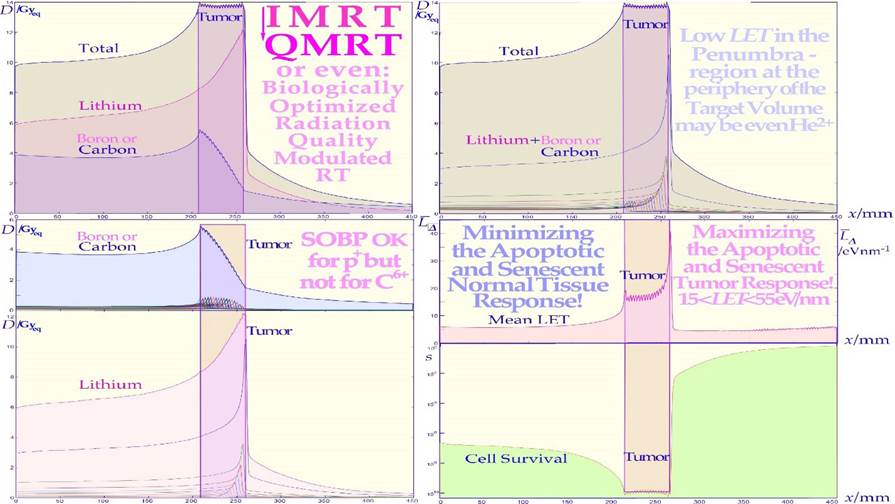
Figure 30: A quality modulated or quasiuniform absorbed dose and cell kill distribution can be generated by combining lithium and boron or carbon ions in suitable ratios. The small local fluctuations in absorbed dose are due to a somewhat large longitudinal range modulation (3 mm) used to clearly illustrate the applied mechanism combining lithium and boron or carbon ion Bragg peaks at each depth interval. The different panels show the total absorbed dose and the boron or carbon doses and the lithium dose in the upper row and lower left, whereas the cell survival and mean LET distribution are shown on the lower right. Interestingly, by combining lithium and boron or carbon, a uniform biological effect, survival, and absorbed dose can be obtained both for uniform tumors and with an optimal biological effect modulation for heterogeneous tumors [36, 48, 60, 76-78].
Optimal cancer cell inactivation would benefit substantially by a treatment modality that preferentially induces senescence, probably the most cost-efficient treatment to stop further cell cycling and block tumor growth. Actually, this is probably also the mildest but still efficient end point to cure a cancer [2, 6, 41-44, 100, 101], as it can make the clonogenic tumor cells lose their uncontrolled cell cycling ability, as seen in Figure 4. The induction of autophagy (self-digestion) and apoptosis (programmed cell death Figure 4) may follow more severe DNA damage to minimize cancer induction with more complex DNA damage and increased risk for severe mutations, e.g., with turned-on oncogenes or lost suppressor genes. Lithium ions are probably the optimal ion, at least for smaller tumors (see Figures 4 and 29, [2]: Figure 3, [1, 3, 6, 95]) and pediatric patients. The major advantage of molecular radiation therapy with lithium ions is the low-ionization density in all normal tissues, largely inducing fast DNA repair while often inducing apoptosis and senescence only in the tumor volume. For the same reasons, medium- sized tumors are probably best treated using boron ions, but this may sometimes require an extra beam portal compared to carbon ions, especially for larger hypoxic tumors.
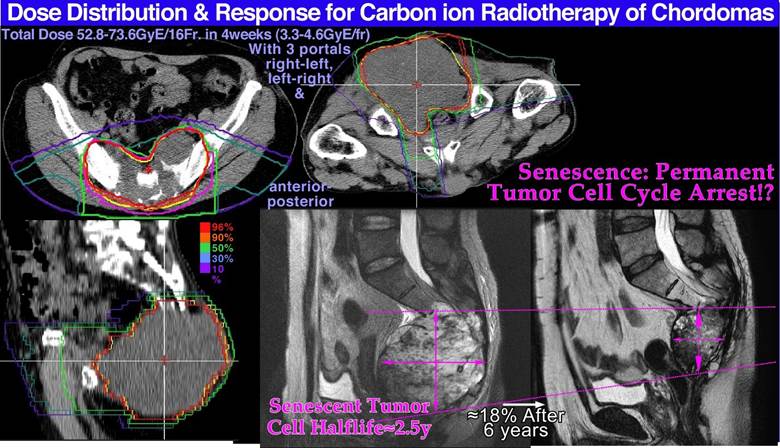
Figure 31: The dose delivery for a large pelvic chordoma as shown in the upper and lower left treatment plans. The lower right plain MR images show the gradual disappearance of the chordoma six years after the treatment, probably due to a massive senescent response without traces of tumor growth. This treatment was made with carbon ions but could most likely with advantage be done with boron ions as seen by the B and C ion LET data and apoptosis in Figures 5, 29, 33! (Courtesy: Hirohiko Tsujii, NIRS, Chiba, Japan).
Secondary Cancer Risks
The new power of being able to approximately quantify apoptosis makes it possible to better estimate the probability of inducing a secondary cancer especially with experimental cell survival and apoptosis data as shown in Figure 32 (cf [2]: Figures 7 and 9). It is unlikely that the apoptotic fraction will contribute to secondary cancer induction (except possibly in TP53 mutant cell lines that may integrate fragments from apoptotic bodies into their genomes!), so it is useful that this fraction can be estimated using the new RHR formula and removed from other forms of misrepair to more accurately describe the cells that are potentially capable of generating a secondary cancer. This cell fraction, as shown in Figure 32, has its secondary cancer induction peak in the 3 GyE/Fr region, so in radiation therapy optimization, it is truly desirable to minimize this volume in normal tissues as much as possible. Figure 32 also shows that the maximal risk is the smallest for low-LET ions (blue-shaded), largely due to their high apoptotic fraction induction. The real secondary cancer risk may be on the order of 5% of the maximal values in Figure 32 or less. Obviously, these experimental data are not truly relevant for all surrounding normal tissues that may receive a fair dose and are at risk for secondary cancer. However, the present tumor cell line is at least wt TP53 so probably not the most extremely mutated one and may, in a first approximation, be assumed to be representative both for normal and tumor tissue risks. Furthermore, the dose axis is clearly the dose per fraction, so it means that the total dose is increased by the number of fractions used. Interestingly, the plot is drawn as a function of dose equivalent (dose x RBE; the 50% survival RBEs used are given in the figure), so all the maximal doses align very well, indicating that the ion with the lowest LET and highest apoptosis will always minimize the secondary cancer risk for a given delivered dose equivalent. In fact, just as nature arranged it with the LDA to avoid cancer before full repair is induced (cf Figure 4) but this time HAD is mainly involved [1]. Notably, this secondary cancer risk is a contraindication for large, low-dose volumes with many beam portals in intensity-modulated photon therapy using methods such as “rapid arc”, “volumetric arc”, and “tomotherapy” on nonseniors, which may have time to develop secondary cancer after 15-20 years [8, 56, 102, 103]. Interestingly, the new fractionation procedure proposed above (sec 5.3) and the new treatment approach suggested in Figure 6 will allow fewer beam portals and higher tumor doses with fewer adverse reactions in normal tissues using ordinary fixed beam delivery.
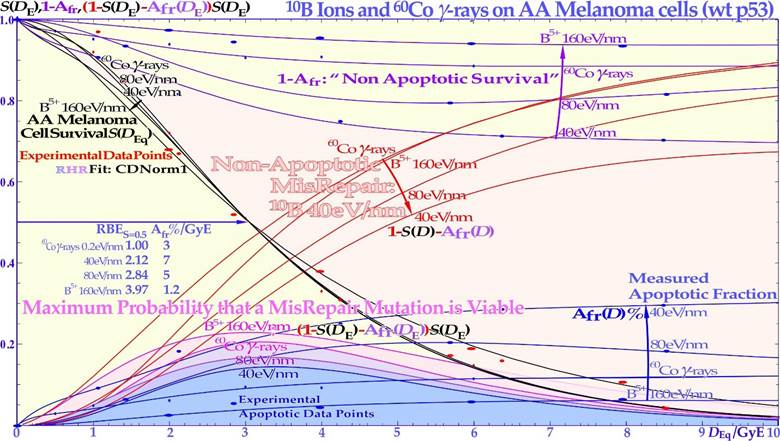
Figure 32: The lower shaded bel-shaped regions show the maximal secondary cancer induction probability as a function of the LET and dose equivalent per fraction delivered to tissue. At low doses, the risk of inducing a mutation is small, whereas at high doses, the probability of generating a mutation is higher, but so is the probability of also eliminating it via the treatment. The risk is highest around ≈3 GyE/Fr, so this volume in the patients´ normal tissues should truly be minimized. The LDA and LDHS of this TP53 intact cell line are clear from the curve shape for the two lowest LET beams (60Co and 40 eV/nm) as they are practically coinciding at low dose equivalents (black and violet curves). Interestingly, the risk is the smallest for the lowest-LET boron ions due to their high LDA and HDA. The upper shaded area is due to nonapoptotic misrepair for 40 eV/nm 10B ions as also shown by the red nonapoptotic misrepair curves. All data points are experimental and the RHR formula is used with the CDN1: one-dimensional closest distance norm, for the fit to data (not least square; for details: [1]).
In fact, if minimal risk for secondary cancer is also a goal of the treatment, multiportal molecular radiation therapy with lithium ions (cf Figure 4) with half a GyE plateau dose/portal would be ideal, as seen in Figure 32. With the lightest ions, this is generally a smaller problem, as fewer beam portals are needed, and it should thus be the treatment of choice for nonseniors that hopefully will recover from a well optimized local treatment with minimal risk of late morbidity!
Adjuvant Treatments
As seen in Figures 4 - 7 above, most tumors are linked to a low-dose radiation-resistant phenotype (LDRR) due to a mutant TP53 gene and thus a reduced probability of inducing LDA, HDA and LDHS.
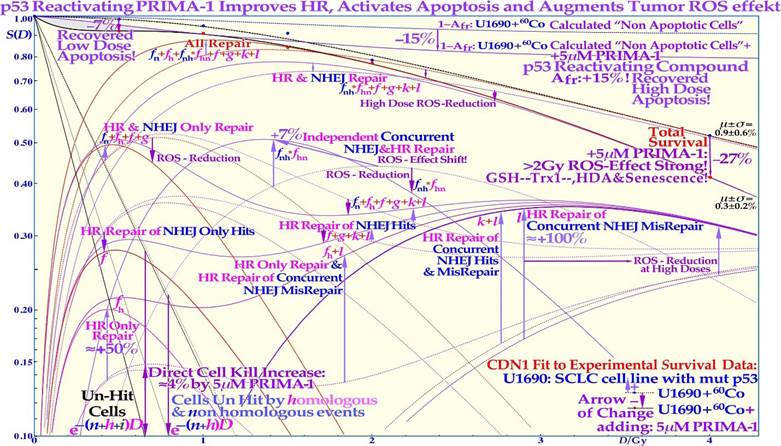
Figure 33: Experimental demonstration of the increased LDA and HDA by mutant TP53 reactivation by using the new RHR cell survival formulation. The change in U1690 SCLC cell survival (with a mutant TP53 gene), S(D), and major DNA repair processes induced with PRIMA-1 (solid lines) and without (dotted lines), irradiated using 60Co γ-rays. Arrows indicate the change after adding 5 &M PRIMA-1 for 14 h (10 h before to 4 h postirradiation). Even if the absolute apoptotic survival change is small, ≈ 7% at low doses (LDA) and up to 15% at high doses (HDA), there are larger estimated changes in the reparability of radiation damage with PRIMA-1 added, as seen in the HR-only repair (fh ≈+50 %) and the HR repair of NHEJ misrepair (l≈+100 %) and sum of all repair terms that even compensate somewhat for the increased apoptosis via reactivation of mutant p53. Interestingly, the low dose relative increase in apoptosis was more than 10 fold below 0.15 Gy (LDA, see the text and [1]). The shaded low-dose area between the calculated apoptotic cell survival and measured clonogenic survival is due to apoptotic loss before the full activation of p53 at serine 15 and 20 via the checkpoint kinases ATM and CHK2 (cf. Figure 4 and [1-3]). The high-dose loss in cell survival is most likely due to PRIMA- 1-induced augmented toxicity through the increasing associated ROS production (PRIMA-1 inhibits the enzyme thioredoxin reductase 1/Trx1 and thioredoxin and decreases cellular glutathione/GSH levels) and increasing HDA and senescence [36, 48, 60, 76-78]. The mean error! and standard deviation σ of the data points from the fit are also shown: all below ≈1%, but are obviously much higher in some of the individual subcomponents (≈10%). The volume of data that can be estimated using the new, more flexible, and probably more accurate cell survival and DNA repair formulation is striking. Updated from ([2]: Fig 6) with LDA and HDA and the effects of ROS. CDN1: one-dimensional closest distance norm (not least square, see [1]). The new RHR formulation significantly helped the interpretation of the wide range of effects of PRIMA-1 (f, g, k, l are repair fractions in which HR fixes various NHEJ misrepair and damage, as indirectly explained in this figure, fh plain HR, and fn plain NHEJ; see [1, 104, 105] for further details).
Interestingly, the cell survival effects of the mutant p53-reactivating active component MQ of the compounds PRIMA-1 and APR246 on the TP53 mutant SCLC cell line U1690 after exposure to 60Co γ-rays is shown in detail in Figure 33. The curves with PRIMA-1 are shown here as solid lines, and the plain SCLC cell line U1690 without PRIMA-1 is shown as doted lines, with arrows indicating the change in survival by the presence of PRIMA-1 during irradiation. At higher doses, the relative survival loss is quite large (almost 27% at 4 Gy, see Figure 33). From this point of view there would be a clinical advantage of using high doses per fraction with PRIMA-1. There is an increased HR repair alone (f by almost 50%) but also indications of an increased HR repair fixing NHEJ misrepair (l is more than doubled), indicating that the HR pathway is largely improved through p53 reactivation, partly increasing the very low- and highdose apoptosis [1, 2]. The recovery of the HR pathway with PRIMA- 1 related apoptosis is increased more than tenfold below 0.15 Gy, sixfold at ½ Gy (LDA), fourfold at 1 Gy, and more than doubled at high doses (HDA). Due to the wide therapeutic effect spectrum of the active component MQ of APR 246 and PRIMA-1 [1, 2, 4, 104-109], both on reactive oxygen species (ROS), inhibiting the enzyme thioredoxin reductase 1 and thioredoxin and decreasing cellular glutathione levels and increasing apoptosis. It is difficult to say exactly what caused the increase in HDA apoptosis by ≈15% in the current study. Even if PRIMA-1 increased the HR only, and its repair of NHEJ misrepair, this probably occurred due to improved HR initiation via TP53, but there are also indications that apoptosis could be caused by direct mitochondrial effects via caspase-3, and the cell cycle block via p21 is not generally restored either [104, 105]. This latter fact may even be a therapeutic advantage for cancer treatments as the tumor cells will continue cycling and incorporate damaged DNA in their genomes without repair, and they may finally end up in a mitotic catastrophe situation, as in classical radiation therapy. The first very interesting cell culture study using APR 246 on colorectal cancer combined with radiation was recently published, and mut TP53 cell line showed almost wt TP53 response with 5 &M APR 246, whereas TP53 Null cells were only half as responsive [109], generally consistent with Figure 33. At 7.5 μM, the mut cell line was even more responsive than the wt, which should be a valuable treatment property. In a tumor growth assay, 20 μM APR 246 and 6 Gy both halved the mut xenograft size, whereas the combination brought it down to ≈1/5, but wt cells showed only a 30% APR 246 reduction, and null and mut cells were similar [37]. Interestingly, Venn diagrams of significantly enriched pathways and genes for combined and radiation-alone treatments were also included for wt, mut, and TP53 null cells [110]. APR 246 and PRIMA-1 are therefore very interesting compounds to improve the treatment possibilities of the multitude of LDRR tumors (cf the U1690 SCLC cell survival in Figure 33) that have a mutant TP53 pathway (>50% of all tumors) and therefore otherwise may need ion therapy to counteract their LDRR phenotype property as the treatment response is then generally more independent of the p53 status. Interestingly, the recovered LDA, LDHS and loss of LDRR opens up the possibility for improved radiation therapy at low doses, and the regained HDA, senescence and ROS effects make high doses per fraction treatments even more beneficial, as seen in the figure, especially if the compound is injected directly into the tumor (cf [1]: Figure 17 for potential treatment effects)! A recent experimental study also showed synergistic effects of APR 246 with higher LET radiation (Radium-224 alpha particles) not surprisingly making it an interesting adjuvant also for modern light ion radiation therapy even if the ROS effect may be reduced somewhat compared to that of low LET radiation [111].
Optimal Dose Delivery Techniques
During the last 125 years of curative radiation therapy, the treatment and diagnostic equipment and associated irradiation techniques have changed considerably, as seen in Figure 34, summarizing some of the last 50 years of development. Intensity modulation started quite early with absorbers and wedge filters in the beams, but it was not until much more flexible techniques, such as computer-controlled high-resolution multileaf collimation and scanning beams really, took off, thanks to the new equipment and treatment planning systems capable of inverse physical dose- and even radiation biologically optimized treatments. This was all important to achieve significant improvements in complicationfree cure of ≈ 25% and more. Today, a large number of treatments are performed using intensity-modulated beams, making optimized beam portal selection quite different to maintain the highest possible flexibility in intensity modulation. Thus, parallel opposed beams are not ideal, as the modulation flexibility of the second beam is practically lost, as shown in Figures 34 and 35. The same is true twice for the classical four-field box technique, even though it gives an elevated uniform dose to the tumor with low-energy severely attenuated beams such as 60Co! Three fieldsymmetric or orthogonal beams are almost as good or even better, and the four-field tetrahedral configuration is truly the best, mainly as it separates the entrance and exit portals as far as possible from each other. However, we should avoid going to higher numbers as the overlapping beams and the almost complete irradiation of the whole patient cross-section to low doses will increase the secondary cancer induction probability (cf Figure 32), especially for patients with long life expectancy [2, 102, 103]!
Interestingly, the new understanding that most normal tissues with an intact TP53 gene are LDHS as discussed above (cf Figures 4-7, [2]). This means that the tumor dose per fraction should no longer be 2 Gy, since this is in the region where tumor and normal tissues are almost equally sensitive (cf Figure 6). It is then better to truly use the fractionation window advantage and use the induced radiation resistance induced by the first ½ Gy and continue to 1.8-2.3 Gy where after HDA sets in. This means that the tumor dose per fraction will be ≈2.3-3+ Gy, which is good, especially for the slowly responding tumors, as shown in Figure 6. Assuming that the tumor is mutant on TP53, as most tumors are, we can then use the classical LQ model (otherwise we need the 3rd or 4th formulation in Figure 7 such as for the melanoma in Figure 32).
To ensure that we do not overtreat the lung tumor in Figure 12 planned for the equivalent total dose in 2 Gy per fraction of ≈ 86 Gy, we obtain from the LQ model [112]:
 (2)
(2)
where d is the tumor dose per fraction, n is the number of fractions at a total tumor dose D= n * d and Dt
≈ 86 Gy is the total tumor dose at 2 Gy/Fr.
This is a quadratic equation in the tumor dose per fraction with the simple solution:
 (3)
(3)
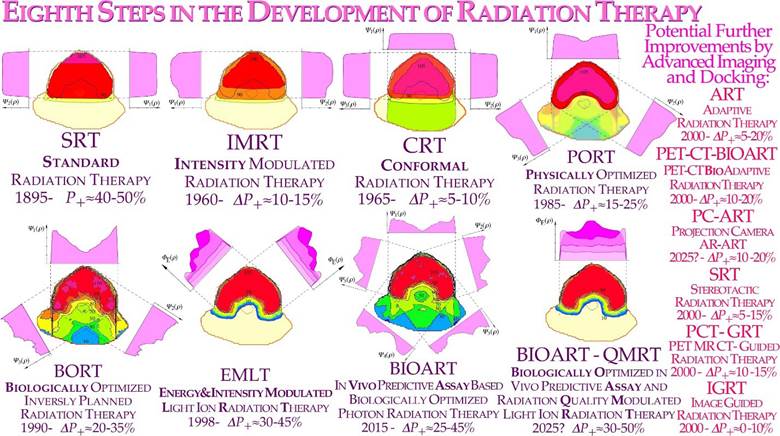
Figure 34: Eight steps in the development of external beam radiation therapy. The right column shows a number of new imaging techniques, some of which, such as PET-CT imaging, may significantly improve the outcome of radiation therapy, particularly when used in biologically optimized approaches. The approximate change in complication-free cure (DP+) in each step compared to the first panel of standard radiation therapy planning.
Let us apply it on the lower treatment plan of Figure 12 above, where Dt is ≈ 86 Gy and the risk organ dose is ≈ 60 Gy; with n=20 or 4 weeks of 5 fractions, and α/β ≈ 3 for lung cancer, the risk organ dose per fraction Dr=D60/86=2.35 Gy; Slightly high for the therapeutic fractionation window 1.8-2.3 Gy, so with 21 or 22 fractions, we obtain 2.28 or 2.21 Gy/Fr. The corresponding risk organ doses are 47.1, 47.9 and 48.6 Gy, which is a substantial reduction from 60 Gy in the conventional plan, and the tumor dose is reduced to ≈68 Gy. In fact, we should preferably select a fraction number to end the treatment after a last weekend (cf. Figure 20).
Thus, most people still using the old usual 2 Gy/Fr to the tumor with IMRT dose delivery hurts patients more than necessary by too high total doses! Interestingly, this is in line with recent discussions on “hypofractionation” in the head and neck region [113-115] but also for more general tumor locations [116-119]. In fact, the classical 2 Gy/Fr fractionation window was established in the era of parallel opposed beam therapy when the tumor and normal tissues had almost the same doses (cf Figures 34, 35), and it was largely the normal tissue reactions at 2 Gy/Fr that limited the dose delivery. Thus, the presently defined daily and weekly fractionation windows (cf Figures 7, 19, 20, [2]) are still the same, but in the era of IMRT, when we can substantially increase the dose delivery to the tumor, we should still keep the 2 Gy/Fr limit in the normal tissues at risk because this is where since some 70 years know, the optimal tolerance window is located.
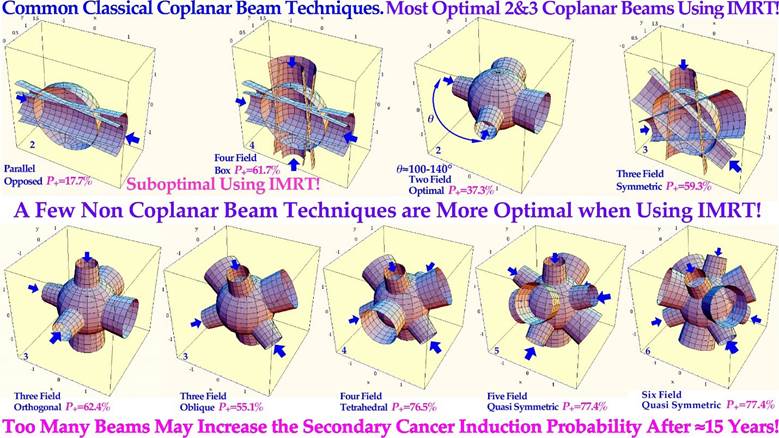
Figure 35: Comparison of classical coplanar and more general noncoplanar treatment techniques. The symmetric planar configurations allow, in most cases, a fairly uniform dose to the tumor but also to normal tissues. Noncoplanar techniques are more advantageous with regard to the dose to normal tissues, especially when combined with intensity modulated radiation treatments (IMRT). Thus, for the few field techniques (≤3) to be effective, it is essential to use nonuniform dose delivery. The optimal angle between two neighboring fields is often then optimal near 120° to maximize the effect on the tumor and minimize beam interactions in normal tissues with parallel opposed beams. The approximate resultant complication-free cure (P+) is indicated in each case for a uniform spherical target volume in a larger spherical patient.
It is thus a question of tumor dose escalation rather than hypofractionation, which happens to be one of its consequences, largely since the clinical meaning of the fractionation window may not have been fully understood [38, 49]. Additionally, today we also know why it is at 2 Gy: Most normal tissue are LDHS and LDA and after the low dose initiation (≈½ Gy) of full DNA repair we should use this acquired repair advantage to its full extent in normal tissues up to about two ≈2.3 Gy where the HDA sets in as described in Figures 4-7 [1, 2, 37]. It is a bit sad that the powerful tool of biologically optimized IMRT has been somewhat misused clinically for some 20 years and the classical 2 Gy/Fr has been over conservatively kept unchanged for the tumor as in the “good old days”! Some of the first discussions of the optimal dose per fraction in view of LDHS were at the end of last millennium, as seen in Figure 19 ([56]: Figure 4, [120]: Figure 4). Of course, we still have had some benefit of an improved dose delivery and saved patients. However, for the extra ≈12 Gy unnecessarily delivered to the patients, as seen above, may have induced some secondary cancers, the number of which can easily be estimated. For the future, it is important to know that the presently proposed 1.8-2.3 Gy fractionation window [1, 2, 34, 38, 56] is derived for Lung epithelial cells and other normal tissues may have somewhat different values but the underlying molecular mechanism should essentially be the same as given by the mechanisms in Figure 4! It is fascinating that first, after 125 years of curative radiation therapy, we start to understand how the molecular mechanism behind an intact TP53 gene makes 2 Gy/Fr so useful in the clinic, and when it is commonly mutated in the tumor, we may need biologically optimized IMRT, light ions and TP53 reactivation.
Thus, independent of which treatment technique in Figure 35 you might be using, the new radiation biology considerations of Figures 4 and 6 will substantially improve the complication-free cure in the clinic, and the beam configurations in Figure 35 are often most efficient [2]. This discussion was focused on traditional photon therapy where there is a substantial fractionation window, as described in Figures 4-7 and [2]. As discussed above, this window is also fully open with helium and lithium ions but then slowly closes toward carbon ions and neutrons, and there is still a weak but useful effect with boron ions, as seen in Figure 32. Furthermore, these lightest ions simultaneously have the advantage of a lower microdosimetric heterogeneity, making the dose response steeper, the complication-free cure higher and the switch to a low LET round up less important.
For larger bulkier hypoxic tumors, lithium may not be sufficiently effective, and boron might be more optimal with a small fractionation window, making the low LET round-up more important. In fact, even neon, oxygen and carbon ions and neutrons can have increased usefulness with extended (≈20 GyE) low LET round-ups, possibly with concomitant high LET boosts off the gross tumor for the largest hypoxic tumors. The continued development of complex hybrid equipment, for example, combining CT and MR with radiation therapy units, may be useful for a small subgroup of patients, but the compromises in performance quality and cost make them suboptimal in the long run. It is probably more therapeutically and cost efficient to improve the molecular tumor imaging capability, as discussed above, and use more efficient automatic docking systems (cf Figure 36a and [6]: Figure 8, [15]). This would allow almost perfect synchronization of all data sets whether using CT, MR or PET for dose delivery and biological responsiveness imaging (Figures 10, and 36 a, b). With advanced imaging equipment, it would generally be much less cost efficient if two or more very expensive units were totally integrated.
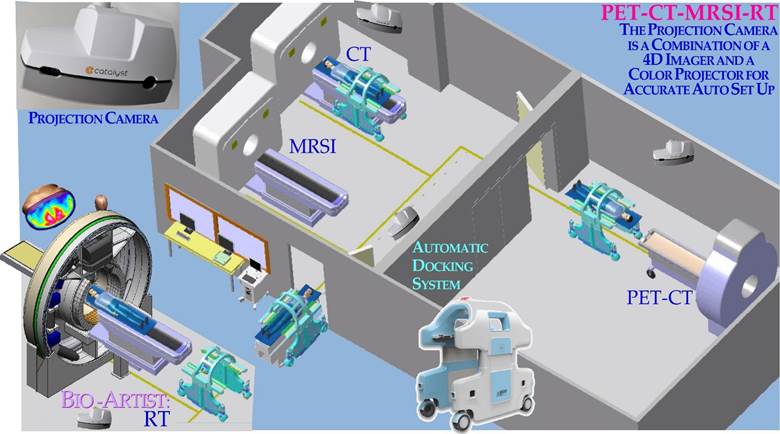
Figure 36a: To improve cost effectiveness it is better to combine multiple diagnostic and therapeutic units, all with accurate optical Auto Set Up units, than to build together suboptimal units so that they block each other’s imaging ability. With robotic Auto Set Up, all imaging and therapeutic units can be combined in any desired order with optimal performance of each unit, making no compromises using MR-CT-PET-RT or Ion Therapy, for example [6, 17].
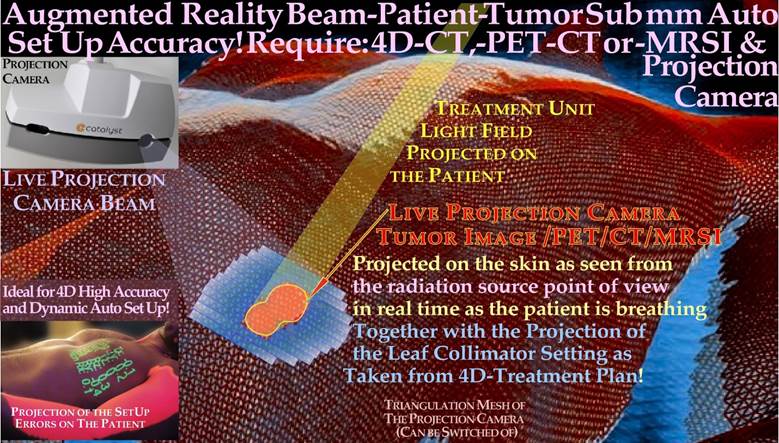
Figure 36b: With a robotic auto set-up, all imaging and therapeutic units can be combined in any desired order with optimal performance, and the projection camera can potentially be used as an augmented reality feature, as shown here. The back back-projection of the tumor and its internal target volume [83] on the patient skin surface (pale white) in real time on the breathing patient could be used to control that the tumor stays inside the conventional light filed projection (pale yellow) of the therapeutic beam aperture over several breathing cycles. Interestingly, both the PET-CT, MRSI or Treatment plan Internal Target Volume could be projected sequentially if all data sets where 4D and so could the multileaf collimator setting were checked against the light field of the treatment unit during the normal breathing motions of the patient!
Often, they may not work simultaneously, and one unit may be prohibited from use when the other is working. Furthermore, we may need more than two data sets for many situations. What one may save is the setup of the patient at two different units, but with, e.g., projection camera Auto Set Up (Figure 36a, [6]: Figure 8, [15]), this is a minor problem, and there are still motion artifacts between the two diagnostic modalities even if the initial positioning is correct. This also makes it possible to combine any diagnostic and therapeutic units with mm accuracy allowing all possible combinations, as shown in Figure 36a, and for the BIOART approach discussed in Figure 10. This makes sense not only for the largest equipment types such as Ion therapy [6] high Tesla MRSI units, Figure 3a and whole body PET-CT-PC (Figure 3b [6]).
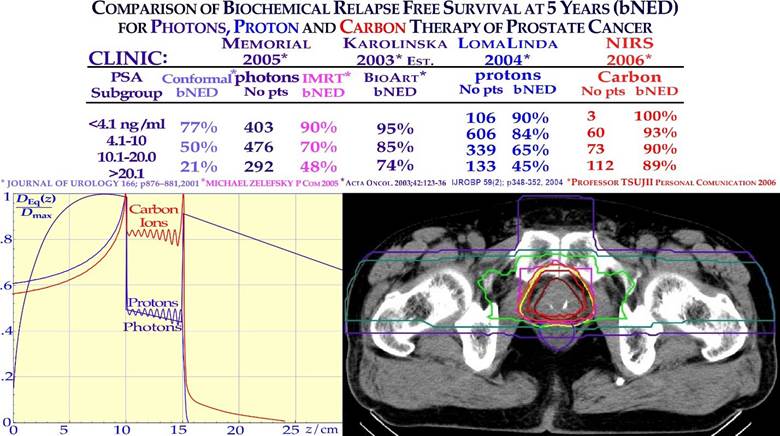
Figure 37: Improvement in biochemical relapse-free control of prostate cancer by switching from conformal and IMRT photon therapy to protons and carbon ions is shown. For the largest, more complex tumors (PSA >20), more than a doubling is seen with photon IMRT (and protons) and more than a fourfold increase with carbon ions compared to 3D conformal treatments used in the early 1990s (21−>89%). Interestingly, by using biologically optimized radiation therapy and the BIOART procedure, almost as good a result may be reached, especially if the hypoxia is gone or can be handled ([121] cf. Figures 10-12). An OER of ≈2 would reduce the effective dose for low LET in the tumor ≈50% for each beam, as seen in the lower left.
To give an example of the development in clinical performance, the improvement in biochemical relapse-free control of prostate cancer going from 3D conformal to IMRT, proton and carbon ions is shown in Figure 37.
It is quite impressive that we now reached ≈ 90% probability of no evidence of disease at 5 years after treatment with carbon ions, not surprisingly indicating a fair amount of hypoxia in these higher PSA tumors when compared with low LET treatments. Early IMRT also like protons more than doubled the cure of 3D conformal treatments as both suffer of a low LET whereas carbon ions is introducing a second doubling compared to protons! This is a tumor site where lithium molecular radiation therapy would do as well as carbon and with reduced adverse normal tissue reactions even if they are few today, as seen in Figure 38, where a larger data set of tumor cure and absence of normal tissue complications are given for 11 tumor sites. It is interesting to see in this two dimensional diagram how conformal photons and electrons form a light blue area, to low LET IMRT a beige shaded area next to the green upper right corner of high complication free cure with carbon ions.
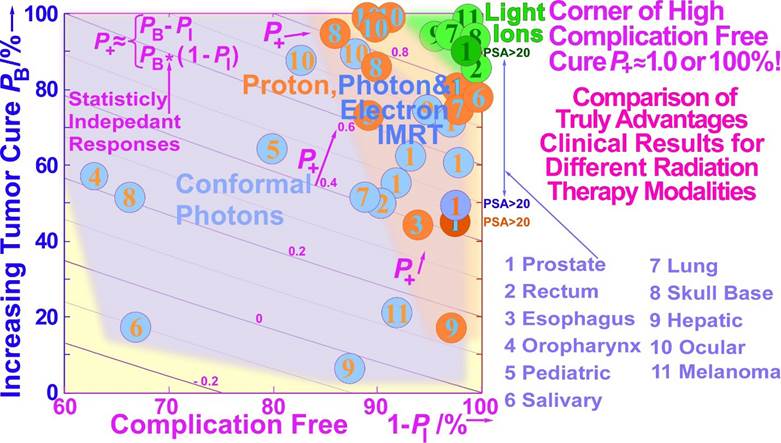
Figure 38: A more detailed view of how the complications are reduced and the recurrences are diminishing as we switch from conventional conformal photon therapy to IMRT photons and protons and carbon ions is shown. Interestingly, IMRT photons (blue) and protons (brown) again do almost equally well, with carbon ion therapy (green) stickling out as the almost perfect modality having only a few percent complications and recurrences in most cases. Clearly, even if the data are mainly nonrandomized, they give a similar indication of the merits of light ions as in Figure 37, where the low PSA data are also included in more detail. In theory, with statistically independent tumor and normal tissue responses, the complication-free cure is given by: P+ = PB (1 − PI). However, with commonly clinically correlated responses, one would expect P+ ≈ PB − PI as given by the iso-lines (cf. Eq (1), [59]). Both expressions are focused on the upper right green corner of the diagram maximizing the complication-free cure (modified from the Mayo Clinic).
Conclusions
The present paper discusses a large number of new ways to optimize radiation therapy. Perhaps most important is that we need to reconsider the classical 2 Gy/Fr mean tumor dose range for low-LET radiation based on recent clinical observations and the molecular indications that most normal tissues really are low-dose hypersensitive. To minimize damage to normal tissues at risk, a maximum dose of 2.3 Gy/Fr or less implies optimal tolerance of normal tissues and allows a significant tumor boost and approximately a 10 Gy total dose reduction [2]. Full NHEJ and HR repair activity is induced after 0.5 Gy, and thus with ≈ 1.5 Gy delivered with fully effective NHEJ and HR repair and almost full NHEJ recovery before the next day’s treatment fraction (cf inset in Figure 20). Furthermore, it means avoidance of the more severe high-dose apoptosis that sets in after 2- 3 GyE (Figure 4). To truly introduce a major paradigm shift in curative radiation therapy thinking, the time dose fractionation should be optimized for substantial weekend HR repair recovery (and simultaneously complete NHEJ recovery) in normal tissues by higher doses Friday evening and Monday morning and midday Wednesday. Interestingly, the valuable daily and weekly fractionation window at 1.8-2.3 Gy/Fr also works for our lightest ions ≈helium-boron largely with low LET in normal tissues and can deliver a further therapeutic boost to hypoxic tumors. Unfortunately, the fractionation window is practically closed from carbon and heavier ions since the increased biological effect in the tumor spills over to normal tissues, as almost proven with neon ions and neutrons, as seen in Figures 18 and 27. In addition, people are still working on introducing oxygen ions just because they are unhappy about the way carbon ions work, even if they have not understood their optimal usefulness is with a low LET treatment round up, because they are already on the too high LET side using carbon. The lightest ions are also the way to minimize the risk for secondary cancers and reduce ion attenuation and fragmentation and neutron tails, e.g., for pediatric patients, at the same time, their low microscopic heterogeneity is low with a steep dose response and higher complication-free cure and keeping the fractionation window fully open. The potential improvements in molecular tumor diagnostics may significantly improve the early accurate diagnostics of tumors as well as their effective elimination by the mildest and most curative treatment modalities using nature’s own preferred pathways for programmed cell death and senescence induction in the tumor (cf Figures 4 and 31). Taking the many approaches discussed above into account, the resultant increase in complication-free cure is likely to achieve improvements by as much as 30% and more for many tumor sites, e.g., using APR-246 for problematic TP53-mutant tumors (Figure 33). Almost half this improvement alone was estimated to result from the improved fractionation schedule, as shown in Figures 19 and 20. Thus, we urgently need to open the door for these new possibilities and switch from carbon to boron and from protons to lithium ions allowing apoptotic- senescent Bragg peak molecular radiation therapy (cf Figure 4)! Potential total dose reductions of 5-15 Gy are possible with the most recent advanced low LET- IMRT approaches using the daily and weekly optimal dose fractionation window (Figure 20). Analogously 5- 15 GyE ion therapy total dose equivalent tumor boosts are possible with a low-LET treatment round- up with carbon ions and higher LET ions (Figure 15) or even preferably simply using lithium - boron ions with mainly a low LET in normal tissues at risk (Figures 27, 28) keeping the effective normal tissue fractionation window open.
References
- Brahme A (2022) Quantifying Cellular Repair, Misrepair and Apoptosis Induced by Boron Ions, Gamma Rays and PRIMA-1 Using the RHR Formulation. Radiat Res 198: 271-296.
- Brahme A (2023) TP53 and the Ultimate Biological Optimization Steps of Curative Radiation Oncology. Cancers 15: 4286.
- Brahme A (2020) A DNA Repair-based model of cell survival with important clinical consequences. Radiat Res 194: 202-235.
- Brahme, A (2016) High resolution molecular radiation therapy and tumor imaging for the 21st century. J. Nucl. Med. Radiat. Ther 7: 1- 11.
- Brahme A, Löf J (2014) Fundamentals of Physically and Biologically Based Radiation Therapy Optimization In: Brahme A. ed. in chief Comprehensive BioMedical Physics Vol 9 Ch 12 p 271- 313, Major Reference Work, Elsevier Oxford.
- Brahme A (2014) editor Biologically optimized radiation therapy. World Scientific Publishing, Singapore p 1-667.
- Brahme A (2023) Physical, Biological and Clinical Merits of High Energy Boron Ions for Radiation Therapy. In Boron, Boron Compounds and Boron-Based Materials and Structures; Aydin, M., Ed.; IntechOpen: London, UK 1-23.
- Brahme A (1982) Physical and biologic aspects on the optimum choice of radiation modality. Acta Radiol. Oncol. 21: 469-479.
- Prost RW (2014) Magnetic Resonance Spectroscopic Imaging. In: Belkic D. and Brahme A. eds. Comprehensive Biomedical Physics. Elsevier, Amsterdam, Netherlands, Vol 3 p: 331-345.
- Boulant N, Quettier L (2023) Iseult Consortium. Commissioning of the Iseult CEA 11.7 T whole-body MRI: current status, gradient- magnet interaction tests and first imaging experience. Magnetic Resonance Materials in Physics, Biology and Medicine. 36: 175-189.
- Wu J. Wu K. Xu A. Shi Y. Wu Y. Wu J. Qin H. Liu J. Mechanical Structure Design of a 14T Body-Size MRI Magnet. IEEE International Conference on Applied Superconductivity and Electromagnetic Devices (ASEMD) 16-18 Oct 2020 Tianjin, China.
- Belkic D (2001) Fast Padè Transform (FPT) for magnetic resonance imaging and computerized tomography. Nuc Inst Meth Phys Res A. 471: 165-169.
- Budinger TF, Bird MD (2018) MRI and MRS of the human brain at magnetic fields of 14T to 20T: technical feasibility, safety, and neuroscience horizons. Neuroimage. 168: 509-531.
- Ugurbil K. (2018) Imaging at ultrahigh magnetic fields: history, challenges, and solutions. Neuroimage. 168: 7-32.
- Brahme A (2010) Design of an Open PET System with Therapeutic & Stereoscopic Phase-Contrast X-ray Capabilities. Proceedings of Japanese- European Joint Symposium on Ion Cancer Therapy and NIRS-KI Joint Symposium on Ion-Radiation Sciences, Stockholm.
- Yamaya T, Inaniwa T, Minohara S, Yoshida E, Inadama N, et al. (2011) Development of a small prototype for a proof-of-concept of OpenPET imaging. Phys Med Biol. 56: 1123-1137.
- Brahme A, Nyman P, Skatt B (2008) 4D laser camera for accurate patient positioning, collision avoidance, image fusion and adaptive approaches during diagnostic and therapeutic procedures. Med Phys 35: 1670-1681.
- Cherry SR, Jones T, Karp JS, Qi J, Moses WW, et al. (2017) TotalBody PET: Maximizing Sensitivity to Create New Opportunities for Clinical Research and Patient Care.J Nuc Med 59: 1-11.
- Buscemi G, Perego P, Carenini N, Nakanishi M, Chessa L, et al. (2004) Activation of ATM and Chk2 kinases in relation to the amount of DNA strand breaks. Oncogene 23: 7691-7700.
- Enns L, Bogen KT, Wizniak J, Murtha AD, Weinfeld M (2004) Lowdose radiation hypersensitivity is associated with p53-dependent apoptosis. Mol Cancer Res. 2: 557-566.
- Short SC, Bourne S, Martindale C, Woodcock M, Jackson SP (2005) DNA Damage Responses at Low Radiation Doses. Radiat. Res. 164: 292-302.
- Brahme A, Rydberg B, Blomqvist P (1997) Dual spatially correlated nucleosomal double strand breaks in cell inactivation. In Microdosimetry: An Interdisciplinary Approach; Goodhead, D.T., O’Neill, P., Menzel, H.G., Eds.; The Royal Society of Chemistry: Cambridge, UK 125-128.
- Brahme A, Lorat Y (2023) Dual Nucleosomal Double Strand Breaks are the Key Effectors of Curative Radiation Therapy. Biophysica. 3: 668-694.
- Zhao M, Wang Y, Zhao Y, He S, Zhao R, et al. (2020) Caspase-3 knockout attenuates radiation- induced tumor repopulation via impairing the ATM/p53/Cox-2/PGE2 pathway in non-small cell lung cancer. Aging. 12: 21758-21776.
- Myler L.R, Gallardo I.F, Soniat M.M, Deshpande R.A, Gonzalez X.B, et al. (2017) Single-Molecule Imaging Reveals How Mre11-Rad50-Nbs1 Initiates DNA Break Repair. Mol. Cell. 67: 891-898.
- Gerelchuluun A, Manabe E, Ishikawa T, Sun L, Itoh K, et al. (2015) The major DNA repair pathway after both proton and carbon ion radiation is NHEJ, but the HR pathway is more relevant in carbon ions. Radiat. Res. 183: 345-356.
- Takahashi A, Kubo M, Ma H, Nakagawa A, Yoshida Y, et al. (2014) Nonhomologous End-Joining Repair. Plays a More Important Role than Homologous Recombination Repair. in Defining Radiosensitivity after Exposure to High- LET Radiation. Radiat. Res. 182: 338-344.
- Scully R, Panday A, Elango R, Willis NA (2019) DNA double-strand break repair-pathway choice in somatic mammalian cells. Nat. Rev. Mol. Cell Biol. 20: 698-714.
- Buglewicz DJ, Buglewicz JKF, Hirakawa H, Kato TA, Liu C, et al. (2023) The impact of DNA double-strand break repair pathways throughout the carbon ion spread-out Bragg peak beam. Cancer Science. 114: 4548-4557.
- Wang YH, Ho TLF, Hariharan A, Goh HC, Wong YL, et al. (2022) Rapid recruitment of p53 to DNA damage sites directs DNA repair choice and integrity. Proc. Natl. Acad. Sci. USA 119: e2113233119.
- Nakamura Y (2004) Isolation of p53-target genes and their functional analysis. Cancer Sci. 95: 7-11.
- Williams AB, Schumacher B (2016) p53 in the DNA-damage-repair process. Cold Spring Harb. Perspect. Med. 6: a026070.
- Martin LM, Marples B, Lynch TH, Hollywood D, Marignol L (2014) Exposure to low dose ionising radiation: Molecular and clinical consequences. Ca Letters 349: 98-106.
- Singh B, Arrand JE, Joiner MC (1994) Hypersensitive response of normal human lung epithelial cells at low radiation doses. Int. J. Radiat. Biol 65: 457-464.
- Joiner MC, Johns H (1988) Renal damage in the mouse: The response to very small doses per fraction. Radiat. Res 114: 385-398.
- Turesson I, Nyman J, Qvarnström F, Simonsson M, Book M, et al. (2010) A low-dose hypersensitive keratinocyte loss in response to fractionated radiotherapy is associated with growth arrest and apoptosis. Radiot. Oncol. 94: 90-101.
- Maeda M, Tomita M, Maeda M, Mastumoto H, Usami N, et al. (2021) Exposure of the cytoplasm to low-dose X-rays modifies ataxia telangiectasia mutated-mediated DNA damage responses. Sci Rep. 11: 13113.
- Riballo E, Kuhne M, Rief N, Doherty A, Smith GCM, et al. (2004) A pathway of double-strand break rejoining dependent upon ATM, artemis, and proteins locating to γ-H2AX foci. Mol Cell. 16: 715-724.
- Brahme A (1999) Biologically based treatment planning. Acta Oncol. 38: 61-68.
- Xue L, Yu D, Furusawa Y, Cao J, Okayasu R, et al. (2009) ATMdependent hyper-radiosensitivity in mammalian cells irradiated by heavy ions. Int. J. Radiat. Oncol. Biol. Phys. 75: 235-243.
- Vreede P, Brahme A (2009) Development of biologically optimized radiation therapy: Maximizing the apoptotic cell kill. Radiol. Sci 52: 3152.
- Schmitt CA (2003) Senescence, apoptosis and therapy—Cutting the lifelines of cancer. Nat. Rev. Cancer 3: 286-295.
- d’Adda di Fagagna F (2008) Living on a break: Cellular senescence as a DNA-damage response. Nat. Rev. Cancer. 8: 512-522.
- Nardella C, Clohessy JG, Alimonti A, Pandolfi PP (2011) Prosenescence therapy for cancer treatment. Nat. Rev. Cancer: 11: 503511.
- Lind BK, Persson LM, Edgren MR, Hedlöf I, Brahme A (2003) Repairable-conditionally repairable damage model based on dual Poisson processes. Radiat. Res 160: 366-375.
- Kappos A, Pohlit W (1972) A Cybernetic Model for Radiation Reactions in Living Cells. 1 Sparsely- ionizing Radiations. Int J Rad Biol 22: 5165.
- Brahme A (2011) Accurate Description of the Cell Survival and Biological Effect at Low and High Doses and LETs. J. Rad. Res 52: 389-407.
- Blakely EA, Chang PY (2009) Biology of charged particles. Cancer J. 15: 271-284.
- Brahme A, Svensson H (2014) Physical, biological and clinical background for the development of biologically optimized light ion therapy. In Biologically optimized radiation therapy: Brahme A, ed.; World Scientific Publishing: Singapore. 8: 499- 648.
- Brahme A (2003) Biologically optimized 3-dimensional in vivo predictive assay based radiation therapy using positron emission tomographycomputerized tomography imaging. Acta Oncol. 42: 123-136.
- Brahme A (2014) BIOART: Biologically Optimized 3D In Vivo Predictive Assay Based Radiation Therapy. In: Brahme A, eds. Biologically optimized radiation therapy. World Scientific Publishing, Singapore 7: 359-498.
- Toma-Dasu I, Uhrdin J, Antonovic L, Dasu A, Nuyts S, et al. (2012) Dose prescription and treatment planning based on FMISO-PET hypoxia. Acta Oncol 51: 222-230.
- Strååt SJ, Andreassen B, Jonsson C, Noz ME, Maguire GQ Jr, et al. (2013) Clinical application of in vivo treatment delivery verification based on PET/CT imaging of positron activity induced at high energy photon therapy Phys. Med. Biol 58: 5541.
- Brahme A, Ågren AK (1987) On the optimal dose distribution for eradication of heterogeneous tumors. Acta Oncol. 26: 377-385.
- Brahme A (2009) Potential developments of light ion therapy: the ultimate conformal treatment modality. First NIRS International Open Laboratory Workshop, November 17, 2008, Chiba, Japan, Tsujii H (ed.), Radiol Sci 52:8- 31.
- Brahme A (2001) Individualizing cancer treatment: biological optimization models in treatment planning and delivery. Int J Radiat Oncol Biol Phys. 49: 327- 337.
- Källman P, Ågren A, Brahme A (1992) Tumor and normal tissue responses to fractionated non uniform dose delivery. Int. J. Rad. Biol. 62: 249-262.
- Lind K, Nilsson J, Löf J, Brahme A (2001) Generalization of the normalized dose-response gradient to non-uniform dose delivery. Acta Oncol 40: 718-724.
- Ågren A, Brahme A, Turesson I (1990) Optimization of uncomplicated control for head and neck tumors. Int J Radiat Oncol Biol Phys. 19: 1077- 1085.
- Löf J, Liander A, Kåver G, Lind BK, Brahme A (1998) ORBIT — a general object oriented code for radiotherapy optimization. Radiother Oncol 48: S69.
- Brahme A (2002) Development of radiobiologically based therapy optimization and target definition. Proc Second Int Symp on Target Volume Definition in Radiation Oncology. Kiricuta IC (ed.), Inst Radiat Oncol, St Vincenz-Hospital, Limburg, Germany.
- Lindborg L, Brahme A (1990) Influence of microdosimetric quantities on observed dose-response relationships in radiation therapy. Radiat Res. 124: S23- 8.
- Tilikidis A, Skog S, Brahme A (1994) Influence of radiation quality changes on microdosimetric variance and dose response relation. Rad Prot Dosim 52: 43- 49.
- Brahme A. (1984) Dosimetric precision requirements in radiation therapy. Acta Radiol Oncol 23: 379-391.
- Tilikidis A, Brahme A. (1994) Microdosimetric description of beam quality and biological effectiveness in radiation therapy. Acta Oncol 33: 457-469.
- Brahme, A. (2014) Biologically Optimized Light Ion Therapy. Brahme A. Ed. in Chief: Comprehensive BioMedical Physics; Major Reference Work; Elsevier: Oxford, UK, pp: 529-554.
- Cohen L. (1982) Absence of a demonstrable gain factor for neutron beam therapy of epidermoid carcinoma of the head and neck. Int J Radiat Oncol Biol Phys 8: 2173-2176.
- Cohen L. (1982) The Tissue Volume Factor In Radiation Oncology. Int. J. Radiat. Oncol. Biol. Phys 8:1771-1774
- Ågren-Cronqvist A, Källman P, Turesson I, Brahme A. (1995) Volume and heterogeneity dependence of the dose-response relationship for head and neck tumours. Acta Oncol 34: 851-860.
- Lindborg L, Brahme A. (1990) Influence of microdosimetric quantities on observed dose-response relationships in radiation therapy. Rad. Res. 124: S23-S28.
- Brahme, A. (1999) Optimized radiation therapy based on radiobiological objectives. Sem. Radiat. Oncol. 9: 35- 47.
- Siddiqi M, Lind BK, Brahme A. (2004) Optimal dose fractionation of lung cancer using biologically optimized IMRT. 525 Poster. Radiother Oncol 73: S235.
- Austin-Seymour M, Caplan R, Russell K, Laramore GE, Jacky J, et al. (1994) Impact of a multileaf collimator on treatment morbidity in localized carcinoma of the prostate Int. J. Radiat. Oncol. Biol. Phys. 30: 1065-1071.
- Eichorhn HJ, Lessel A. (1977) Four years experience with combined neutron-telecobalt therapy. Int. J. Radiat. Oncol. Biol. Phys. 3: 277280.
- Peters LJ, Hussey DH, Fletcher GH, Baumann PA, Olson MH (1979) Preliminary report of the M.D Anderson-Texas A.&M. variable energy cyclotron fast neutron therapy pilot study. Amer. J. Roentgenol. 132: 637-642.
- Griffit N, Blasko J, Laramor GE (1979) Results of fast neutron beam radiotherapy pilot studies at the University of Washington. In High-LET Radiations in Clinical Radiotherapy; Barendsen, G.W., Broerse, J.J., Breuer, K., Eds.; Pergamon Press: Oxford, UK 23-29.
- Tsunemoto H, Umegaki Y, Kutsutani Y, Arai T, Morita S, Kurisu A, Kawashima K, Maruyama, T. Results of clinical applications of fast neutrons in Japan. In High-LET Radiations in Clinical Radiotherapy; Barendsen, G.W., Broerse, J.J., Breuer, K., Eds.; Pergamon Press: Oxford, UK pp: 75-78.
- Maor MH, Hussey DH, Fletcher GH, Jesse RH (1981) Fast neutron therapy for locally advanced head and neck tumors. Int. J. Radiat. Oncol. Biol. Phys 7: 155-163.
- Laramore GE. (2009) Role of particle radiotherapy in the management of head and neck cancer. Current Opinion in Oncology 21: 224-231.
- Griffin TW, Pajak TF, Laramore GE, Duncan W, Richter MP, et al. (1988) Neutron vs. photon irradiation of inoperable salivary gland tumors: results of an RTOG- MRC cooperative randomized study Int. J. Radiat. Oncol. Biol. Phys. 15: 1085-1090.
- Russell K J, Caplan R J, Laramore G E, Burnison C M, Maor M H, et al. (1994) Photon versus fast neutron external beam radiotherapy in the treatment of locally advanced prostate cancer: results of a randomized prospective trial Int. J. Radiat. Oncol. Biol. Phys. 28: 47-54.
- Moffitt GB, Sandison GA, Argento DC, Emery R, Wootton LS, et al. (2023) Effects of tissue heterogeneity and comparisons of collapsed cone and Monte Carlo fast neutron patient dosimetry using the University of Washington clinical neutron therapy system (CNTS). Phys. Med. Biol. 68: 245011.
- Aaltonen P, Brahme A, Lax I, Levernes S, Näslund I, et al. (1997) Specification of dose delivery in radiation therapy. Recommendations by the NACP. Acta Oncol 36: 1-32.
- Bert C, Graeff C, Riboldi M, Nill S. Baroni G, et al. (2014) Advances in 4D Treatment Planning for Scanned Particle Beam Therapy. Tech Ca Res Treat 13: 485-495.
- Nilsson J, Lind BK, Brahme A (2002) Radiation response of hypoxic and generally heterogeneous tissues. Int J Radiat Biol 78: 389-405.
- Lind BK, Brahme A (2007) The radiation response of heterogeneous tumors. Phys Med 23: 91-99.
- Lazzeroni M. (2013) Production of High Quality 11C Beams for Radiation Treatment and Accurate PET- CT Dose Delivery Verification. Thesis Dept. Oncology-Pathology Karolinska Institutet, Stockholm.
- Lazzeroni M, Brahme A (2011) Production of clinically useful positron emitter beams during carbon ion deceleration. Phys Med Biol 56: 1585-1600.
- Lazzeroni M, Brahme A (2015) Production of pure quasimonochromatic 11C beams for accurate radiation therapy and dose delivery verification Nucl Inst Meth Phys Res 359: 120-130.
- Lazzeroni M, Brahme A (2014) Effective source size, radial, angular and energy spread of therapeutic 11C positron emitter beams produced by 12C fragmentation. Nucl Inst Meth Phys Res 320: 26-36.
- Penescu L, Stora T, Stegemann S, Pitters J, Fiorina E, et al. (2022) Technical Design Report for a Carbon-11 Treatment Facility. Front. Med 8: 697235.
- Boscolo D, Kostyleva D, Safari MJ, Anagnostatou V, Äystö J, et al. (2021) Radioactive Beams for Image-Guided Particle Therapy: The BARB Experiment at GSI. Front. Oncol 11: 737050.
- Rubbia C, Ferrari A, Kadi Y, Vlachoudis V. (2006) Beam cooling with ionization losses, Nucl Instr Meth Phys Res A 568: 475-487.
- Brahme A, Källman P, Lind BK (1989) Optimization of proton and heavy ion therapy using an adaptive inversion algorithm. Radiother Oncol 15: 189-197.
- Brahme A (2010) Optimal use of light ions for radiation therapy. Radiol Sci 53: 35- 61.
- Ureba A, Ödén J, Toma-Dasu I, Lazzeroni M (2022) Photon and Proton Dose Painting Based on Oxygen Distribution - Feasibility Study and Tumour Control Probability Assessment. In: Scholkmann, F., LaManna, J., Wolf, U. (eds) Oxygen Transport to Tissue XLIII. Advances in Experimental Medicine and Biology 1395: 223-228.
- Imai R, Kamada T, Araki N. (2016) Carbon ion radiation therapy for unresectable sacral chordoma: An analysis of 188 cases. Int J Radiat Oncol Biol Phys 95: 322-327.
- Serizawa I, Imai R, Kamada T, Tsuji H, Kishimoto R, et al. (2009) Changes in Tumor Volume of Sacral Chordoma After Carbon Ion Radiotherapy. Journal of Computer Assisted Tomography 33: 795-798.
- Dong M, Liu R, Zhang Q, Wang, Luo H, et al. (2023) Efficacy and safety of carbon ion radiotherapy for chordomas: a systematic review and meta-analysis Radiation Oncology 18: 152.
- Wu PC, Wang Q, Grobman L, Chu E, Wu DY (2012) Accelerated cellular senescence in solid tumor therapy. Exp Oncol 34: 298-305.
- Gorgoulis V, Adams PD, Alimonti A, Bennett DC, Bishop O, et al. (2019) Cellular Senescence: Defining a Path Forward. Cell 179: 813827.
- Brahme, A. (1993) Optimization of radiation therapy and the development of multileaf collimation. Editorial. Int. J. Rad. Oncol. Biol. Phys 25: 373-375.
- Hall, E.J.; Wuu, C.S. (2003) Radiation-Induced Second Cancers: The Impact of 3D-CRT and IMRT. Int. J. Radiat. Oncol. Biol. Phys 56: 8388.
- Bykov VJN, Eriksson SE, Bianchi J, Wiman KG. (2018) Targeting mutant p53 for efficient cancer therapy. Nat Rev Cancer 18: 89-102.
- Perdrix A, Najem A, Saussez S, Awada AJourne F, Ghanem G, et al. (2017) PRIMA-1 and PRIMA-1MET (APR-246): From Mutant/Wild Type p53 Reactivation to Unexpected Mechanisms Underlying Their Potent Anti-Tumor Effect in Combinatorial Therapies. Cancers 9: 172.
- Furukawa H, Makino T, Yamasaki M, Tanaka K, Miyazaki Y, et al. (2018) PRIMA-1 induces p53-mediated apoptosis by upregulating Noxa in esophageal squamous cell carcinoma with TP53 missense mutation. Cancer Sci 109: 412-421.
- Peng X, Zhang MQ, Conserva F, Hosny G, Selivanova G, et al. (2013) APR-246/PRIMA-1MET inhibits thioredoxin reductase 1 and converts the enzyme to a dedicated NADPH oxidase. Cell Death Dis 4: e881.
- Haffo L, Lu J, Bykov VJN, Martin SS, Ren X, et al. (2018) Inhibition of the glutaredoxin and thioredoxin systems and ribonucleotide reductase by mutant p53-targeting compound APR-246. Sci Rep 8: 12671.
- Tessoulin B, Descamps G, Morea P, Maı ̈ga S, Lod ́e L, et al. (2014) PRIMA-1 Met induces myeloma cell death independent of p53 by impairing the GSH/ROS balance. Blood 124: 1626-1636.
- Xie X, Fan C, Luo B, Zhang J, Jensen LD, et al. (2023) APR-246 Enhances Colorectal Cancer Sensitivity to Radiotherapy.
- Cooks T, Michaeli O, Luz I, Vatarescu M, Weizmann N, (2023) Reactivation of p53 as a radiosensitization strategy for mutant p53 cancers treated with high-LET radiotherapy.
- Joiner MC. Bentzen SM (2009) Fractionation: the linear-quadratic approach. In Joiner M. van der Kogel Ed. Basic Clinical Radiobiology. Hodder Arnold, London 8: 102-119.
- Shuryak I, Hall EJ, Brenner DJ (2019) Optimized Hypofractionation Can Markedly Improve Tumor Control and Decrease Late Effects for Head and Neck Cancer. Int J Radiat Oncol Biol Phys 104: 272-278.
- Piras A, Boldrini L, Menna S, Venuti V, Pernice G, et al. (2021) Hypofractionated Radiotherapy in Head and Neck Cancer Elderly Patients: A Feasibility and Safety Systematic Review for the Clinician. Front. Oncol 11: 761393.
- Elbers, JBW, Gunsch, PA, Debets R, Keereweer S, Van Meerten E, et al. (2023) HYpofractionated, dose-redistributed RAdiotherapy with protons and photons to combat radiation-induced immunosuppression in head and neck squamous cell carcinoma: study protocol of the phase I HYDRA trial. BMC Cancer 23: 541.
- Grimm J, Marks LB, Jackson A. Kavanagh BD. Xue J. et al (2021) High Dose per Fraction, Hypofractionated Treatment Effects in the Clinic (HyTEC): An Overview Int J Radiat Oncol Biol Phys 110: 1-10.
- Brand DH, Kirby AM, Yarnold JR, Somaiah N (2022) How Low. Can. You Go? The Radiobiology of Hypofractionation. Clin. Oncol 34: 280287.
- Corkum MT, Achard V, Morton G, Zilli T (2022) Ultrahypofractionated Radiotherapy for Localized Prostate Cancer: How Far Can We Go? Clin Oncol 34: 340-349.
- Brada M, Forbes H, Ashley S, Fenwick J (2022) Improving Outcomes in NSCLC: Optimum Dose Fractionation in Radical Radiotherapy Matters. J Thorac Oncol 17: 532-543.
- Brahme A (2000) Development of radiation therapy optimization. Acta Oncol 39: 579-595.
- Horsman MR, Sørensen BS, Busk M, Siemann DW (2021) Therapeutic Modification of Hypoxia Clin Oncol 33: 492-509.
© by the Authors & Gavin Publishers. This is an Open Access Journal Article Published Under Attribution-Share Alike CC BY-SA: Creative Commons Attribution-Share Alike 4.0 International License. Read More About Open Access Policy.