Multiphoton Imaging of Blood Vessels and Mesenchymal Progenitor Cells in Callus of Mice with Tibial Fracture Longitudinally
Hengwei Zhang1,2*, Longze Zhang2, Richard Bell2, Edward Schwarz2, Lianping Xing1,2*
1Department of Pathology and Laboratory Medicine, 601 Elmwood Ave, Box 626, Rochester, NY 14642, USA
2Center for Musculoskeletal Research, University of Rochester Medical Center, Rochester, NY 14642, USA
*Corresponding author: Lianping Xing, Department of Pathology and Laboratory Medicine, 601 Elmwood Ave, Box 626, Rochester, NY 14642, USA; Henngwei Zhang, Department of Pathology and Laboratory Medicine, 601 Elmwood Ave, Box 626, Rochester, NY 14642, USA
Received Date: 21 August, 2022
Accepted Date: 27 August, 2022
Published Date: 01 September, 2022
Citation: Zhang H, Zhang L, Bell R, Schwarz E, Xing L (2022) Multiphoton Imaging of Blood Vessels and Mesenchymal Progenitor Cells in Callus of Mice with Tibial Fracture Longitudinally. J Orthop Res Ther 7: 1247 DOI: https://doi.org/10.29011/2575-8241.001247
Abstract
Fracture repair requires angiogenesis and osteogenesis. However, the imaging method of dynamic and longitudinal observation of angiogenesis and osteogenesis in long bone fracture of living animals is lacking. Here we developed a Multiphoton Laser Scanning Microscopy (MPLSM) protocol for detecting the fluorescence labeled mesenchymal progenitor cells and blood vessels in tibial fracture callus in Nestin-GFP mice. We validated our MPLSM results using conventional histological method. MPLSM results showed the same changes in Nestin-GFP+ cells and blood vessels (volume, length and diameter), with those from fluorescent microscope observation of Nestin-GFP+ cells and immunostaining of blood vessel endothelial cells. Correlation analysis demonstrated a strong association between MPLSM results and histologic findings. Meanwhile, compared to the current application of MPLSM in cranial bone defect, our protocol suggests it could be used in the more clinic relevant study under more complex environment.
Keywords: Blood vessel; Fracture; Multiphoton laser scanning microscopy (MPLSM); Mesenchymal progenitor cell
Introduction
Bone fracture repair is composed of a series of events, including angiogenesis and osteogenesis. Although their essential role in bone fracture repair has been established [1], the method of real-time and high-resolution analyses of osteogenesis and angiogenesis in living animals is still lacking. Establishing a method to analyze the dynamic process of spatial and temporal changes of mesenchymal progenitor cells and neovasculature longitudinally is important to understand of bone fracture repair and further optimizing the treatment in clinic. Multiphoton Laser Scanning Microscopy (MPLSM) is an arrogant intravital imaging method for analyses of cell behavior and neovasculature in living animals [2,3]. The major advantage of MPLSM is the ability to simultaneously visualize of a particular cell type of interest using genetic engineering or specific antibody conjugated with a fluorophore and vascular networks, enabling real-time tracking of cell migration and morphological changes in vivo [4-6]. In recent years, MPLSM has been used to assess osteogenesis and angiogenesis in cranial bone defects [7-9]. Since most bone fractures in human occur in weight bearing bones whose repair process differs significantly from cranial bone, such as callus formation, it is important and necessary to develop a MPLSM protocol to analyze the dynamic changes of cells and blood vessels in callus tissues during leg bone fracture repair. In this study, we developed a new MPLSM protocol for observing the fluorescence labeled mesenchymal progenitor cells and blood vessels in the tibial fracture callus.
Materials and Methods
Animals
Three-month-old Nestin-GFP mice and the open tibial fracture procedure were used. Nestin-GFP mice were kindly provided by Dr. Grigori N. Enikolopov at Cold Spring Harbor Laboratories (Cold Spring Harbor, NY, USA) [10]. Nestin-GFP mice have been used in MPLSM study to visualize Nestin-GFP+ mesenchymal lineage precursors in a cranial bone defect model in the Center for Musculoskeletal Research (CMSR) at the University of Rochester Medical Center [7]. Open tibial fracture procedure was a Standard Operation Procedure (SOP) used in the CMSR [11-13]. Briefly, a 6 mm long incision is made in the skin over the anterior tibia after anesthesia. A sterile 27G needle is inserted via the proximal tibial articular surface into the bone marrow cavity, temporarily withdrawn to facilitate midshaft transection of the tibia using a scalpel, and reinserted to stabilize the fracture, which will be confirmed by X-ray. The incision will be closed with sutures. Mice will receive Buprenorphine SR, 0.5 mg/kg, SQ to control pain. We performed surgery on both tibiae to reduce mouse numbers. Animal study was approved by the Institutional Animal Care and Use Committee at the University of Rochester Medical Center.
Experimental Design
Two sets of experiments were performed. The first set of experimentns aimed to establish a MPLSM SOP and validate the MPLSM result by Immunofluorescence (IF) staining of the same callus sample. Fractured mice were divided into 3 groups (n=4 mice-8 tibiae/group). Mice were subjected to MPLSM at day 5 (group 1), 14 (group 2), or 21 (group 3) post-fracture. Mice were sacrificed immediately following MPLSM. Tibiae were cut via the frozen sectioning. Sections were subjected to IF staining for blood vessels and Nestin-GFP+ cells. Correlation between MPLSM and IF staining data at the same callus area was analyzed. The second set of experiments aimed to demonstrate the feasibility of longitudinal assessments of the same callus at different times in vivo. Fractured mice (n=2 mice/4 tibiae) were subjected to MPLSM at day 5, 14 and 21 post-fracture to assess changes of Nestin-GFP+ cells and blood vessels.
MPLSM
An Olympus FV1000-AOM multiphoton imaging system (Olympus), equipped with a Titanium:Sapphire laser (Spectra-Physics) and a C-Apochromat 10X/0.45 (Zeiss) water-immersion objective, was used. To visualize the blood vessels, Texas red-conjugated dextran (D-1864, Invitrogen, Grand Island, NY, USA) was injected intravenously via retro-orbital vein immediately before MPLSM. The fluorescence of GFP (Nestin-GFP+ cells) and Texas red was collected with a 480/30 nm and a 585/40 nm filter (Semrock, Rochester, NY), respectively with the laser tuned to 780 nm. Using the 10x water immersion objective lens (Zeiss), a multichannel Z-series stack (200 images) with 1 mm thick was obtained. The Z-series stack allowed 3D reconstruction of the bone callus up to a depth of 200 mm. The 2D stacking images and 3D reconstruction were conducted using Amira software developed by Visualization Sciences Group (VSG, Burlington MA, USA). Nestin-GFP+ cells (#/mm3), blood vessel volume (mm3), blood vessel length (mm) and average blood vessel diameter (mm) were calculated from segmented 3D images by Amira.
Immunofluorescence (IF) Staining
Tibiae were fixed in 10% neutral buffered formalin, decalcified in 14% ethylenediaminetetraacetic acid at room temperature for 10 days, and embedded in the OCT (full name). Blocks were cut into 50 mm thick sections using a Leica CM1850 cryostat (Leica, Wetzlar, Germany). Sections were IF stained with anti-Endomucin antibody (1:100, sc-53940, Santa Cruz) followed by a goat anti-mouse Alexa Fluor 568 (1:400, Invitrogen, A11077) for blood vessel endothelial cells. After imaging, sections were stained with Alcian Blue/Hematoxylin (ABH) and counterstained with Eosin/Orange G. Stained sections were scanned with an Olympus VS-120 whole-slide imaging system to generate digital images. Digital images were numbered and parameters for Nestin+ cells and blood vessels were calculated double-blinded using Image J software, including the number of Nestin+ cells, area, length and diameter of blood vessels.
Statistical Analysis
All results are given as mean ± SD. Statistical analysis was performed using GraphPad Prism 5 software (GraphPad Software Inc., San Diego, CA, USA). One way ANOVA followed by Dunnett’s post-hoc multiple comparison test were used for comparisons among 3 groups. p values <0.05 were considered statistically significant. Correction between of MPLSM and IF data was tested by a linear regression analysis.
Results and Discussion
Development of MPLSM protocol to examine angiogenesis and osteogenesis in mouse legs is challenging due to the tissue depth and irregularity. Recently, 3 labs in the CMSR used MPLSM in a cranial bone defect model to study blood vessels and distribution of Nestin-GFP+ cells, mast cells, or HSCs [7,8,14]. Based on this MPLSM-cranial bone SOP, we established a MPLSM SOP to longitudinally assess blood vessels and mesenchymal progenitor cells in callus of Nestin-GFP mice with tibial fracture. We used Texas red-Dextran (i.v.) to label blood vessels and GFP+ cells (Nestin-GFP+ cells) to label mesenchymal progenitor cells. To ensure that we apply MPLSM on the same region of a callus, mice were anesthetized under isofluorane, stabilized on a customized platform, and connective tissues were removed from the bone surface using a small blade to expose the front of tibiae containing callus. We divided the half callus into 5 regions by a permanent pen (Figure 1A). A thin layer of transparent gel (Ultrasound transmission Gel, 68200-710, VWR International, Aurora, CO, USA) was applied on the exposed callus, on top of which a water immersion objective was placed (Figure 1B). With this set-up, we were able to observe blood vessels and Nestin-GFP cells into 200 mm deep from the surface of callus, resulting in a 2D stack containing 200 images of 1 mm each, from which 3D image was reconstructed (Figure 1C). In the preliminary study, we observed all 5 regions and found that middle upper area has maximal and consistent number of blood vessels and GFP+ cells from different animals. Thus, we decided to image the middle upper area in our MPLSIM SOP, which is indicated by the red star in Figure 1A-C. For quality controls, we repeated the data analysis by the same person 2 weeks later or by a different person. A significant correlation was obtained in both cases, indicating small inter- (R=0.984) and intra-operator (R=0.915) variability.
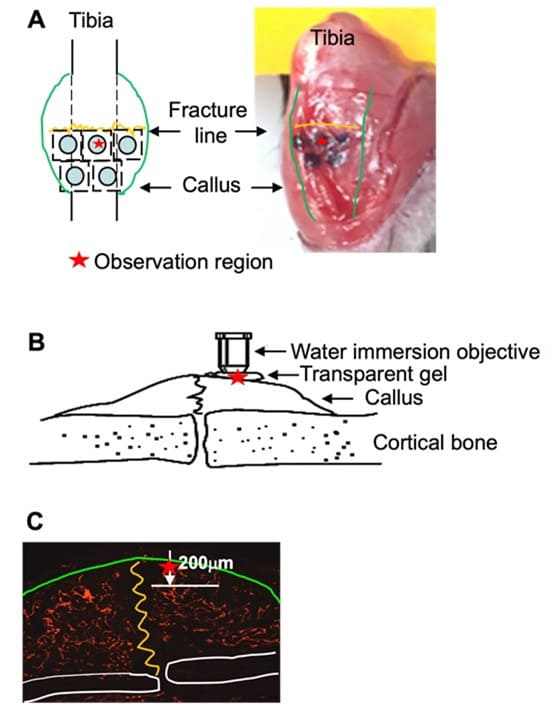
Figure 1: Illustration of MPLSM on a fracture callus in the mouse tibia (A) The superficial surface of a fracture callus was exposed surgically and whole tibia was stabilized on a customized platform. Callus was divided into 5 regions by a black ink. The MPLSM was applied on the upper-middle region indicated by the red star. (B) Transparent gel was applied on the exposed callus as in (A), on top of which a water immersion objective was placed. (C) The deep of MPLSM from the surface of callus is 200 mm. A stack of 200 (1 mm each) 2D images was collected, from which a 3D image was reconstructed for morphological analyses.
After establishing the MPLSIM SOP, we first performed a cross section study to assess changes of blood vessels and Nestin-GFP cells in callus at different time points post-fracture and validate MPLSM findings with IF staining. Three groups of fractured Nestin-GFP mice (n=4 mice-8 tibiae/group) were subjected to MPLSIM at day 5 (group 1), 14 (group 2), or 21 (group 3) post-fracture, and sacrificed thereafter. Tibiae were used for IF staining. The rationale to select these time points is that they represent early (day 5), middle (day 14) and late (day 21) phase of fracture repair in this mouse model [15]. MPLSM images and analysis (Figure 2A&B) revealed fewer Nestin-GFP+ cells at day 5, 4.2% of which localized adjacent to blood vessels. The number of Nestin-GFP+ cells was markedly increased at day 14 and more 35.5% of them localized adjacent to blood vessels (data not show), whose distance was less than two cell diameters to blood vessle. At day 21, the number of Nestin-GFP+ cells returned to that in day 5, and 76.1% of them overlapped with blood vessels (d5: 105±23; d14: 1141±289; d21:122±33 #/mm3). Blood vessel volume slightly increased (about 1-fold) from day 5 to day 14, but it markedly increased (about 10-fold) from day 14 to day 21 (d5: 8.2±1.3; d12: 26±4.3; d21: 76±20 mm3). Similarly, average vessel diameters also had a tendency to increase at day 14, and significantly increased at day 21 (d5:11.5±3.1; d12: 16.8±2.4; d21: 38.9±7.3 mm). Unlikely vessel numbers and diameters, vessel length was markedly increased (about 7-fold) at day 14, and stayed increase at day 21 (d5:0.26±0.06; d12: 1.8±0.4; d21: 1.5±0.35 mm). To validate our MPLSM findings, we performed IF staining on thick tibial sections with a-Endomucin Ab for blood vessel endothelial cells and observed under a fluorescent microscope for blood vessels (red) and Nestin-GFP+ (green) cells. After imaging, sections were re-stained with Alcian blue/Hematoxylin/Orange G for orientation. IF staining images and analysis (Figure 2C&D) demonstrated similar changes of Nestin-GFP+ cells and blood vessels as those seen by MPLSM. Images with Alcian blue/Hematoxylin/Orange G staining revealed chondrocytes at day 5 and day 14, indicating early-middle stages when chondrogenesis participate in fracture repair. Impressively, we found significant corrections between the MPLSM and IF data (Figure 2E) at all time points examined.
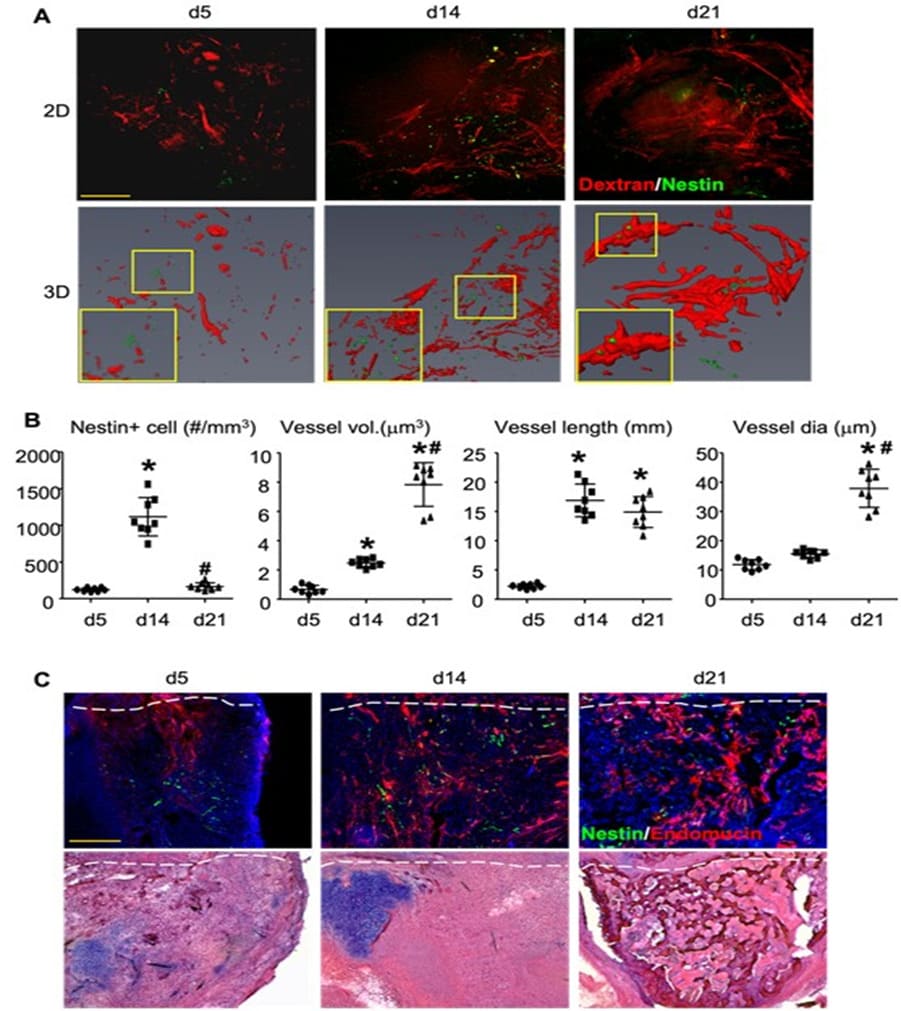
Figure 2: MPLSM of callus in mice with tibial fracture. Three-month-old Nestin-GFP mice received open tibial fracture surgery. At d5, 14 or 21 post-fracture, mice were scanned by MPLSM and then sacrificed. N=8/time point. (A) The representative 2D and 3D images. Inserts show blood vessels (red) and Nestin-GFP+ cells (green). Scale bar=100 mm. (B) Nestin+ cells (#/mm3), vessel volume (mm3), vessel length (mm) and average vessel diameter (mm) were calculated from 3D images. Data are the mean±SD. One way ANOVA with Dunnett’s test. *, p<0.05 vs. d5; #, p<0.05 vs. d14. (C) Callus tissues were cut for thick frozen sections (50mm) and IF stained with a-Endomucin Ab for blood vessel endothelial cells and observed under a fluorescent microscope for blood vessels (red) and Nestin-GFP+ (green) cells. After imaging, sections were stained with H&E for orientation. Scale bar=250 mm. Data are the mean±SD. One way ANOVA with Dunnett’s test. *, p<0.05 vs. d5; #, p<0.05 vs. d14. (D) The same parameter as in (B) were measured by Image J software. (E) Correlation between Nestin+ cells, vessel volume, length and average diameter, parameters that were obtained from 3D MPLSM images and IF images of the same callus using linear regression analysis.
Our ultimate goal is to visualize and assess changes of blood vessels and cells of interest of the same callus at different time points in vivo, To demonstrate this, we performed tibial fracture in another group of Nestin-GFP mice (n=2-4 tibiae) and subjected them to MPLSM at day 5, 14, and 21 longitudinally. Data (Figure 3A&B) showed similar changes in blood vessels and Nestin-GFP+ cells as those from the cross section study showed in Figure 2. Together, this MPLSM SOP enables us to detect similar changes of MSCs and blood vessels in callus compared to conventional histological method in living animals and acquires the dynamic and longitudinal data during fracture repair.
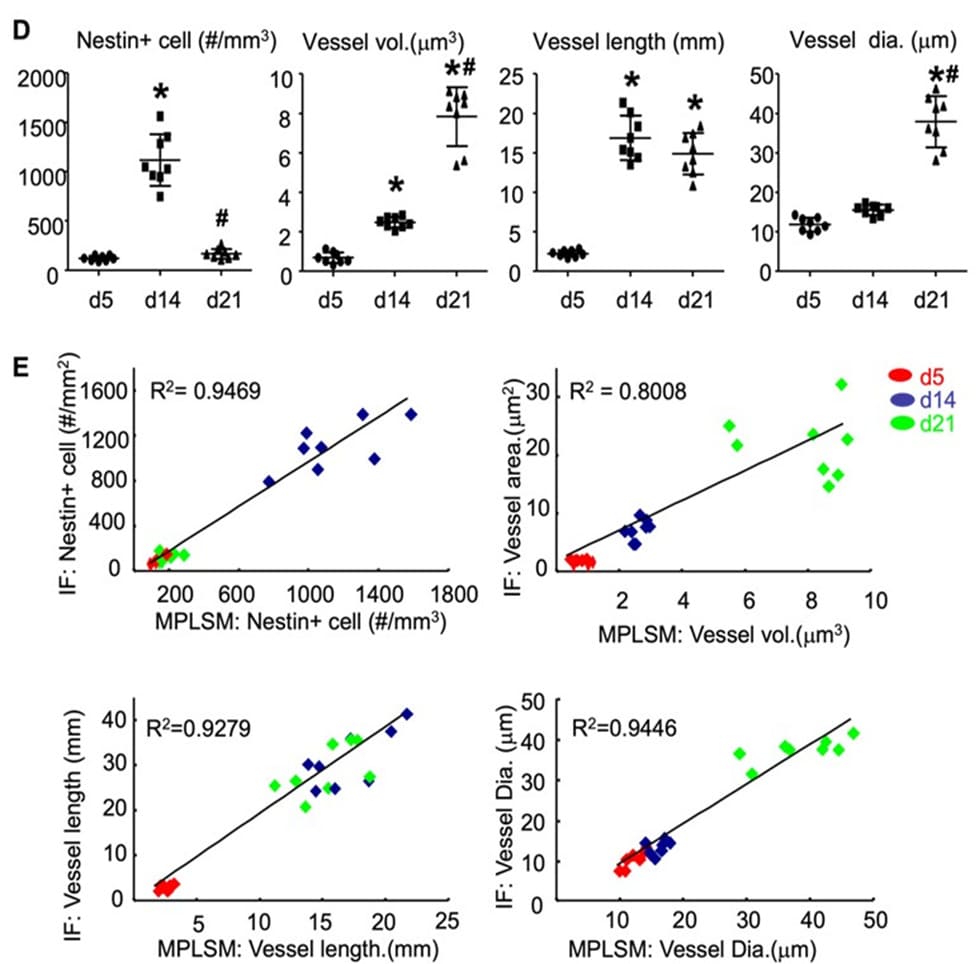
Figure 3. Assessment of blood vessels and Nestin+ cells in fracture calls of Nestin-GFP mice by MPLSM longitudinally. Nestin-GFP mice received tibial fracture surgery and scanned by MPLSM at d5, d14, and d21. Dynamic changes of blood vessels and Nestin-GFP+ cells were assessed from 3D MPLSM images. n=4 legs. Data are mean + SD. One way ANOVA with Dunnett’s test. *, p<0.05 vs. d5; #, p<0.05 vs. d14.
However, there are technical limitations. First, we can analyze the dynamic changes of fluorescence labeled cells and neovasculature only in the tibial fracture due to its superficial location, making MPLSM objective reachable. Second, we are currently able to examine only about 20% volume of callus from the surface because the maximal detection depth of MPLSM is about 200 mm while the entire callus is about 1000 mm deep. Due to these limitations, we should interpret our findings carefully.
In summary, MPLSM has been used in recent years to study the cell distribution and blood vessel formation in cranial bone defects [7-9]. Our method provides the possibility of applying MPLSM in a more clinical relevant fracture repair model for quantitative analysis of the heterogenic behaviors of cell functions in real time in living animals. Therefore, this imaging strategy could be widely used in the field of intravital imaging for numerous in vivo applications.
Acknowledgments
This work was supported by grants from National Institute of Health PHS awards (AG059775, AR63650, AR069789, AR061307, AR054041), NYSTEM N13G-084 (C029548), and Lymphatic Malformation Institute. We thank for Dr. Tao Wu for repeating data analysis.
Authors’ roles
Conceived and designed the experiments: HWZ and LPX. Performed the surgery: HWZ. Performed imaging and image analyses: HWZ, LQZ, RB. Wrote the manuscript and/or contributed to writing: HWZ, LPX and ES.
Reference
- Shoji T, Ii M, Mifune Y, Matsumoto T, Kawamoto A, et al. (2010) Local transplantation of human multipotent adipose-derived stem cells accelerates fracture healing via enhanced osteogenesis and angiogenesis. Laboratory investigation; a journal of technical methods and pathology 90: 637-649.
- Niesner RA, Hauser AE (2011) Recent advances in dynamic intravital multi-photon microscopy. Cytometry Part A : the journal of the International Society for Analytical Cytology 79: 789-798.
- Kikuta J, Ishii M (2012) Recent advances in intravital imaging of dynamic biological systems. Journal of pharmacological sciences 119: 193-197.
- Helmchen F, Denk W (2005) Deep tissue two-photon microscopy. Nature Methods 2: 932-940.
- Ishii M, Egen JG, Klauschen F, Meier-Schellersheim M, Saeki Y, et al. (2009) Sphingosine-1-phosphate mobilizes osteoclast precursors and regulates bone homeostasis. Nature 458: 524-528.
- van Panhuys N, Klauschen F, Germain RN (2014) T-cell-receptor-dependent signal intensity dominantly controls CD4(+) T cell polarization In vivo. Immunity 41: 63-74.
- Huang C, Ness VP, Yang X, Chen H, Luo J, et al. (2015) Spatiotemporal Analyses of Osteogenesis and Angiogenesis via Intravital Imaging in Cranial Bone Defect Repair. Journal of bone and mineral research : the official journal of the American Society for Bone and Mineral Research 30: 1217-1230.
- Antebi B, Zhang L, Sheyn D, Pelled G, Zhang X, et al. (2016) Controlling Arteriogenesis and Mast Cells Are Central to Bioengineering Solutions for Critical Bone Defect Repair Using Allografts. Bioengineering (Basel) 3.
- Kikuta J, Wada Y, Kowada T, Wang Z, Sun-Wada GH, et al. (2013) Dynamic visualization of RANKL and Th17-mediated osteoclast function. The Journal of clinical investigation 123: 866-873.
- Mendez-Ferrer S, Michurina TV, Ferraro F, Mazloom AR, Macarthur BD, et al. (2010) Mesenchymal and haematopoietic stem cells form a unique bone marrow niche. Nature 466: 829-834.
- Kung MH, Yukata K, O'Keefe RJ, Zuscik MJ (2012) Aryl hydrocarbon receptor-mediated impairment of chondrogenesis and fracture healing by cigarette smoke and benzo(a)pyrene. Journal of cellular physiology 227: 1062-1070.
- Brown ML, Yukata K, Farnsworth CW, Chen DG, Awad H, et al. (2014) Delayed fracture healing and increased callus adiposity in a C57BL/6J murine model of obesity-associated type 2 diabetes mellitus. PloS one 9: e99656.
- Wang C, Inzana JA, Mirando AJ, Ren Y, Liu Z, et al. (2016) NOTCH signaling in skeletal progenitors is critical for fracture repair. The Journal of clinical investigation 126: 1471-1481.
- Balderman SR, Li AJ, Hoffman CM, Frisch BJ, Goodman AN, et al. (2016) Targeting of the bone marrow microenvironment improves outcome in a murine model of myelodysplastic syndrome. Blood 127: 616-625.
- Bourque WT, Gross M, Hall BK (1992) A reproducible method for producing and quantifying the stages of fracture repair. Lab Anim Sci 42: 369-374.
© by the Authors & Gavin Publishers. This is an Open Access Journal Article Published Under Attribution-Share Alike CC BY-SA: Creative Commons Attribution-Share Alike 4.0 International License. Read More About Open Access Policy.