Lung Ultrasound, Merlin Space, New Point of View and Approach
by Perlat Kapisyzi1,2*, Durim Çela1, Eugerta Dilka2, Eritjan Tashi1, Ornela Nuredini1, Esmeralda Nushi1, Alma Tefereci1, Marsel Broqi1, Franc Rrumbullaku1, Justi Shestani1, Valentina Hima1
1University Hospital “Shefqet Ndroqi’’ Tirana Albania, Albania
2University of Medicine Tirana Albania, Albania
*Corresponding author: Perlat Kapisyzi, University of Medicine Tirana Albania.
Received Date: 10 August 2024
Accepted Date: 15 August 2024
Published Date: 19 August 2024
Citation: Kapisyzi P, Çela D, Dilka E, Tashi E, Nuredini O, et al (2024) Lung Ultrasound, Merlin Space, New Point of View and Approach. Ann Case Report. 9: 1935. https://doi.org/10.29011/2574-7754.101935
Introduction
Since Viennese Karl Dussik used ultrasound for the first time as a diagnostic tool to find brain tumors and cerebral ventricles in 1942 [1], the Frenchman André Dénier was the first to describe potential diagnostic applications of ultrasound for medical purposes [2]. Daniel Lichtenstein is renowned for his pioneering work in lung ultrasound. He developed the BLUE Protocol (Bedside Lung Ultrasound in Emergency), which allows rapid diagnosis of acute respiratory conditions. He named key ultrasound signs like “B-lines” and “lung sliding” for diagnosing conditions such as pneumothorax and pulmonary edema. His contributions have significantly advanced the use of ultrasound in critical care and emergency medicine, and he has played a crucial role in training medical professionals worldwide. [3-10].
The value of lung ultrasound in diagnosing and managing pulmonary diseases is well-established in many studies. However, there is an ongoing debate over the extensive use of various terminologies such as A, A’, B, B’, C line, sub-B-, I-, J-, N-(sub-B-), Pi-(sub-A-), R-(sub-B-), T-, X-(sub-B-), and Z-lines, some of which have limited clinical significance or are not yet fully understood pathophysiologically.
This situation is reminiscent of Jaroslav Hasek’s assertion that understanding “The Good Soldier Schweik” did not need using every letter in the alphabet.
In this review, we do \not intend to discuss or argue the main echogenic characteristics of various pulmonary pathologies, such as A, A’ lines, B and B’ lines, rocket sign, waterfall sign, shred sign, C line, Jellyfish sign, Plancton sign, lung hepatization, pulsing sign, I line, lung line, M-line, static air Broncho gram, dynamic air Broncho gram, or fluid Broncho gram.
Instead, we focus on the Merlin space, which refers to the area displayed in lung ultrasound images where normal lung structures are visible.
Definition and Characteristics of Merlin Space
In a longitudinal scan, the Merlin space is delimited by the pleural line, rib shadows, and the bottom of the screen. This space typically shows a “twinkling” or shimmering appearance due to lung sliding [5-7,11-13]. The twinkling area in a normally aerated lung is compared by D. Canty to the “white noise” of a television, resulting from lung sliding [14].
Definitions of the Merlin space have been established, but to our knowledge, there is limited data on the echo graphic characteristics of the Merlin space in normal individuals and the changes that occur in individuals with pulmonary diseases. The Merlin space can be compared in importance to a window through which we can at once understand the “weather” of the periphery of the lung
We aim to address the following questions: Why is it crucial to understand the normal structure of the Merlin space? What does the twinkling white area at the beginning of the Merlin space represent? What is its normal appearance shape, size, density, and boundaries and how do these characteristics change in abnormal lung conditions?
In a longitudinal scan, the surface delimited by the pleural line, the shadow of the ribs and the bottom of the screen is defined as Merlin’s space. This space shows the “lung” [5-7,11-13]. Lung sliding is strictly defined as a homogeneous twinkling (shimmering, sparkling, or glittering) of Merlin’s space [5,6].
We studied more than 600 lung ultrasound examinations, compared with lung CT, and 30 examinations of normal individuals. In this study, we used the Clarius handheld ultrasound scanner with a curved linear probe operating at 3-5 MHz for lung imaging.
Contrary to the established definition, we found that the Merlin space is not a homogeneous area, and that pleural sliding is not the only factor contributing to its twinkling. According to our findings, the Merlin space consists of two parts: a hyper echoic twinkling white area starting at the pleural line and a second part appearing as a speckled grey shadow under twinkling white area and extends to the bottom of the screen.
Considering the twinkling white area as part of the Merlin space, rather than calling it the lung sliding area as many authors do, we propose naming it the “peripheral lung area” because the twinkling white area does not disappear when breathing and sliding stop.
In the following paragraphs, we will explain the importance of the hyper echoic twinkling white area of the Merlin space and describe the characteristics and changes that occur in this space.
To better understand the heterogeneity of the Merlin space, we will review some data on peripheral interstitial patterns as well as peripheral lung structure. (Figure 1).
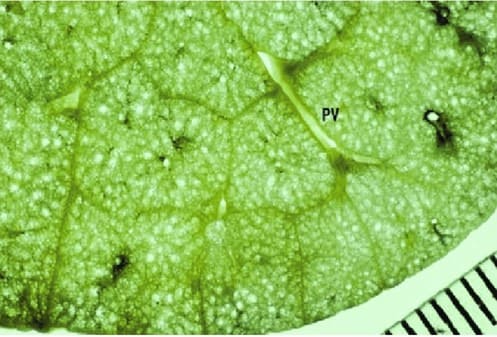
Figure 1: Secondary pulmonary lobule: Miller’s definition. Specimen photograph showing a rich network of interlobular septa. Noted that the area surrounded by the septa is variable. Abbreviation: PV, pulmonary vein [15].
Secondary pulmonary lobules stand for a cluster of up to 30 acini [16] supplied by a common distal pulmonary artery and 4 bronchioles [17-19]. These clustered acini are bounded by interstitial fibrous septa, known as interlobular septa, which outline an irregular polyhedron varying in size between 1 and 2.5 cm [18]. Peripheral lobules are larger and cuboidal/pyramidal, while central lobules tend to be smaller and hexagonal [19]. The septa are thicker and more numerous along the lung periphery, normally measuring approximately 0.1 mm in sub pleural regions, and contain the distal pulmonary veins and lymphatics, which are draining structures. There are two sets of lymphatics: central, which run with the arteries in the peribronchovascular interstitium, and peripheral, which extend along the interlobular septa and drain to the sub pleural plexus [19].
The image deep to the pleural line in a normally aerated lung is all artifact and not an image of the lung parenchyma [5]. The high acoustic impedance gradient between air, tissue, and fluid generates artifacts. Air stops ultrasounds, and fluid facilitates their transmission. The appearance of these artifacts will change depending on the relative amount of air and fluid in the lungs/ pleural cavity [5,8,9,20,21].
There is a difference in the air-tissue ratio between a normal lung (98% air), interstitial syndromes (90% air), alveolar syndromes (10% air), and atelectasis (5% air) [8], all with different sonographic appearances ranging from specific artifacts to true structure visualization.
Lung sliding will be reduced with low tidal volumes or in hyper inflated lungs. It will be absent in any condition in which the pleura are either not directly opposed (pneumothorax, effusion), are stuck together (pneumonia, ARDS, pleurodesis), or in absent respiration (pneumonectomy, one lung intubation) [21].
In the Merlin space, there is an A-line, showing gas below the pleural line. A partial A-line (or even a pattern coined “O-line,” for non-A non-B) is a common finding with unchanged pathophysiologic meaning [10].
The space delimited by the pleural line, silhouette of the ribs, and the bottom of the image is call Merlin’s space; it shows a space where the backscattering of ultrasound waves shows healthy aerated lung tissue [7].
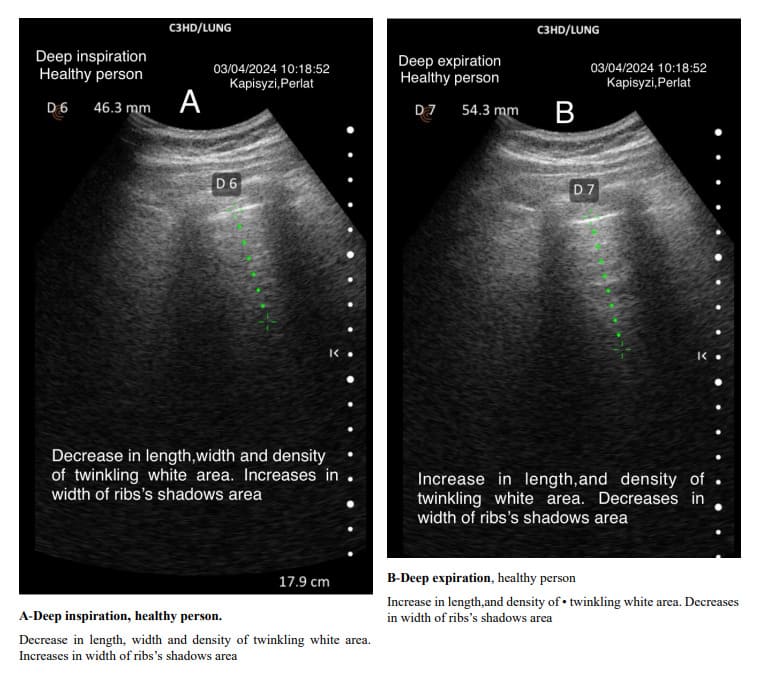
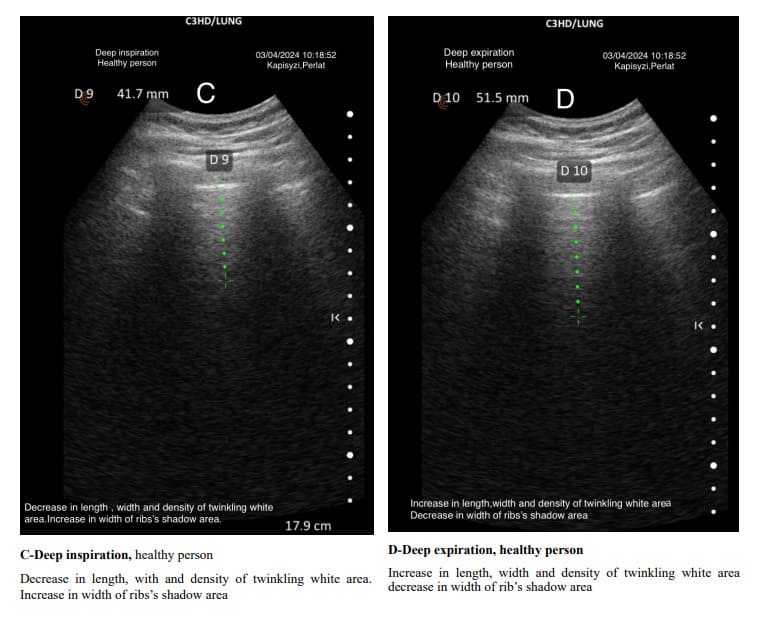
The pulmonary interstitial tissue is closely next to the visceral pleura. The density of the interstitial tissue varies from the apex to the base of the lungs and changes with different depths of breathing. The density of the interstitial tissue is distinct from that of the visceral pleura. In both healthy and diseased subjects, deep inspirations are followed by a decrease in density, shortening of the length, and a change in the shape of the Merlin space’s twinkling white area. The opposite happens in deep expiration.
Arguments against Solely Pleural Sliding Mechanism
We believe that the twinkling area is not solely due to pleural sliding. The following arguments support this view:
In normal individuals, the white twinkling area inside the Merlin space does not disappear when the healthy individual holds their breath.
The twinkling white area changes its intensity, length, and width during deep inspiration and expiration. This variability suggests that the ratio of pleural, sub-pleural, and interstitial peripheral tissue to alveolar air determines the different presentations of the white twinkling area.
In diagnosing pneumothorax via ultrasound, the absence of lung sliding is a diagnostic criterion; however, this does not imply the absence of the twinkling white area in the Merlin space.
These observations suggest that the presence of the twinkling area cannot be explained solely by pleural sliding but is influenced by the ratio between peripheral intrathoracic structures (parietal and visceral pleura, sub-pleural, interstitial peripheral space) and the amount of air in the lung periphery.
We propose that the normal twinkling white area in the Merlin space results from ultrasound wave reflection, reverberation, and scattering as the wave passes through secondary lobules and interfaces with different acoustic impedances, causing a fraction of the wave to bounce back.
Discussion
It is crucial to understand the characteristics of the hyper echoic twinkling white area of Merlin space presentation, not only in cases of acute interstitial inflammations but also in subacute or chronic ones with less significant involvement of sub pleural, lobular, and interlobular septal interstitial tissues.
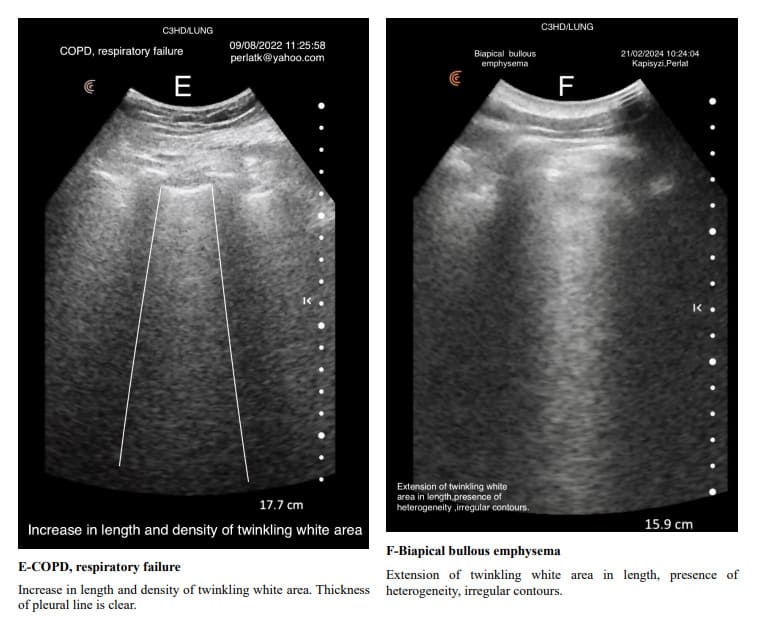
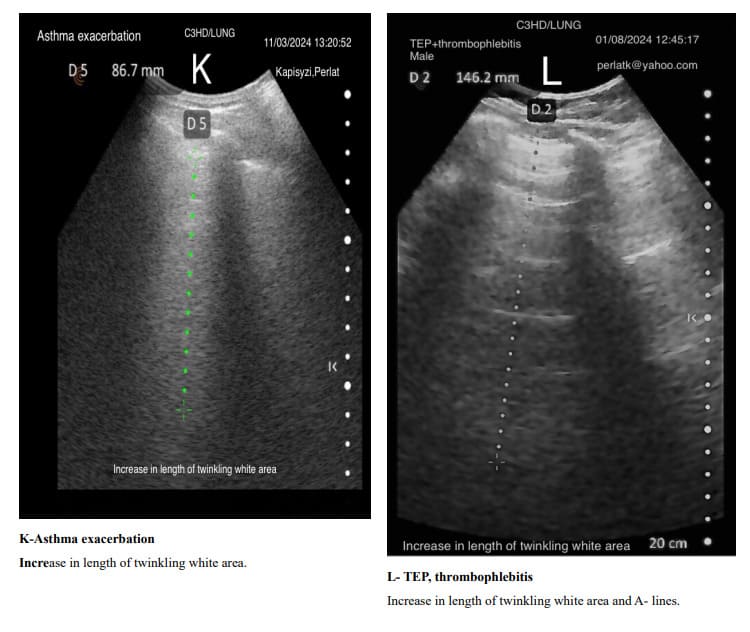
In exacerbations of bronchial asthma or COPD with secondary infections and subsequent inflammation, the Merlin space’s twinkling white area shows increased length and intensity compared to its stable states. In stable chronic asthma and COPD, due to the predominance of air trapping, which causes an increase in the air-tissue ratio, the length and density of the twinkling white area of the Merlin space are reduced. Air trapping in asthma and COPD is associated with an increase in intercostal spaces, which is also reflected in the size of the Merlin space’s twinkling white area, where rib shadows expand and elongate, narrowing the twinkling white area.
Through changes in the characteristics of the Merlin space, we can determine when inflammation predominates over air trapping and vice versa in patients with asthma or COPD.
In lung ultrasound examinations, a penetration depth of approximately 16-20 cm is recommended. However, in a normal echographic view of the lung, the length of the twinkling white area typically ranges from 3.5 cm to 6.5 cm.
Therefore, we suggest defining the Merlin space as follows: The Merlin space is the hyper echoic twinkling white area below the pleural line, delimited laterally by rib shadows and inferiorly by the hypo echoic twinkling black space extending to the bottom of the screen. This definition more accurately reflects the real presentation of the Merlin space and helps in understanding the changes it undergoes in abnormal lung conditions (Figure 2).
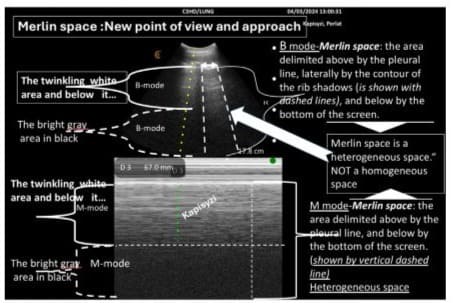
Figure 2: Merlin space includes both areas with different densities: a hyper-echoic twinkling white area and a hypo-echoic gray area in black; therefore, this space is heterogeneous.
The usual shape of hyper-echoic white twinkling area is similar to that of a truncated pyramid, with its base at the pleural line and the truncated apex extending towards the bottom of the screen.
It is very important to distinguish hyper echoic twinkling white are from grouped B-lines. In all the displayed images the hyper echoic twinkling white areas are not due to grouped B lines.
When determining changes in the length of the twinkling white area of the Merlin space, the comparison should be made from the pleural line to the end of the twinkling white surface, not to the bottom of the screen. For example, in a patient with increased air trapping, the twinkling white area may be reduced to 3 cm, while in a patient with predominant inflammation; it might extend to 7 cm.
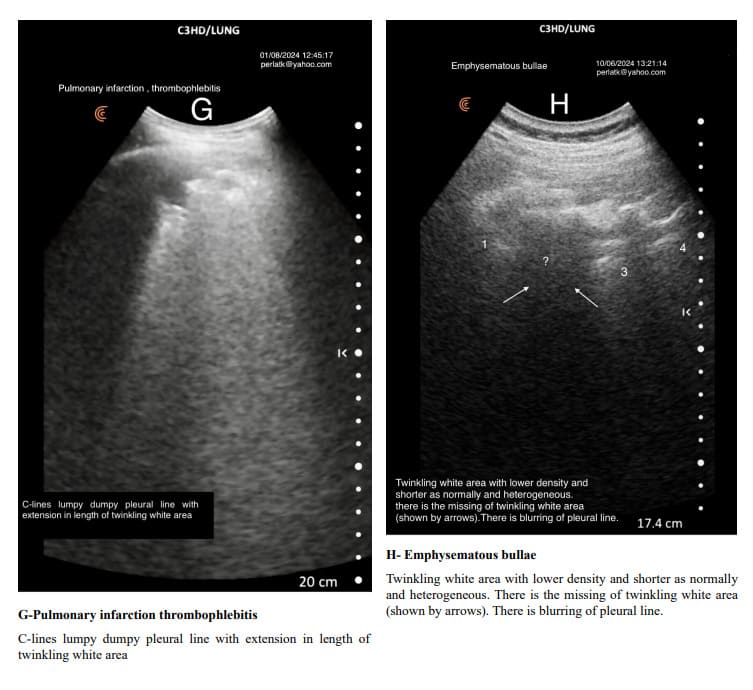
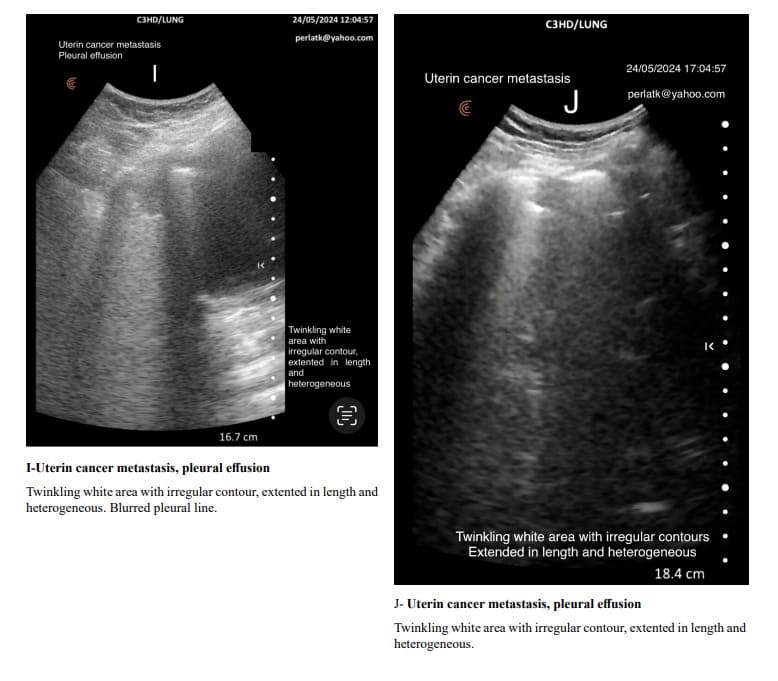
Pulmonary changes might be minor or not fully within the incident angle, leading to suboptimal echographic reflection. However, these changes can cause irregular contours of the Merlin space’s twinkling white area, which are normally straight.
Indirectly, through abnormal contour images of the twinkling white area of the Merlin space, we can deduce the presence of past or present active changes. Irregularity of the white twinkling area borders can be the only finding of lung abnormality.
The homogeneity of the white twinkling area of the Merlin space is particularly important. The presence of hypo-echoic or hyperechoic micro-densities within it should prompt consideration of post-inflammatory fibrosis or latent chronic inflammatory processes.
During deep inspiration, the rib shadows increase in width, decreasing the width of the twinkling white area. Conversely, during deep expiration, the rib shadows decrease in width, and the twinkling white area increases in density and length. The twinkling white area of the Merlin space changes its characteristics from the apex to the bottom of the lung. Alveoli at the apex (top) of the lung have a substantial amount of lung tissue below them for gravity to act on. This creates a large force pulling the lung away from the pleural space, resulting in a more negative intrapleural pressure at the top of the lung. Intrapleural pressure determines alveolus size and indirectly affects the peripheral interstitial tissue. Ventilation is unevenly distributed across the lung because of the range of intrapleural pressures that are established down the lung by gravity. At normal lung volumes, the base of the lung is better ventilated than the apex. At low lung volumes, this relationship is reversed as intrapleural pressures at the base of the lung become compressive, reducing the compliance of basal alveoli, while the compliance of apical alveoli is increased [22,23].
Since the alveoli at the apices of the lungs are more expanded than those at the bases, and the air–interstitial tissue ratio at the interface is greater, this results in the twinkling white area of the Merlin space being less dense and having a shorter length.
Given that the alveoli in the middle and caudal regions of the lungs are less expanded due to increased trans pulmonary pressure, the air/tissue ratio at the air–interstitial tissue interface is smaller than in the apices, resulting in the twinkling white area of the Merlin space being denser and longer. We continue to think that the hyper echoic twinkling white part of the Merlin space isn’t an artifact, but hyper echoic density created only by lung sliding but also by the presence of peripheral interstitial tissue, which has a different impedance than the pleura itself and, of course, air.
In the twinkling part, we see the A-line, but also a bright white area between them. Furthermore, in not a few cases, this hyper echoic twinkling white space is alone, without the A-line. The shape, intensity, and length of the Merlin space’s twinkling white area depend not only on the thickness of the thoracic wall, not only on the incidence angle of the ultrasound (the position of the scanner probe), but also on changes in the sub-pleural peripheral interstitial tissue, which is thicker anteriorly than posteriorly.
This is also one of the reasons why normal Merlin space areas are more visible and clearly delineated anteriorly than posteriorly, at the lung bases rather than at the apices. The homogeneous twinkling white zone of the Merlin space is as homogeneous as the gray part in black of the other part. We have labelled it homogeneous because, in various pathologies, this twinkling white part loses its homogeneity.
Not infrequently, the A-lines are not followed by the bright white zone, particularly in individuals who are hyposthenic with thin thoracic walls. When the bright white zone follows the A-lines in depth, it is an abnormal finding indicating pleural or peripheral interstitial inflammatory changes or peripheral hypoventilation.
The usual shape of the white twinkling area is like that of a truncated pyramid, with its base at the pleural line and the truncated apex extending towards the bottom of the screen. Coincidentally or not, the secondary lobule also has a more or less similar shape. Is the Merlin space’s twinkling white area a “white shadow” of the “tent” of the secondary lobule’s interstitial tissue? The average width of the secondary lobule ranges from 1.2 to 1.5 cm [18]. We believe that the description of many sonographic images in lung examinations should be reviewed.
An artifact in medical imaging is a false or misleading image created by the technical limitations of the device or by external factors affecting the imaging process. When an ultrasound image has a significant clinical and anatomical correlation, it cannot be called an artifact. For example, a B-line has a real clinical and anatomical correlation, indicating the presence of excess fluid or tissue in the interstitium or alveoli of the lungs, and therefore cannot be called an artifact but rather hyper-echoic linear densities.
Similarly, hyper-echoic twinkling density areas in Merlin space cannot be called artifact because the ultrasound image has a real and significant clinical anatomical correlation. It is true that rib shadows are artifacts because they do not correspond to the exact anatomical structure.
Conclusions
The concept of Merlin space has been wrong up to now. The Merlin space is not only a pleural sliding product.
Merlin space is not a homogeneous space but heterogeneous one, consisting of two parts: the hyper-echoic twinkling area, which starts beneath the pleural line and has a length of 3.5-6.5 cm (normally), and below it, is the hypo-echoic gray part in black extending to the end of the screen. So far, Merlin space has not been viewed from this perspective; this is the reason why it has not been used for diagnosis.
Understanding specific areas like Merlin’s space twinkling white area helps clinicians suspect the presence of lung abnormalities and make correct diagnoses. In all peripheral lung pathologies, Merlin space’s twinkling white area undergoes changes in its intensity, homogeneity, length, and contour regularity. (Excluding the clear echogenic changes determined according to the nomenclature mentioned earlier in this discussion). The Merlin space image’s shape, density, length, and contour regularity depend not only on pleural sliding but also on the patient’s constitution, the angle of the scanner probe, the site of examination, and importantly, the air/ interstitial tissue ratio.
By quickly but carefully assessing the homogeneity and form changes in the hyper echoic twinkling white area, we can promptly identify abnormalities in the lung periphery, prompting further investigation to find out the type and nature of the disease. Starting from a different, new concept of Merlin space, we would propose that the description of ultrasound images, when they have a clinical and anatomical correlation should be based on the concept of hyper or hypo echoic densities, replacing the concept of artifact which does not correlates with the actual changes in peripheral pulmonary structures.
References
- Dussik KT (1942) On the possibility of using ultrasound waves as a diagnostic aid. Neurol Psychiat.174: 153-168.
- Dénier A (1946) Les ultrasons, leur application au diagnostic. Presse Méd. 22:307-308.
- Lichtenstein DA, Meziere GA, Lagoueyte JF, Biderman P, Goldstein 1, et al (2009) A-lines and B-lines: lung ultrasound as a bedside tool for predicting pulmonary artery occlusion pressure in the critically ill. Chest. 136: 1014-1020.
- Lichtenstein D, Goldstein I, Mourgeon E, Cluzel P, Grenier P, et al (2004) Comparative diagnostic performances of auscultation, chest radiography, and lung ultrasonography in acute respiratory distress syndrome. Anesthesiology.100: 9-15.
- Daniel L (2010) Whole Body Ultrasonography in the Critically Ill”. Springer.
- Daniel L (2017) Novel approaches to ultrasonography of the lung and pleural space: where are we now? Breath. 13: 100–111.
- Daniel A L (2018) Lung Ultrasound (in the Critically Ill) Superior to CT: the Example of Lung Sliding.Korean J Crit Care Med. 32: 1–8.
- Lichtenstein DA,Meziere GA. (2018) Relevance of lung ultrasound in the diagnosis of acute respiratory failure: the BLUE protocol. Chest.134:117.
- Lichtenstein DA (2014) Lung ultrasound in the critically ill. Ann Intensive Care. 4: 1.
- Daniel A. Lichtenstein, BLUE-Protocol and FALLS-Protocol. (2015) Two Applications of Lung Ultrasound in the Critically Ill. Recent advances in chest medicine. 147: 1659-1670.
- Soldati G, Smargiassi A, Mariani AA, et al. (2017) Novel aspects in diagnostic approach to respiratory patients: is it the time for a new semiotics? Multidiscip Respir Med.
- Shantanu S, Harleen K, Shivank S, Imran K (2018) Basic Insights of Lung Ultrasonography in Critical Care Setting.Cureus. 10: e3702.
- Piotr Ł, Dominik Ś, Zbigniew S, Edyta S (2023) Lung ultrasound in a nutshell. Lines, signs, some applications, and misconceptions from a radiologist’s point of view. Pol J Radiol 88: e294-e310.
- David Canty. POCUS Critical Care.Workshop Pre-reading. Melbourn.
- Takahashi M, Junya F, Nitta N, Ryutaro T, Nagatani Y, et al (2008) Imaging of pulmonary emphysema: A pictorial review. International Journal of Chronic Obstructive Pulmonary Disease. 3: 193-204.
- Flieder DB. (2017) Chapter - Normal Anatomy, Tissue Artifacts, and Incidental Structures. In: Zander DS, Farver CF. Pulmonary Pathology.
- Itoh H, Murata K, Konishi J, Nishimura K, Kitaichi M, et al (1993) Diffuse lung disease: pathologic basis for the high-resolution computed tomography findings. Journal of thoracic imaging. 8: 176-88.
- Heitzman ER, Markarian B, Berger I, Dailey E. (1969) The secondary pulmonary lobule: a practical concept for interpretation of chest radiographs. I. Roentgen anatomy of the normal secondary pulmonary lobule. (1969) Radiology. 93: 507-12.
- Webb WR. (2006) Thin-section CT of the secondary pulmonary lobule: anatomy and the image--the 2004 Fleischner lecture. Radiology. 239:2.
- Bouhemad B, Zhang M, Lu Q, Rouby JJ (2007) Clinical review bedside lung ultrasound in critical care practice. Crit Care.11: 205.
- Miller A (2016) Practical approach to lung ultrasound. BJA Education. 16: 39–45.
- Levitsky, Michael G. (2018) “Chapter 2: Mechanics of Breathing.” In Pulmonary Physiology, 9th ed. New York: McGraw Hill Education.
- West, John B. (2012) “Chapter 7: Mechanics of Breathing—How the Lung Is Supported and Moved.” In Respiratory Physiology: The Essentials, 9th ed. Philadelphia: Wolters Kluwer Health/Lippincott Williams and Wilkins.
© by the Authors & Gavin Publishers. This is an Open Access Journal Article Published Under Attribution-Share Alike CC BY-SA: Creative Commons Attribution-Share Alike 4.0 International License. Read More About Open Access Policy.