Inequalities in Glaucoma Treatment: from Glaucoma Suspects to Primary Open-Angle Glaucoma
by Jasmine Okafor1, Karen Allison2,3*
1A.T. Still University, School of Osteopathic Medicine, Mesa, Arizona, USA
2University of Rochester, Flaum Eye Institute, Rochester, New York, USA
3Prevention of Blindness from Glaucoma and Age-Related Macular Degeneration, Floral Park, New York, USA
*Corresponding author: Karen Allison, University of Rochester, Flaum Eye Institute, Rochester, New York, USA
Received Date: 21 August, 2024
Accepted Date: 29 August, 2024
Published Date: 02 September, 2024
Citation: Okafor J, Allison K (2024) Inequalities in Glaucoma Treatment: from Glaucoma Suspects to Primary Open-Angle Glaucoma. J Community Med Public Health 8: 464. https://doi.org/10.29011/2577-2228.100464
Abstract
Introduction: This study investigates ethnic inequalities in Glaucoma treatment, focusing on Glaucoma suspects and individuals diagnosed with Primary Open Angle Glaucoma (POAG) in New York, Connecticut, Pennsylvania, and New Jersey. Analyzing data from the Vision and Eye Health Surveillance System (VEHSS) from 2014 to 2019, we found significant disparities in prevalence and outcomes across different ethnic groups. African Americans, despite not being the most prevalent among glaucoma suspects, show a drastic increase in POAG diagnosis, highlighting persistent healthcare inequities. Addressing these disparities through patient education, improved access to care, and building trust within minority communities is crucial for reducing the burden of glaucoma and preventing blindness. Methods: Data were examined and analyzed through the Vision and Eye Health Surveillance System (VEHSS) from the Centers for Disease Control and Prevention (CDC) for New York, Connecticut, Pennsylvania, and New Jersey. The statistics focused on individuals confirmed as Glaucoma suspects and those diagnosed with Primary Open Angle Glaucoma. The age groups were divided into 40-64, 65-84, and 85+ over six years. These states were compared due to their proximity and demographic similarities. An extensive literature search was conducted through PubMed. The information was obtained and analyzed showing the prevalence of Glaucoma suspects among different races compared to those eventually diagnosed with Primary Open Angle Glaucoma. Results: When analyzing the findings for Primary Open Angle Glaucoma (POAG), we observed there was a drastic increase in African Americans diagnosed with POAG, despite not having the highest prevalence among Glaucoma suspects. Conclusions: Individuals of African American descent exhibit a notably higher prevalence of Primary Open Angle Glaucoma (POAG). These findings highlight the critical need for tailored approaches to glaucoma care, particularly for high-risk groups such as African Americans. Enhancing routine screenings, improving access to healthcare, and addressing socioeconomic barriers are essential steps to mitigate these disparities and prevent glaucoma progression.
Keywords: Glaucoma; Glaucoma suspect; Healthcare disparities; Glaucoma progression; Blindness; Primary Open Angle Glaucoma
Introduction
Glaucoma ranks as the second leading cause of blindness globally, affecting 3 million individuals in the United States alone [1]. With over 50 million people impacted worldwide, projections estimate a staggering rise to 111 million cases by 2040 [2]. This condition is complex, involving multiple factors and characterized by elevated intraocular pressure, gradually leading to the demise of retinal ganglion cells, thus impairing the optic nerve [3]. Primary Open Angle Glaucoma (POAG) is the most common form, constituting 74% of global cases and 80% within the United States. These numbers are projected to rise further due to global population growth and an increasingly aging population. In POAG, the trabecular meshwork experiences obstruction, resulting in a gradual pressure build-up, eventual optic nerve damage, and consequent vision loss if not diagnosed early and treated [4,5].
A Glaucoma suspect is an individual who is at a higher risk for developing glaucoma due to several characteristics risk factors, including but not limited to race, ethnicity, age, family history, abnormal optic nerve features such as abnormal cup to disc ratios or optic nerve thinning, ocular hypertension, visual field deficits, central corneal thinning and increased intraocular pressure [6,7]. With the diagnosis of a glaucoma suspect, follow-up care is imperative due to the increased likelihood of developing glaucoma [8]. However, due to poor detection rates, increased missed diagnoses, and low follow-up rates, concern has persisted among certain ethnic groups. Without proper diagnosis and management, many of these individuals will experience low vision, with the major consequence being blindness [2]. While there are many factors beyond the patient’s control that play a role in becoming a glaucoma suspect, what can be changed is what occurs after being diagnosed. This highlights the importance of epidemiological factors in the development of primary open-angle glaucoma among glaucoma suspects.
Objective
In this study, we examined Glaucoma suspects in New York, Connecticut, Pennsylvania, and New Jersey, focusing on the progression to Primary Open Angle Open Glaucoma. Data was obtained through the CDC’s Vision and Eye Health Surveillance System (VEHSS). The integrated Vision and Eye Health Surveillance System (VEHSS) uses new and existing data sources to understand the scope of vision loss and eye disorders. The statistical methods used from the VEHSS provides a more accurate summary of the prevalence of major ophthalmic diseases and outcomes [9]. An analysis was conducted on the metrics from VEHSS to determine whether any associations or factors could distinguish between the rates of Glaucoma Suspect and Primary Open Angle Glaucoma, as well as to identify any potential confounding influences
Methods
The findings were examined and analyzed through the Vision and Eye Health Surveillance System (VEHSS) from the Centers for Disease Control and Prevention (CDC) for New York, Connecticut, Pennsylvania, and New Jersey. The information collected consisted of those under Medicare from the VEHSS, specifically those over 65 and as well as under 65 with certain disabilities and conditions. Each state was chosen due to similarities in demographics, proximity, population, and economic factors. Census data was gathered for each state and summarized below in Table 1. Connecticut has an approximate total population of 3,605,944, a median household income of $88,429, and 41.9% of people with a Bachelor’s degree or higher. The demographic breakdown is as follows: 69.84% White, 10.67% Black or African American, 4.73% Asian, 17.37% Hispanic or Latino (of any race), and 0.25% American Indian and Alaska Native. New York has a total population of 20,201,249, a median household income of $79,557, and 40% of people with a Bachelor’s degree or higher. The demographic distribution was as follows: 55.4% White, 14.8% Black or African American, 8.6% Asian, 19.5% Hispanic or Latino (of any race), and 0.2% American Indian and Alaska Native. New Jersey has a total population of 9,288,994, a median household income of $96,346, and 43.5% of people with a Bachelor’s degree or higher. The population consisted of 55.1% White, 13.7% Black or African American, 10.0% Asian, 20.9% Hispanic or Latino (of any race), and 0.6% American Indian and Alaska Native. Pennsylvania has a total population of 13,002,700, a median household income of $71,798, and 35.1% of people with a Bachelor’s degree or higher. The demographic composition was approximately 74.5% White, 11.4% Black or African American, 3.5% Asian, and around 8.1% Hispanic or Latino (of any race) [10]. Each of the four states exhibited a considerable White majority. The Black or African American demographic is prominent in all states, constituting between 10% and 14.8% of the population. The Hispanic or Latino communities are particularly significant in New York and New Jersey, comprising approximately 20% of the population. Additionally, the Asian population is comparatively more substantial in New Jersey and New York than in Connecticut and Pennsylvania.

|
State |
Total Population |
Median Household income |
% with Bachelor’s Degree or Higher |
% White |
% Black or African American |
% Asian |
% Hispanic or Latino (any race) |
% American Indian and Alaska Native |
|
New York |
20,201,249 |
$79, 557 |
40.0% |
55.4% |
14.8% |
8.6% |
19.5% |
0.2% |
|
New Jersey |
9,288,994 |
$96, 346 |
43.5% |
55.1% |
13.7% |
10.0% |
20.9% |
0.6% |
|
Pennsylvania |
13,002,700 |
$71, 798 |
35.1% |
74.5% |
11.4% |
3.5% |
8.1% |
- |
|
Connecticut |
3,605,944 |
$88, 429 |
41.9% |
69.84% |
10.67% |
4.73% |
17.37% |
0.25% |
Table 1: Census data for New York, New Jersey, Pennsylvania, Connecticut.
|
Race |
2014 |
2015 |
2016 |
2017 |
2018 |
2019 |
|
Asian |
12.9 |
13.1 |
13.2 |
13.2 |
13.2 |
13.64 |
|
Black |
10.1 |
10.7 |
10.8 |
10.8 |
11 |
11.39 |
|
Hispanic |
9.8 |
9.9 |
9.8 |
9.8 |
10 |
10.22 |
|
North Native |
7.3 |
6.2 |
6.8 |
7 |
6.7 |
6.88 |
|
White, Non-His |
9.5 |
9.8 |
9.9 |
10.1 |
10.3 |
10.54 |
VEHSS Data: New York Prevalence Percentage of Glaucoma Suspects.
|
Race |
2014 |
2015 |
2016 |
2017 |
2018 |
2019 |
|
Asian |
7.9 |
8 |
8.1 |
8 |
7.9 |
7.79 |
|
Black |
10.9 |
11 |
11.1 |
10.9 |
11.2 |
11.43 |
|
Hispanic |
7.2 |
7.1 |
6.8 |
6.8 |
7 |
6.78 |
|
North Native |
5.6 |
5.8 |
5.8 |
5.6 |
5.8 |
6.09 |
|
White, non-his |
7.3 |
7.2 |
6.9 |
6.8 |
6.8 |
6.34 |
VEHSS Data: New York Prevalence Percentage of Diagnosed Primary Open Angle Glaucoma.
|
Race |
2014 |
2015 |
2016 |
2017 |
2018 |
2019 |
|
Asian |
8.5 |
9.2 |
9.3 |
9.4 |
9.8 |
9.95 |
|
Black |
7.4 |
7.8 |
7.8 |
7.6 |
7.7 |
7.64 |
|
Hispanic |
6.6 |
7.3 |
7.1 |
7.1 |
7 |
7.27 |
|
North Native |
5.5 |
6.3 |
6 |
4.9 |
6.4 |
5.9 |
|
White, non-his |
8.1 |
8.4 |
8.5 |
8.6 |
8.7 |
8.54 |
VEHSS Data: New Jersey Prevalence Percentage of Glaucoma Suspects.
|
Race |
2014 |
2015 |
2016 |
2017 |
2018 |
2019 |
|
Asian |
8 |
8.1 |
7.9 |
8 |
8.5 |
8.52 |
|
Black |
10.9 |
10.9 |
11 |
10.7 |
10.9 |
10.85 |
|
Hispanic |
7.3 |
7.4 |
7.5 |
7.2 |
7.3 |
7.21 |
|
North Native |
8.4 |
7.3 |
8.2 |
7.2 |
8.5 |
7.87 |
|
White, non-his |
7.6 |
7.5 |
7.3 |
7.1 |
8.3 |
6.76 |
VEHSS Data: New Jersey Prevalence Percentage of Diagnosed Primary Open Angle Glaucoma
|
Race |
2014 |
2015 |
2016 |
2017 |
2018 |
2019 |
|
Asian |
9.1 |
9.2 |
9.3 |
9.6 |
9.8 |
9.76 |
|
Black |
9.2 |
9.6 |
9.3 |
10.2 |
9.3 |
9.3 |
|
Hispanic |
7.2 |
7.6 |
7.7 |
8.1 |
7.8 |
7.75 |
|
North Native |
7.8 |
5.5 |
5.1 |
5.3 |
6.1 |
5.3 |
|
White, non his |
9.7 |
9.9 |
10 |
10.2 |
9.9 |
10.11 |
VEHSS Data: Connecticut Prevalence Percentage of Glaucoma Suspects.
|
Race |
2014 |
2015 |
2016 |
2017 |
2018 |
2019 |
|
Asian |
7 |
7 |
7.2 |
7.2 |
6.8 |
6.47 |
|
Black |
11.4 |
11.3 |
11.1 |
11.2 |
10.4 |
10.09 |
|
Hispanic |
6.4 |
6.4 |
6.2 |
6 |
5.9 |
5.58 |
|
North Native |
6.1 |
7.2 |
6.5 |
6 |
6.4 |
5.65 |
|
White, non his |
7.7 |
7.7 |
7.5 |
7.3 |
7 |
6.55 |
VEHSS Data: Connecticut Prevalence Percentage of Diagnosed Primary Open Angle Glaucoma.
|
Race |
2014 |
2015 |
2016 |
2017 |
2018 |
2019 |
|
Asian |
7.4 |
7.8 |
8 |
7.9 |
8.1 |
8.5 |
|
Black |
7.1 |
7.5 |
7.2 |
7.5 |
7.8 |
7.91 |
|
Hispanic |
5.8 |
6.2 |
6.8 |
6.7 |
6.9 |
6.84 |
|
North Native |
4.8 |
5.7 |
5.3 |
5.4 |
7.1 |
5.85 |
|
White, non his |
7.7 |
7.9 |
8 |
8.2 |
8.3 |
8.59 |
VEHSS Data: Pennsylvania Prevalence Percentage of Glaucoma Suspects.
|
Race |
2014 |
2015 |
2016 |
2017 |
2018 |
2019 |
|
Asian |
5.9 |
6.1 |
6.2 |
6.4 |
6.5 |
6.59 |
|
Black |
8.4 |
8.6 |
8.4 |
8.3 |
8.4 |
8.43 |
|
Hispanic |
5 |
4.9 |
5 |
5.1 |
5.2 |
5.1 |
|
North Native |
4 |
4.5 |
4.7 |
4.3 |
5.1 |
4.39 |
|
White, non his |
6.6 |
6.5 |
6.4 |
6.3 |
6.3 |
6.04 |
VEHSS Data: Pennsylvania Prevalence Percentage of Diagnosed Primary Open Angle Glaucoma.
The data focused specifically on individuals diagnosed as glaucoma suspects and those diagnosed with Primary Open Angle Glaucoma. The age groups were divided into 40-64, 65-84, and 85+ over six years: 2014 - 2019. An extensive literature search was conducted through PubMed, focusing on the following search terms: glaucoma, vision loss, blindness, healthcare burden from glaucoma, disparity in glaucoma care, diagnostic tools for glaucoma, glaucoma treatment, glaucoma care, and epidemiology. The evidence obtained were analyzed to show the prevalence of glaucoma suspects among different races compared to those eventually diagnosed with Primary Open Angle Glaucoma.
Results
The results obtained from the VEHSS records showed that the development of Primary Open Angle Glaucoma was highest among African Americans. The information was collected, analyzed, and organized into tables for each state across different races: Asian, Black, Hispanic, North American Native, and white, non-Hispanic. In Figures 1a and 2a. we see that Asians had the highest prevalence for diagnosed Glaucoma suspects from 2014 to 2019 in New York and New Jersey. In contrast, in Figures 3a and 4a. White non-Hispanics were seen to have the highest overall Glaucoma suspects during the same period in Connecticut and Pennsylvania. This was consistent with the census data indicating a higher percentage of White-non-Hispanic in these states compared to New York and New Jersey.
When analyzing the data for Primary Open Angle Glaucoma (POAG), we observed changes compared to those diagnosed with Glaucoma suspects. In all age groups, as shown in Figures 1b through 4b, there was a drastic increase in African Americans diagnosed with POAG, despite them consistently not being the most prevalent among Glaucoma suspects. This trend was relatively consistent across all age group categories and among the four states. North American Natives were excluded from the analysis due to inconsistency and variability.
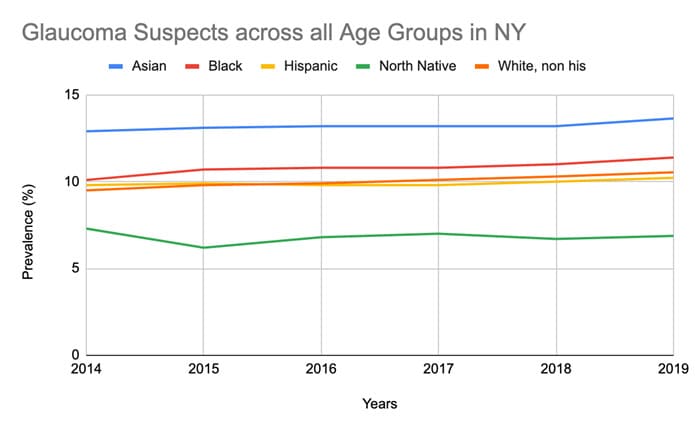 Figure 1a: Glaucoma Suspects across all Age Groups in NY between 2014-2019.
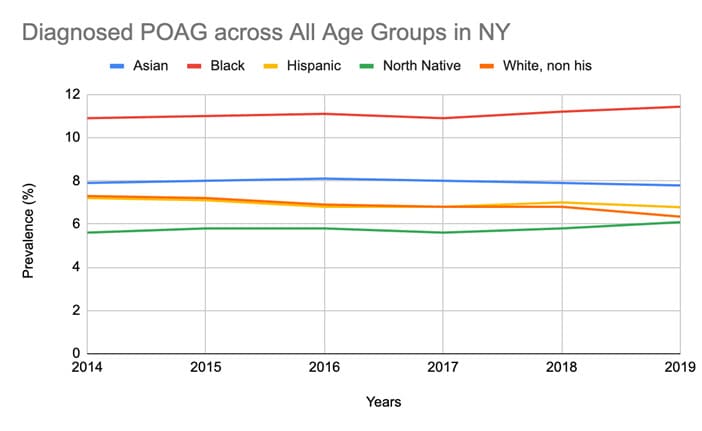
Figure 1b: Diagnosed Primary Open Angle Glaucoma Suspects across all Age Groups in NY between 2014-2019.
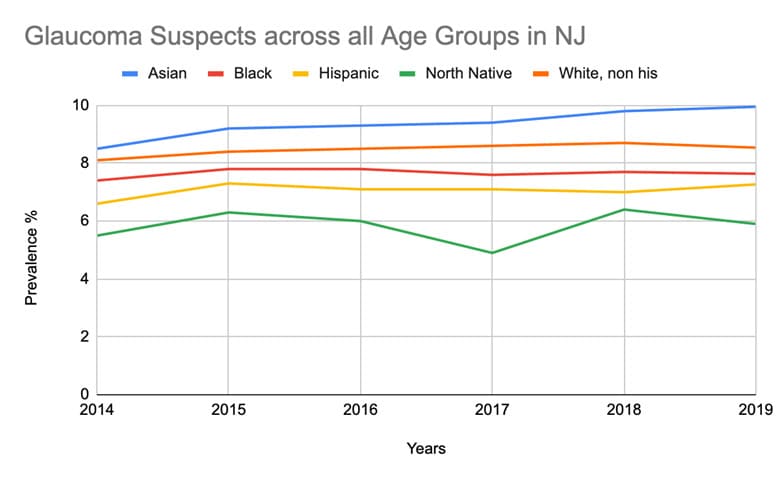
Figure 2a: Glaucoma Suspects across all Age Groups in NJ between 2014-2019.
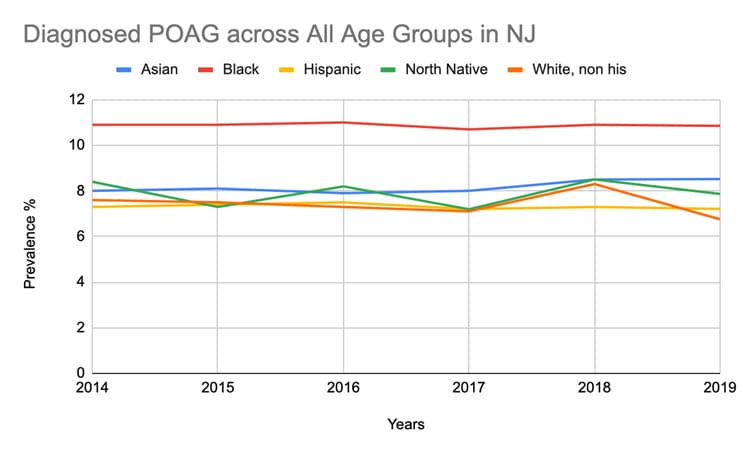
Figure 2b: Diagnosed Primary Open Angle Glaucoma Suspects across all Age Groups in NJ between 2014-2019.
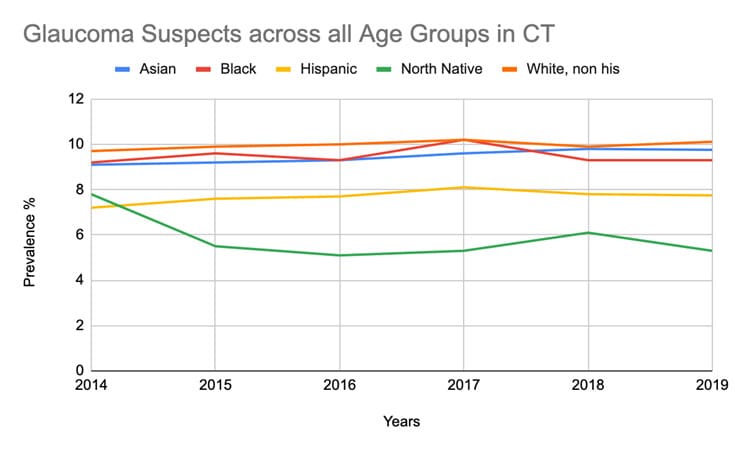
Figure 3a: Glaucoma Suspects across all Age Groups in CT between 2014-2019.
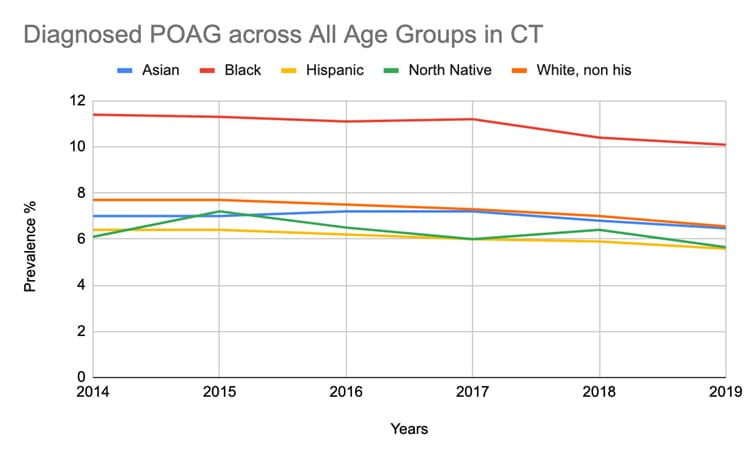
Figure 3b: Diagnosed Primary Open Angle Glaucoma Suspects across all Age Groups in CT between 2014-2019.
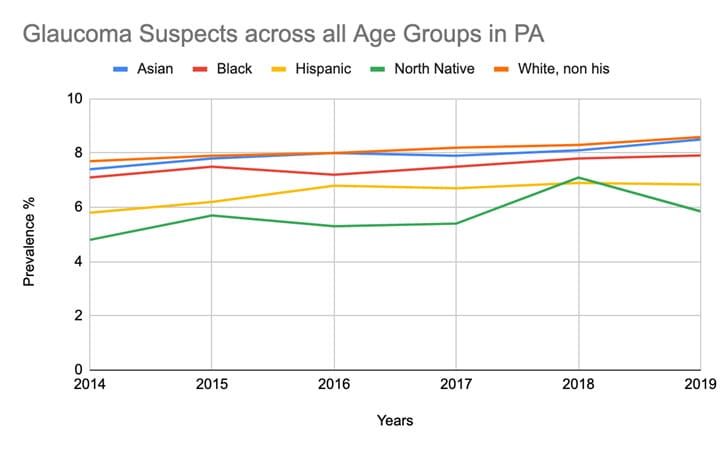
Figure 4a: Glaucoma Suspects across all Age Groups in PA between 2014-2019.
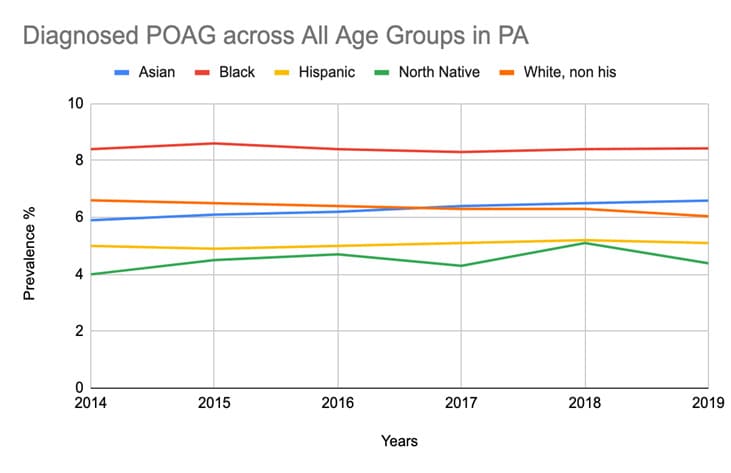
Figure 4b: Diagnosed Primary Open Angle Glaucoma Suspects across all Age Groups in PA between 2014-2019.
Discussion
Numerous factors contribute to glaucoma development, many of which are things we cannot change such as age, family history, race and ethnicity and anatomical variations. We know that age, race, ethnicity, family history and socioeconomic status can all significantly influence the manifestation of and are major risk factors [11]. Individuals of African American descent not only exhibit a higher prevalence of developing Primary Open Angle Glaucoma but also have a greater likelihood of experiencing blindness compared to other racial and ethnic groups as explained by Mahabidi, et al. Glaucoma is recognized as the primary cause of blindness in African-Americans [4]. While genetic and other factors play a role in the onset of glaucoma, the condition is multifactorial. It is shaped by environmental influences including socioeconomic status, healthcare accessibility, educational status and a prevalent distrust in the medical establishment.
A prominent discussion is the effect of social determinants of health on the disparities noted in healthcare and in this case glaucoma care. There is an increasing acknowledgment of the considerable role that social determinants of health play in these disparities. Numerous factors contribute to social determinants, such as educational access, neighbourhood and environmental structure and investments, financial stability, and the availability resources and quality healthcare available [12]. As a result, these, individuals are more vulnerable and likely to experience more severe outcomes from diseases such as glaucoma [12]. While inadequacies in Glaucoma care and testing are evident across all races and ethnicities, Black patients exhibit the most pronounced differences [13]. In a study conducted by Halawa et al. 2022, Medicare beneficiaries from non-Hispanic White, Black, Hispanic, and Asian/Pacific Islander backgrounds were tracked from 2014 to 2016, focusing on their eye visits and eye care-related encounters. Results indicated that, compared to white beneficiaries, Black patients had fewer outpatient visits and visual field tests but more inpatient admissions, surgeries, and emergency department visits. Hispanic patients also showed fewer outpatient visits and retinal nerve fiber layer tests. Notably, even after stratification for socioeconomic status, these disparities persist among Black patients [14]. This underscores the presence of systemic factors underlying Glaucoma care for Black patients.
When addressing socioeconomic status, it is imperative to consider its intertwined relationship with access to healthcare. Access to healthcare and its utilization significantly influence overall patient outcomes. While Halawa shed light on the challenges faced by Black and Hispanic patients in follow-up care, Delavar et al. 2022 investigated potential cost barriers among various ethnic groups. Among the 3,826 patients studied, non-Hispanic Black and Hispanic patients were more likely than non-Hispanic white patients to report being unable to afford medication. Furthermore, Hispanic non-whites were also more inclined to request cheaper medication from their healthcare provider. Delavar’s research not only emphasizes the existing inequities but also illuminates the deficiency in patient-physician relationships among ethnic minorities [15].
In developed countries, access difficulties are often observed in rural areas. However, the dissemination of misinformation stemming from a lack of understanding about Glaucoma and various other eye diseases also deters many from seeking care [2]. Medical mistrust is a longstanding issue that transcends ethnicities and races, affecting healthcare utilization among minority groups. In a 2008 study conducted by Hausmann et al., a racially diverse sample was examined. Outcome measurements included perceived racial discrimination in health care and self-reported health status. Results confirmed that African Americans reported higher levels of perceived racial discrimination [16]. In a meta-analysis of 105 clinical trials on Primary Open Angle Glaucoma, despite Black individuals constituting the majority burdened by the disease, the majority of participants across all trials were primarily white, non- Hispanic [3]. This disparity not only reflects a lack of representation in clinical trials but also extends to Glaucoma follow-up care, with potentially detrimental effects on future care outcomes and the need to evaluate present treatment modalities.
Future Considerations
There are changes that need to be made to start correcting Glaucoma care. Education of patients, families, and healthcare providers, as well as routine screenings, are important ways to combat many of the inadequacies seen in Glaucoma care. Historically, individuals of lower socioeconomic status are more likely to receive poorer healthcare and utilize healthcare services sub optimally, leading to poorer health outcomes and the development of more chronic diseases. This also leads to a higher cost on the healthcare system that has to deal with more advance stages of diseases versus prevention of diseases. This may be attributed to various factors, with health literacy knowledge being one of them [17]. Health literacy, defined by the Institute of Medicine as ‘the degree to which an individual can obtain, communicate, process, and understand basic health information and services to make proper health decisions’ [18]. Low socioeconomic status and low health literacy are interrelated and contribute to some of the inequalities in health outcomes observed today [17]. Thirty percent of Americans surveyed by Prevent Blindness America reported they had never heard of Glaucoma [19]. Developing health education may then be an effective way to combat these adverse sequelae.
Routine eye screenings have proven effective at all levels of care, from primary to tertiary [20]. At the primary care level, they allow physicians to provide advice about eye health and decrease the incidence of disease and injury. Primary care providers can play an active role in utilizing risk factors as suggestions for individuals to engage in routine eye screening. At the secondary level, while variable, slowing down the disease process is the primary goal. Tertiary care can additionally provide regular ongoing maintenance and treatment to individuals experiencing vision loss [20]. Adequate rehabilitation services, low vision support, and social services are essential for assisting numerous patients in adjusting to their visual impairments. In the current technological era, many patients encounter significant challenges in accessing and communicating with healthcare providers, as they must navigate various obstacles. This situation often leads to feelings of isolation and withdrawal from the healthcare system.
Limitations
The analysis conducted was limited exclusively to Medicare data and focused solely on four states. While we were able to identify trends within this specific area, we could not extend our analysis to other regions. Additionally, we were unable to extract socioeconomic data from the VEHSS information.
Conclusion
Glaucoma is a progressive disease that necessitates consistent treatment adherence and monitoring. Various epidemiological factors, including socioeconomic status, race, healthcare access, and mistrust in the medical system, collectively contribute to the observed disparities in diagnosing primary open-angle glaucoma. There is an urgent need for more targeted approaches to glaucoma care. By adopting a more tailored and holistic approach, we can reduce the incidence of undiagnosed glaucoma and alleviate the overall healthcare burden on patients. This can be achieved by implementing education programs to increase treatment adherence [21], addressing socioeconomic barriers through increased funding for community programs focused on glaucoma prevention, improving access to healthcare by expanding services in underserved areas or using mobile eye units, and building trust in the medical system through engagement with community leaders and patient advocacy groups. Other considerations may include inadequacy of cost-effective screening strategies, inadequate human resources and suboptimal training for healthcare professionals. As the population continues to grow and age there may not be enough resources and man power to address these needs. As the world changes and patients continue to migrate, language and cultural barriers are also major limitations that need to be addressed. Patients are more comfortable with people that look like them and speak the same language. In addition to inaccessibility, many of the current facilities have an infrastructure and system that is not patient inclusive and is filled with many potential biases. Patients have less accessibility to their physicians especially if they are not computer literate.
This is a very complex area; however, we should make every effort to educate our patients and diagnose glaucoma earlier before advance glaucoma ensures leading to vision loss and blindness.
References
- Davuluru SS, Jess AT, Kim JSB, Yoo K, Nguyen V, et al. (2023) Identifying, understanding, and addressing disparities in glaucoma care in the United States. Transl Vis Sci Technol 12: 18.
- Rooney DM, Kalra G, Tabin G, Kavitha S, Venkatesh R (2023) Glaucoma in the developing world. EyeWiki. American Academy of Ophthalmology.
- Allison K, Patel D, Alabi O (2020) Epidemiology of Glaucoma: The Past, Present, and Predictions for the Future. Cureus 12: e11686.
- Mahabadi N, Zeppieri M, Tripathy K (2024) Open Angle Glaucoma. In: StatPearls [Internet]. Treasure Island (FL): StatPearls Publishing.
- Wagner IV, Stewart MW, Dorairaj SK (2022) Updates on the Diagnosis and Management of Glaucoma. Mayo Clin Proc Innov Qual Outcomes 6: 618-635.
- Ou Y (2021) What is a Glaucoma Suspect? BrightFocus Foundation website.
- Kass MA, Heuer DK, Higginbotham EJ, Johnson CA, Keltner JL, et al. (2002) The Ocular Hypertension Treatment Study: a randomized trial determines that topical ocular hypotensive medication delays or prevents the onset of primary open-angle glaucoma. Arch Ophthalmol 120: 701-713; discussion 829-30.
- Gordon MO, Beiser JA, Brandt JD, Heuer DK, Higginbotham EJ, et al. (2002) The Ocular Hypertension Treatment Study: baseline factors that predict the onset of primary open-angle glaucoma. Arch Ophthalmol 120: 714-720.
- Rein DB, Wittenborn JS, Phillips EA, Saaddine JB; Vision and Eye Health Surveillance System Study Group (2018) Establishing a Vision and Eye Health Surveillance System for the Nation: A Status Update on the Vision and Eye Health Surveillance System. Ophthalmology 125: 471-473.
- U.S. Census Bureau (2023) American Community Survey: 2023 ACS 1-Year Estimates Data Profiles.
- Dada T, Verma S, Gagrani M, Bhartiya S, Chauhan N, et al. (2022) Ocular and Systemic Factors Associated with Glaucoma. J Curr Glaucoma Pract 16: 179-191.
- Powers AM, Patel D, DeAngelis MM, Feng C, Allison K (2024) Risk factors affecting the utilization of eye care services evaluated by the CDC’s behavior risk factor surveillance system from 2018 to 2021. Front Public Health 12: 1335427.
- Kitayama K, Wilson MR (2024) Glaucoma in Black Individuals: How Far Have We Come and Where Do We Go From Here? American Journal of Ophthalmology 259: 96-101.
- Halawa OA, Kolli A, Oh G, Mitchell WG, Glynn RJ, et al. (2022) Racial and socioeconomic differences in eye care utilization among Medicare beneficiaries with glaucoma. Ophthalmology 129: 397-405.
- Delavar A, Saseendrakumar BR, Weinreb RN, Baxter SL (2022) Racial and Ethnic Disparities in Cost-Related Barriers to Medication Adherence Among Patients With Glaucoma Enrolled in the National Institutes of Health All of Us Research Program. JAMA Ophthalmol 140: 354-361.
- Hausmann LR, Jeong K, Bost JE, Ibrahim SA (2008) Perceived discrimination in health care and health status in a racially diverse sample. Med Care 46: 905-914.
- Jansen T, Rademakers J, Waverijn G, Verheij R, Osborne R, et al. (2018) The role of health literacy in explaining the association between educational attainment and the use of out-of-hours primary care services in chronically ill people: a survey study. BMC Health Serv Res 18: 394.
- Institute of Medicine (US) Committee on Health Literacy; NielsenBohlman L, Panzer AM, Kindig DA, editors. Health Literacy: A Prescription to End Confusion. Washington (DC): National Academies Press (US); 2004. 1, Introduction.
- Covin YN, Laroche D (2014) The Societal Costs of Blindness from Uncontrolled Glaucoma. Glaucoma Today.
- Medical Advisory Secretariat (2006) Routine eye examinations for persons 20-64 years of age: an evidence-based analysis. Ont Health Technol Assess Ser 6: 1-81.
- Allison K, Morabito KA, Qin H (2024) Improving Compliance with Glaucoma Therapies through the Examination of Environmental Factors and the Localized Side Effects of Glaucoma Drugs. AJHSR. MS.ID.000514.
© by the Authors & Gavin Publishers. This is an Open Access Journal Article Published Under Attribution-Share Alike CC BY-SA: Creative Commons Attribution-Share Alike 4.0 International License. Read More About Open Access Policy.