Enhanced Gas Recovery by CO2 Injection Method in Depleted Gas Reservoirs
Muhammad Attique Amer1, Shahid Ghazi1, Shahid Ali1, Tehseen Zafar2, Muhammad Riaz3*
1Institute of Geology, University of the Punjab, Lahore, Pakistan
2Institute of Geochemistry, Chinese Academy of Sciences, Guiyang, China
3School of Earth Sciences and Resources, China University of Geosciences, Beijing, China
*Corresponding author: Muhammad Riaz, School of Earth Sciences and Resources, China University of Geosciences, Beijing 100083, ORCID ID: 0000-0002-6154-3354, China. Tel:+923339834262; Email: riazjass@yahoo.com
Received Date: 25 October,2018; Accepted Date: 12 November, 2018; Published Date: 20 November, 2018
Citation: Amer MA, Ghazi S, Ali S, Zafar T, Riaz M (2018) Enhanced Gas Recovery by CO2 Injection Method in Depleted Gas Reservoirs. Arch Pet Environ Biotechnol: APEB-144. DOI: 10.29011/ 2574-7614.100044
1. Abstract
Enhanced Gas Recovery (EGR) in mature fields is an exceptional and tremendous opportunity to promote the production of the remaining gas through the injection of CO2. Geological model, well logs and other data are used for forecasting the EGR by injection of CO2 after its conventional depletion and long term CO2 sequestration. The Computer Modeling Group’s simulator is used for forecasting the reservoir performance and evaluation of the reliability of these predictions. The various possible scenarios forecast almost twenty-two years of gas production which also include four years and ten months of EGR by the injection of CO2. Through CO2 injection, sweep efficiency can be increased in low pressure reservoirs that can enhance the production up to 14%. Present study reveals that total 60 million tons of CO2 can permanently be sequestrated in the depleted reservoir during thirty years of injection period.
2. Keywords: Carbon Sequestration for Enhanced Gas Recovery (CSEGR); Enhanced Gas Recovery (EGR); General Equation of State Model (GEM); CO2
3. Introduction
Carbon dioxide can be reflected as the most essential amongst greenhouse gases, emitted in consequence of human activity. Comparable situation is documented in famous part of Polish lowlands in western Poland that reveals presence of appropriate geologic structures and reservoir potential for CO2 storage [1]. This region comprises thick packets and succession of sedimentary rocks containing exceptional reservoir characteristics [2-4]. These rocks are encapped and intercalated by cap rocks. Geological CO2 sequestration into gas reservoirs is a reasonable method for reducing massive amounts of CO2 emissions and increasing natural gas recovery.
According to International Energy Agency (IEA) as much as 140 GtC (Gega Ton Carcon) could be sequestered in depleted Hydrocarbon Reservoirs Worldwide (IEA, 1997) [5] and 10 to 25 GtC only in the U.S. [6]. These aspects of natural gas reservoirs for carbon sequestration are extensively recognized. Computer simulation modeling is an imperative economical tool for designing enhanced gas recovery projects. Burgt et al. (1992) and Blok et al. (1997) [7,8] used reservoir simulation to evaluate how quickly the injected CO2 would mix with the produced natural gas.
On the basis of simulation results, they concluded that it is feasible to enhance production for short period before the extent of mixing become too great. Furthermore, the gas production wells can be used as storage places for carbon dioxide over a long period of time. According to Geotechnologien (2012) [9], more than 50% of the gas reservoirs have the potential for future CO2 storage. The key benefit in CSEGR is the enhanced recovery and at the same time getting rid of greenhouse gases. Due to this reason, the petroleum companies are gaining more interest on the CO2 sequestration technology. The geological, technical and economic parameters are the key aspects that can affect the optimization of CSEGR and monitoring issues of carbon capture and storage [9]. The aims of the present research are; i) to highlight the storage and utilization of carbon dioxide gas in the depleted reservoirs and ii) to demonstrate the carbon dioxide injection method into depleted natural gas reservoirs that will extends the production life and gas recovery as a result.
4. Methodology
The study area is located near the locality “Radecin” in western Poland and the distance of 103 Km from Poznan city and from Szczecin city, it is about 95 Km (Figure 1). The present research is carried out on a newly proven gas reservoir from the Lower Jurassic sediments, located in the western Poland on latitude of 53° 3' 8.8" N and longitude at 15° 51' 10.8" E.
For this research, 3D geological model of the reservoir has been received from Faculty of Geology, AGH University of Science and Technology Krakow, Poland. This model was constructed by using Schlumberger’s Petrel software. Furthermore, regional maps in the form of a regular grid mesh interpolation are the base of this 3D structural model [10]. Computer Modeling Group (CMG) software is used for numerical modeling and simulation. Based on data from Radecin-1 and Suliszewo-1 wells, the simulation process is carried out through GEM simulator. GEM is a full equation-of-state compositional reservoir simulator with advanced features for modeling recovery processes where the fluid composition affects the recovery.
GEM is used for forecasting the reservoir performance and evaluation of these predictions reliability. These predictions are essential engineering tool for the modeling of very complex reservoirs with intricate phase behavior interactions which have direct impact on the recovery mechanism employed to optimize the recovery. This engineering tool has all aspects that you can expect from a full-field compositional simulator [11].
5. Regional Geology
Poland is sandwiched between the Baltic Sea and the northern part of the Carpathian Mountains. The Teysere-Tornquist Tectonic Zone in Poland separates the East European Craton from Paleozoic sequence. In this area, extensive exploration for new petroleum resources resulted in completion of deep drill holes and seismic profiles that were used to construct detailed lithostratigraphic and structural analyses. Furthermore, models of subsurface geology were created, such as horizontal slice maps. These models effectively depicted deep geology, including complex structures [12].
Western Poland also represents the exceptionally favorable geological conditions for CO2 injection and storage. The thick Permo-Mesozoic sedimentary rocks with elevated (anticline) structures combined with salt tectonics are the main features for the prone CO2 storage in the western Poland. The present research on Lower Jurassic sediments of Poland is showing the distribution of these sediments. The cross-section along AB is representing the vertical view of Polish Geology sequences (Figure 2).
6. Lithology and Stratigraphy of the Western Poland
The Lower Jurassic can be divided into four units on the basis of lithology and stratigraphy in the western Poland (Table 1) [14,15].
a) Toarcian: The Gryfice Beds and Kamien Beds of Toarcian age has silty and clayey arenaceous sediments with alternation of sandstone.
b) Pliensbachian: The rocks of Pliensbachian age are mostly comprised of sandstone. The sandstone of Komorowo Beds has alternation of clayey shale beds and coal deposits. The Lobez Beds consist of sandstone with silty- clayey deposits.
c) Sinemurian: The Sinemurian Radowo Beds and Upper Mechowo Beds have arenaceous deposits.
d) Hettangian: The rocks of Hettangian age also have arenaceous sediments.
7. Results and Discussion
7.1 Mechanism of Enhanced Gas Recovery
The Carbon Dioxide (CO2) injection into primary depleted gas reservoirs can enhance the methane (CH4) recovery and at the same time sequestering large amounts of CO2. The CO2 display the supercritical conditions in the gas reservoirs. In the reservoir, pure CO2 is much denser and more viscous than pure CH4 that will tend to under ride the existing gas and give it buoyancy as well as diminished the tendency of mixing and interfingering. Results indicate that the 73% to 85% of the total in placed gas can be recovered at the break through of the CO2 [16].
7.2 Reservoir Parameters
Petrophysical analysis is the tool which makes distinction between gross and net pay by applying cut-off values. The cut-off values are calculated on the basis of porosity, permeability and water saturation while these are calculated from core data and capillary pressure data [17]. Net pay is part of a reservoir from which recoverable hydrocarbons can be calculated at economic rate. In N/G ratio, pay zone thickness is divided with the total or gross thickness of the reservoir. The average value of porosity and water saturation is assigned in a zone (single well pool) or used as weighted average value in the entire pool (numerous wells pool). In proposed project, water saturation is assumed as 29%. Drainage area determination is also done by using the statistics of the distant pool depending on the geological similarities and productivity of the wells. The same method is used for water gas contact. In the present model, water gas contact is assumed at the depth of 1050m. Initial oil or gas formation volume factor is used on reservoir pressure, temperature and consequently on reservoir depth for volumetric calculation. Formation Volume Factor (FVF) calculation is determined using offset pools in prospecting and reserve estimation.
7.2.1 Regional Model Showing Grid Top
Regional model of the research area is shown in (Figure 3) with grid top. The Redecin-1 well is also marked on the top.
7.2.2 Porosity of Reservoir Zone
This model is depicting the reservoir area having more porosity while on the top the rock having less porosity which acts as seal rock (Figure 4).
7.2.3 Permeability of Reservoir zone
Permeability is another important property of reservoir. In cross sectional view, the reservoir is displaying permeability variance by the help of the color contrast. It is obvious from the figure that on the top of the structure the permeability is low (seal rock for CO2) and relatively high downward where reservoir is located (Figure 5).
7.3 Reservoir Properties
The numbers of block models are reduced for better and quick results of simulation (Figure 6). The new model and various modified characteristics are shown in Table 2. In this research model, the minimum value of grid top is 928.4815 m, while maximum value is 1651.781 m (Figure 7). The layer 1 and 3 (Figure 8) shows the porosity difference but in the reservoir zone, porosity is greater than top and bottom layers. The average permeability in this model is 1713 md (Table 3) however, it is increased towards the reservoir zone, which is good for production point of view (Figure 9). The Toarcian rocks are assumed as cap rock for the hydrocarbons having high clay contents. On the other hand, Pliensbachian rocks are mostly sandstone which shows the properties of reservoir with porous and permeable lithology. The marked area “A” indicates (Figures 10,11) the clay and shale contents with less porous and permeable strata while the marked area “B” displays the reservoir characteristics with high porosity and permeability. This information recorded from well logs of Radecin-1 and Suliszewo-1 wells is used in simulation process. In Figures 10,11, reference depth, stratigraphy, lithology, porosity and permeability is displayed in first five columns from left to right respectively. While the last three columns show the caliper log, gamma ray log, later log and neutron log.
7.4 Simulation Process
Well and recurrent-section is important in the description of the parameters and simulation process. The portrayal of three tools used is presented below.
7.4.1 Well
Eight wells are placed on the proposed reservoir. The two well are injector while the other six are the producer wells. Injectors are placed on the extreme wings of the gas water contact so that CO2 cannot mix with CH4 easily. On the other hand, producers are placed on the top of anticline structure of the reservoir (Table 4).
7.4.2 Dates
The dates are added from the 01-01-2015 to 01-04-2064. Conventional recovery, shut in period, EGR time and injection period all is cumulated in this duration.
7.4.3 Well List
The time period in which wells are opened or shut are explained in the (Table 5). The table shows that the total production period is 21 years and 10 months including the EGR duration at the production rate of 700000m3/day. On the other hand, injection of CO2 is for 30 years long at the injection rate of 1370000m3/day.
7.5 Possible Cases
Various possible cases and scenarios are deliberated and analyzed with the help of simulation. First of all, the base case for conventional depletion of the gas field is described which illustrate the maximum recovery taken from the reservoir. Some other scenarios are also explained for EGR and simultaneously CO2 storage process like pressure and CO2 saturation with time.
7.5.1 Conventional Depletion
The production of gas from the reservoir is started on February 2015. According to this research, surface gas rate (STG) 700000 m3/day and BHP 5000 kPa is used for the 90% production of the total gas from the reservoir which is 3.31E10 m3 (33.1 BCM) (Figures 12,13).
7.5.2 Estimated Gas Recovery Factor
Graph in (Figure 12) is showing the 90% gas recovery that can be obtained by conventional depletion up to 2040.
7.5.3 Cumulative Gas Production
The cumulative gas which can be produced up to 2040 is 3.31E10 m3 (33.1 BCM) and it is shown in (Figure 13). Furthermore, cumulative gas production from each well is shown in the (Figure 14).
7.5.4 Gas Rate in Conventional Depletion
Based upon economical plan before the production rate has been selected as minimum 30000m3/day. At the start of gas production rate is chosen 700000m3/day for primary recovery.
7.5.5 Bottom Hole Pressure (BHP)
The minimum pressure (abandoned BHP) has been assumed as 5000 kPa. Obviously, after 2034, bottom hole pressure is lowered than the 5000 kPa and production from well is stopped at this time (Figure 15).
7.5.6 Water Rate
The production of water in wells is expected after 2034 years. The maximum water production rate is 15m3/day in 2034 (Figure 16).
7.5.7 Gas Saturation in 1st Layer
The results indicate (Figure 17) that the gas saturation is lowering in the 1st layer of reservoir with the passage of time due to the production of the natural gas. This figure is presenting the saturation according to time span and it does not stand true in volumetric case.
7.5.8 Pressure Decrease in the Base Case
Figure 18 shows that the pressure is decreased significantly from 2015 to 2040 due to production of natural gas in primary depletion of reservoir.
7.5.8.1 Case 1: Injection of CO2
The analysis of base case indicates that the gas rate is decreased below economical rate of the production. CO2 injection will increase the pressure of the reservoir and enhancing the gas recovery up to maximum level. After taken the recovery up to 71%, two months’ rest is given to reservoir in between the production and injection period then CO2 injected for EGR purpose. The 85% cumulative gas Recovery (Figure 19) is obtained after the CO2 injection including the EGR.
Moreover, Tabular description of EGR and total production of natural gas is explicitly described in percentage with in specific time domain (Table 5).
7.5.8.2 Case 2: CO2 Breakthrough in Produced Gas
In this EGR project care is taken about the CO2 not to come again on the surface in huge amount with the CH4 gas and this process is called as CO2 breakthrough. It is not feasible for the following three reasons.
1. Contaminate the natural gas
2. Logically against the CO2 sequestration project
3. Safety of the technology
To avoiding problem (1 and 2) in simulation results, a GEM constraint is used for allowing the 5 to 7 % CO2 breakthrough in the gas production. In wells PRO-1, PRO- 2, PRO-3 and PRO-4, PRO-5, PRO-6 the breakthrough of CO2 is 5% and 7% respectively (Figure 20).
CO2 injection rise the pressure of reservoir and care should be taken that it does not damage the reservoir rock. So, the injection BHP should not exceed from the pressure which was initially in the reservoir when production is started. At the start of the production, the bottom hole pressure (BHP) is the 15000 kPa which is lowered down up to 5000 kPa after conventional production of the gas. BHP rose up again to 12360 kPa till 01-04-2062 by the injection of CO2. This increase in pressure is the mechanism for EGR and further guide about the capacity for CO2 storage in the reservoir (Figure 21). It demonstrates the increase in BHP by the injection of CO2 with the interval of five years both in injection and production wells.
7.5.8.4 Case 4: CO2 Saturation
The CO2 injection is started in 01-04-2032 at the rate of 1million ton/year (1.37E06 m3). In this case, saturation and flow of CO2 is studied on different time interval which further guide about the monitoring of the CO2 stream. In this sequestration process, monitoring is the most important aspect. The simulation model shows (Figure 22) the flow of CO2 stream spreading after the interval of every five years.
Whereas, the cross sectional views of the simulation model are given in (Figure 23). These models describe the saturation of CO2 in each layer horizontally with the passage of time.
7.5.8.5 Case 5: CO2 Storage
CO2 storage in depleted gas reservoir is a main objective of our research. The base case provides information about the estimation of the CO2 stored in this depleted gas reservoir. For this purpose, the rate of injection is taken 1million ton/year (1.73E06 m3). (Figure 24) indicates that the total injection of CO2 3.00E10 m3 which is equal to the 60 million tons of CO2.
8. Conclusions
The present research highlight a newly proven gas reservoir from the western Poland classically investigated for EGR and CO2 sequestration, based on the results of diverse prediction scenarios. Simulation results reveal that 90% primary recovery can be taken from the reservoir up to 25 years of production, however, the gas rate of production will be very low after 2034. This recovery will not be economical for production and distribution point of view after this year. By injecting the CO2 from 2032, sweep efficiency can be increased and repressurized the reservoir again to get the more production at economical level. Results illustrate that almost 14% additional gas can be obtained by using this sequestration process.
Breakthrough of CO2 for EGR is allowed maximum 7% in the production wells. Additional recovery can be increased if we allowed breakthrough up to 15-20%. But this scenario assumes the need to separate installation for the refining purpose of this CO2 which can increase the operational and investment cost of this project. One million ton of CO2 per year can be injected from the one well and using two injection wells, total 60 million ton CO2 can be injected into the reservoir up to 30 years. Saturation of CO2 stream with the passage of time may also look after by the help of this modeling and simulation. This can be helpful for the proper monitoring of CO2 leakage aspects in the reservoir.
9. Acknowledgement
The present work is a part of M. Phil thesis which was completed by Muhammad Attique Amer in University of the Punjab, Lahore, Pakistan. The Authors are thankful to those who participate directly or indirectly to modify the manuscript.
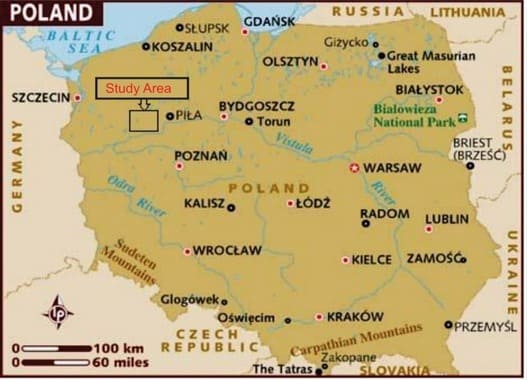
Figure 1: Map of Poland showing the proposed study area.
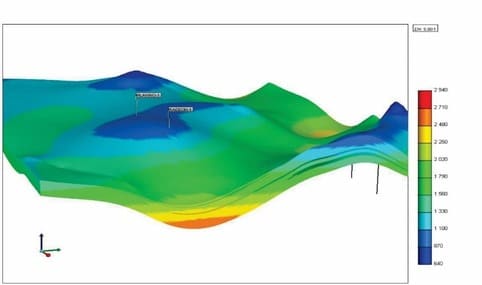
Figure 2: a) Geological map of Polish Lowlands sedimentary Basin; b) Geological cross-section along line AB; modified from Malolepszy (2006) [13].
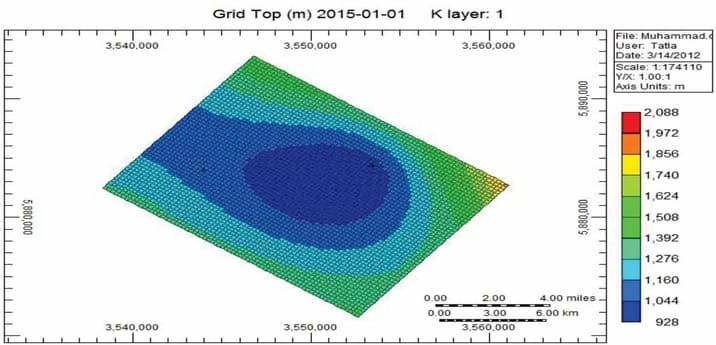
Figure 3: 3D regional static model of project area with grid top, showing Redecin-1 well.
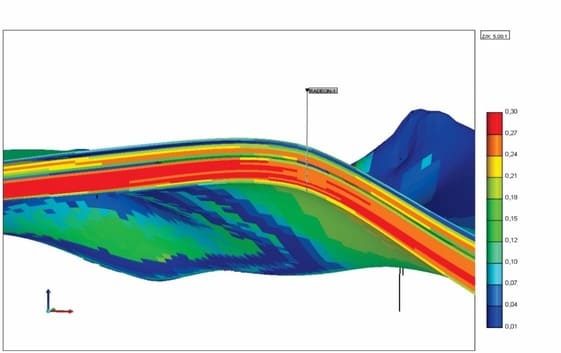
Figure 4: Static model shows grid top of research area and grinding process for simulation purpose before modification.
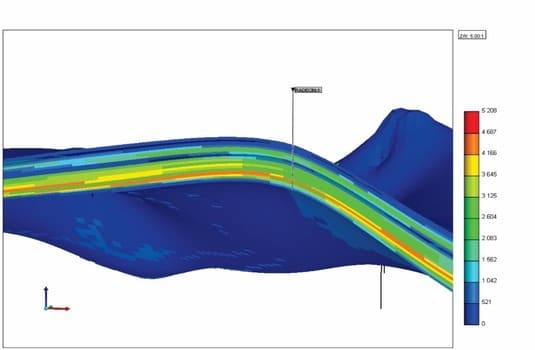
Figure 5: Cross sectional view of reservoir zone showing porosity on the Redecin1 well.
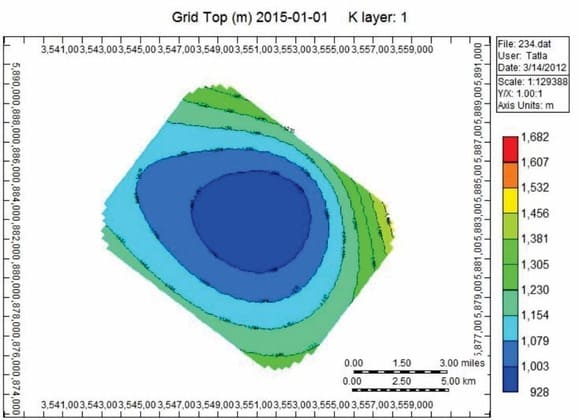
Figure 6: Cross sectional view of reservoir zone showing permeability by the help of color contrast.
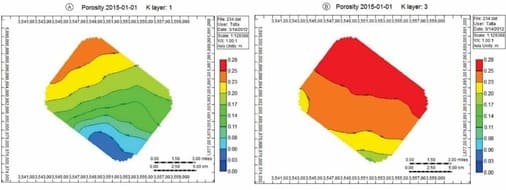
Figure 7: Grid top map of layer 1.
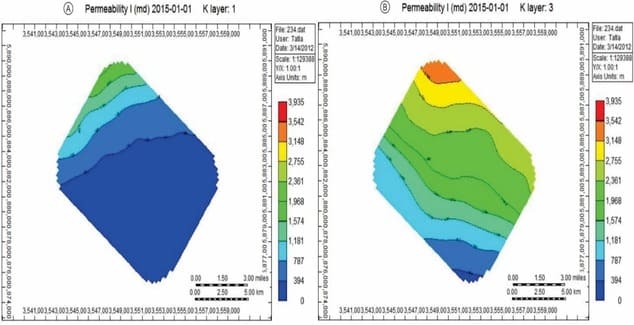
Figure 8: a, b) Comparison in porosity between layer 1 and 3.
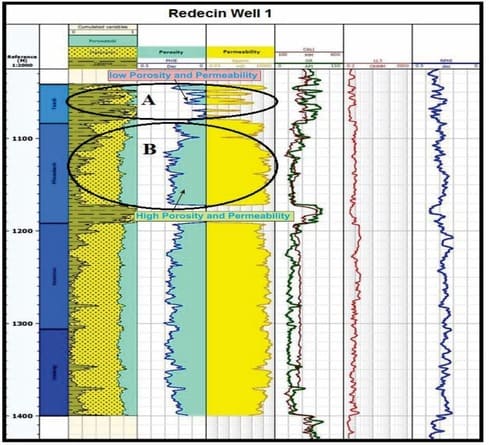
Figure 9: a, b) Comparison in permeability between layer 1 and 3.
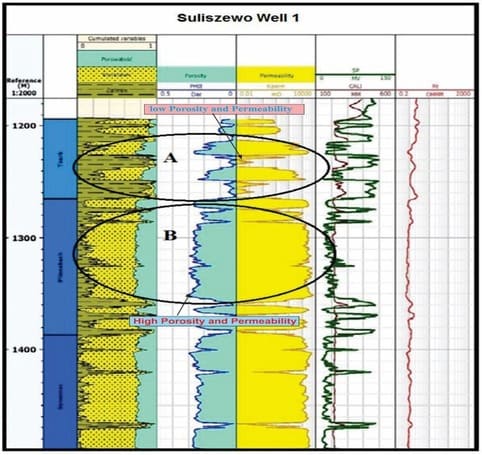
Figure 10: Well log of Radecin well while highlighted zone is showing porosity and Permeability.
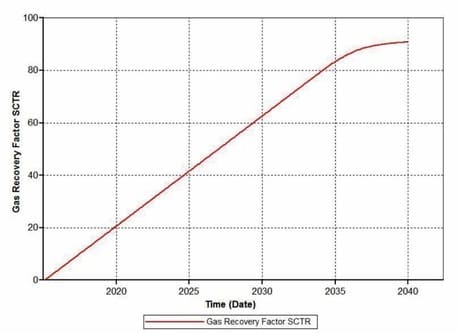
Figure 11: Well log of Suliszewo well-1, highlighted zone is showing porosity and Permeability.
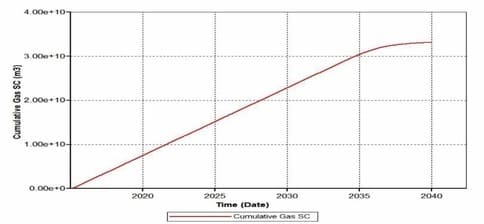
Figure 12: Estimated gas recovery factor in base case which shows 90% recovery till 2040.
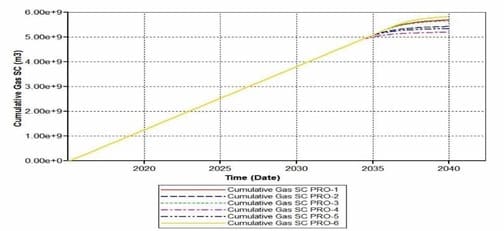
Figure 13: Cumulative gas production in base case till 2040.
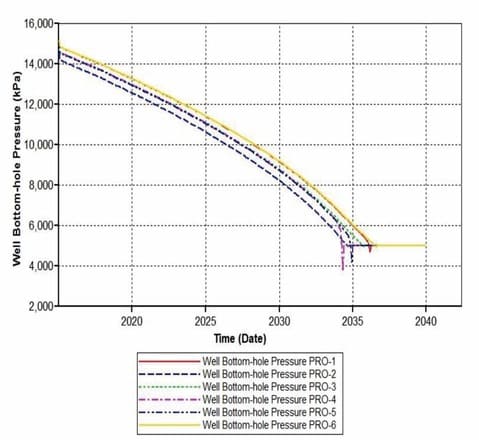
Figure 14: Cumulative gas productions from each well in base case till 2040.
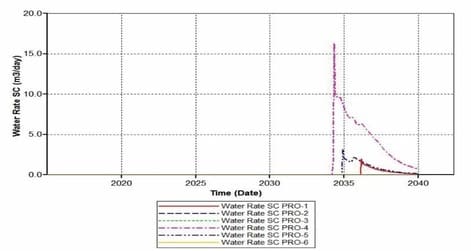
Figure 15: Bottom hole pressure in the conventional production case.
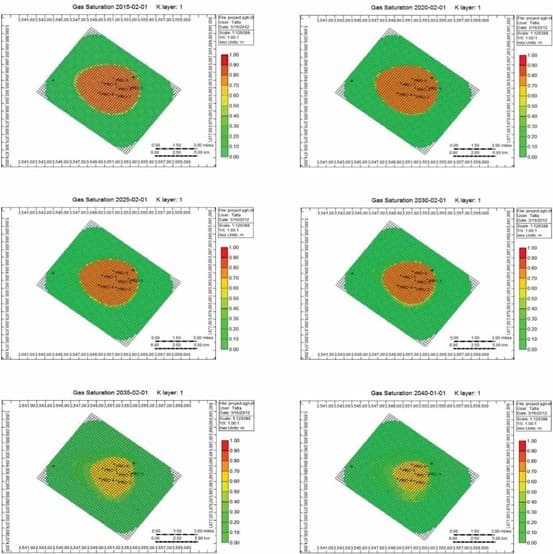
Figure 16: Water rate in the production case.
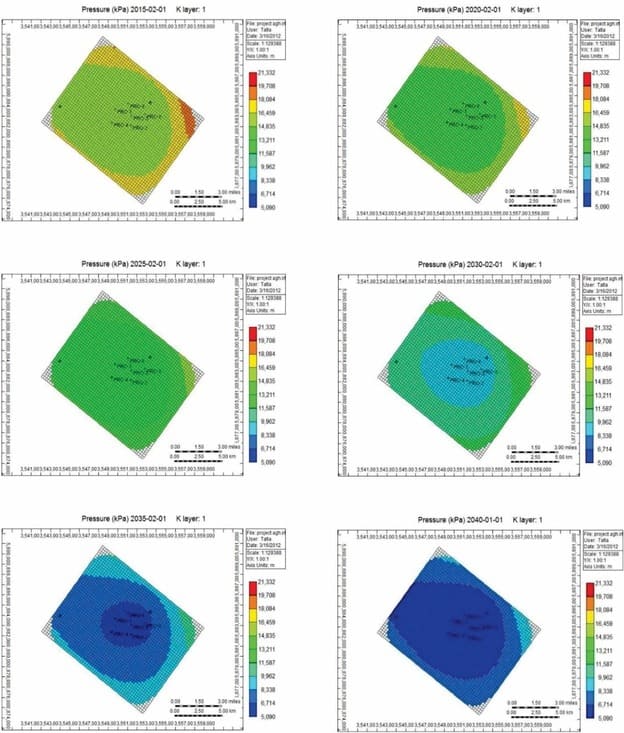
Figure 17: Lowering of gas saturation from the 1st layer of reservoir in the production case (on five years’ interval).
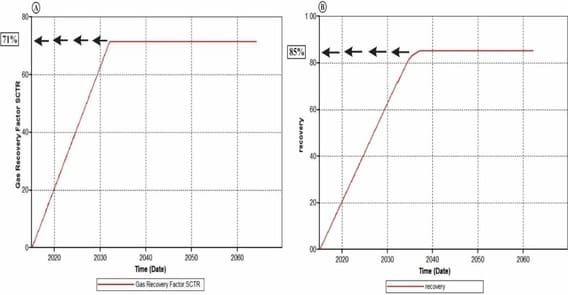
Figure 18: Lowering of pressure in 1st layer of reservoir during production of the gas (on five years’ interval).
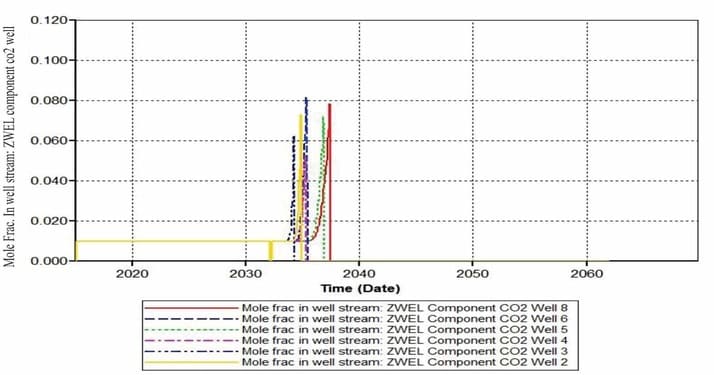
Figure 19: a, b) Comparison between Primary recovery and cumulative gas recovery including EGR by the injection of CO2.
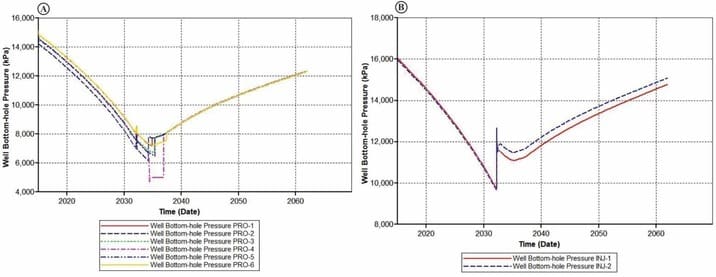
Figure 20: 5 to 7 % breakthrough obtained in produced gas.
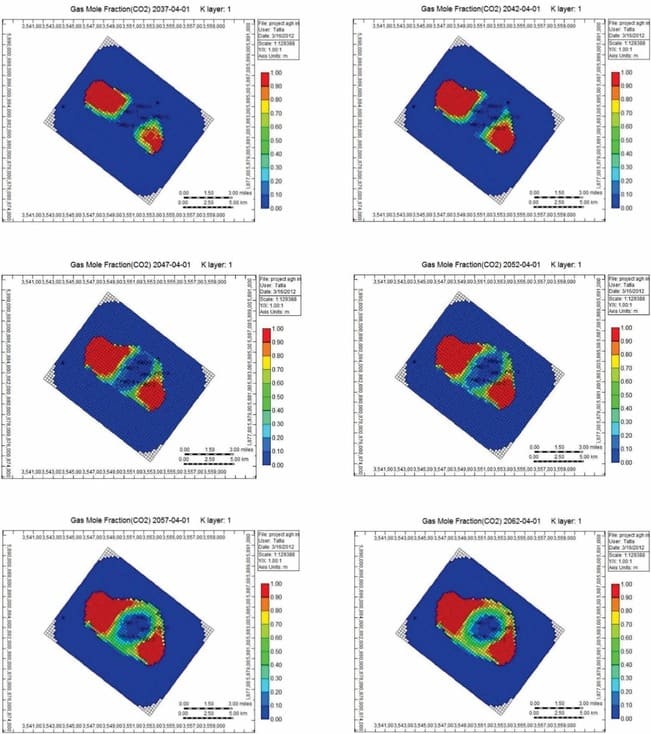
Figure 21: a, b) Comparing the risen up in BHP by injection of CO2 both in injection and production wells.
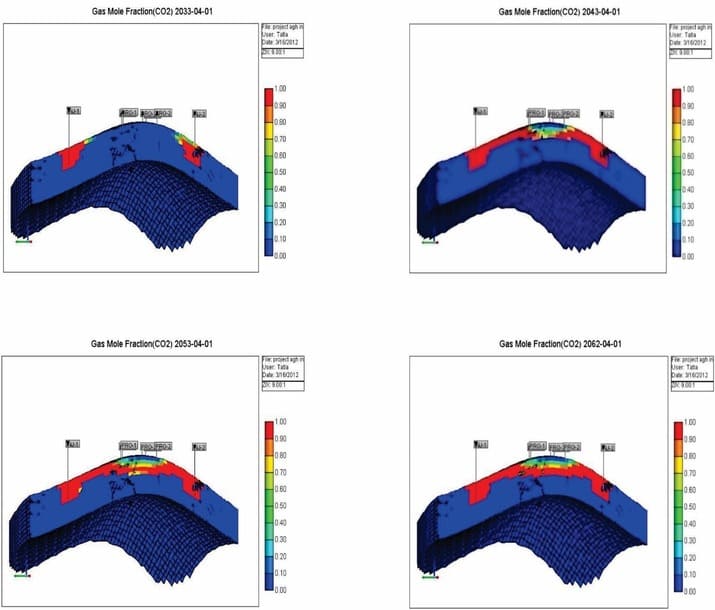
Figure 22: Horizontal view of injected CO2 saturation in the 1st layer (top of the structure).
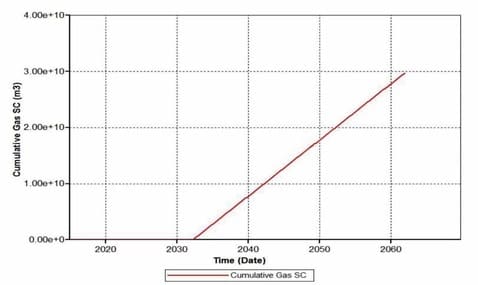
Figure 23: Cross sectional view through modeled structure CO2 saturation with the passage of time.
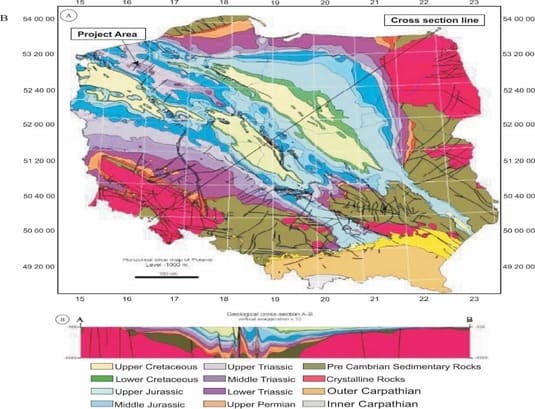
Figure 24: Cumulative CO2 injected in 30 years using two wells (total injection 60 Mt CO2), which starts from 2032 and ends on 2062.
|
Age |
Description of Lithology |
||
|
Early Jurassic |
Toarcian |
Upper |
Kamien Beds arenaceous terrestrial sediments with not much clayey interactions |
|
Lower |
Gryfice Beds brackish, silty-clayey deposits considerable quality of sandstone in the north |
||
|
Pliensbachian |
Domerian |
Komorowo Beds Mostly sandstone with alternation of clayey shaly beds and coal deposits |
|
|
Carixian |
Lobez Beds arenaceous deposits of terrestrial origin |
||
|
Sinemurian |
upper |
Radowo Beds |
|
|
Lower |
Upper Mechowo Beds terrestrial and marine arenaceous silty deposits |
||
|
hettangian |
upper |
Middle Mechowo Beds arenaceous deposits of terrestrial origin |
|
|
Lower |
Lower Mechowo Beds Silty Clayey Arenaceous deposits |
Table 1: Lithostratigraphic table of Western Poland; modified from Bukowy (1976) and Pienkowski (2004) [14,15].
|
Type of Production |
Time Domain |
Percentage |
|
Conventional Production |
01-02-2015 to 01-02-2032 |
71% |
|
EGR by co2 injection |
01-04-2032 to 01-02-2037 |
14.13% |
|
Total production |
01-02-2015 to 01-02-2037 |
85.13% |
Table 2: Tabular description of EGR and total production of natural gas in percentage.
|
Reservoir Properties |
||||
|
Grid top (m) (mini- Maxi) |
Porosity (%) |
Permeability (md) |
N/G Ratio Mini-Maxi-avg. |
Grid Thickness (M) |
|
928.4815-1651.781 |
21 |
1713 |
0.35-0.92-0.77 |
19.74 |
Table 3: Reservoir properties of the proposed model.
|
Serial |
Type of Well |
STG Valve |
BHP Valve |
Constraint |
|
1 |
Injectors INJ-1,INJ-2 |
1370000 M3/day |
15700 (max) Kpa |
Operator |
|
2 |
Injectors INJ-1,INJ-2 |
700000 M3/ day |
157oo (mini) Kpa |
Operator |
Table 4: Wells constraints and values.
|
Well Events |
Well Event Dates |
Duration |
|
Gas Production |
01-02-2015 to 01-02-2032 |
17 Years |
|
Shut in Period |
01-02-2032 to 01-04-2032 |
2 Months |
|
EGR by Co2 |
01-04-2032 to 01-02-2037 |
4 Years and 10 Months |
|
Co2 Injection and Storage |
Up to 01-04-2062 |
30 Years |
Table 5: Well events with dates and duration.
2. Tarkowski R, Uliasz-Misiak B (2005a) Carbon dioxide emission in Poland. In: Tarkowski R (ed.), Underground Storage of CO2 in Deep-Seated Geological Structures (Oil and Gas Reservoirs and Aquifers in Poland) (in Polish) 13-36 (Wyd. IGSMiE PAN, Cracow, Poland).
3. Tarkowski R, Uliasz-Misiak B (2005b) Conditions and criteria for underground CO2 storage. In: Tarkowski R (ed.), Underground Storage of CO2 in Deep-Seated Geological Structures (Oil and Gas Reservoirs and Aquifers in Poland) (in Polish) 37-53 (Wyd. IGSMiE PAN, Cracow, Poland).
4. Tarkowski R, Uliasz-Misiak B (2005c) Geological structures (aquifers and hydrocarbon reservoirs) suitable for underground CO2 storage in Poland. In: Tarkowski R (ed.), Underground Storage of CO2 in Deep-Seated Geological Structures (Oil and Gas Reservoirs and Aquifers in Poland) (in Polish) 69-111 (Wyd. IGSMiE PAN, Cracow, Poland).
5. IEA (1997) Carbon Dioxide Utilization. IEA Greenhouse Gas R&D Programme.
9. Geotechnologien GFZ (2012) Helmholtz Center Potsdam online.
10. Górecki W (2006) Atlas of geothermal resources of Mesozoic formations in the Polish Lowlands. Goldruk, Poland 484.
11. Computer Modelling Group Ltd (CMGL) Online (2012).
12. Sokolowski J (1987) Structural Atlas of Poland. Wydawnictwa Geologicze, Warsaw, Poland.
13. Malolepszy Z (2006) Three-dimensional geological model of Poland and its application to geothermal resource assessment. In: Russell HAJ, Berg RC, Thorleifson LH (eds.), Three-dimensional geological mapping for groundwater applications. Geological Survey of Canada 45-48.
14. Bukowy S (1976) Geology of Poland. Publication House Wydawnictwa Geologiczne, Warsaw.
17. Fekete online (2012) http://www.fekete.com/resources/papers/reservoir_engineering_geologists3_paper.pdf. Retrieved 13 March 2012.
© by the Authors & Gavin Publishers. This is an Open Access Journal Article Published Under Attribution-Share Alike CC BY-SA: Creative Commons Attribution-Share Alike 4.0 International License. Read More About Open Access Policy.