Deciphering the Impact of Compressive Trauma on Motor and Sensory Function: A Quantitative Analysis of Nerve Injury in A Rat Model
by Jibawi Rivera Rade2, Farid Amirouche1,2*
1Department of Orthopaedic Surgery, Affiliate of the University of Chicago Pritzker School of Medicine, USA
2Department of Orthopaedic Surgery, University of Illinois at Chicago, USA
*Corresponding author: Farid Amirouche, Vice Chairman, Basic Science Research Department of Orthopaedic Surgery, Orthopaedic & Spine Institute Endeavor Health (formerly NorthShore University Health System), Illinois, USA
Received Date: January 30, 2026
Accepted Date: February 10, 2026
Published Date: February 12,2026
Citation: Rade JR, Amirouche F (2026) Deciphering the Impact of Compressive Trauma on Motor and Sensory Function: A Quantitative Analysis of Nerve Injury in A Rat Model. J Neurol Exp Neural Sci 8: 170. https://doi.org/10.29011/2577-1442.100070
Abstract
Introduction: This study examines the effect of varying compression pressures on both motor and sensory functions using an in vivo rat model, chosen for its relevance to human neuropathies. Nerve Dysfunction varies widely across various previously published methods in evaluating an injured sciatic nerve. This investigation applies controlled compressive injuries with defined parameters to the sciatic nerves of male and female rats. Electrophysiological responses are recorded in real time, focusing on measurements such as the compound motor action potential (CMAP) and nerve conduction velocity (NCV). Through this approach, we quantitatively assess the effects of different compressive traumas at multiple time points: before, during, and after the injury. Methods: This study used eight female and 8 male Sprague Dawley rats. Modifying a small-animal blood pressure (BP) cuff devised a custom pneumatic compression tourniquet. Based on previous literature, four compression pressures-0, 120, 180, and 240 mmHg- were selected for practical exploration. Changes in CMAP amplitude (in mV) and NCV (in mm/msec) were noted. One-sample t-testing and one-way ANOVA were used. Results: We demonstrate incrementally progressive declines in motor-neuron competency of the rat sciatic nerve with the application of concomitantly increasing magnitudes of compressive trauma. Conduction of injury at a pressure of 240 mmHg is demonstrated to be the critical threshold value above which loss of motor function becomes statistically and clinically meaningful. Moreover, clinically relevant nerve injury was shown to occur only after 2 hours of continuous trauma. Discussion: The intricate relationships we have meticulously unraveled and quantitatively analyzed in this study pertain to factors influencing human peripheral nerves and are fundamentally linked to the most prevalent clinical neuropathies. This research promises to enhance our understanding of these complex conditions significantly and could lead to improved treatment strategies. As such, the implications of our findings are particularly profound, paving the way for advancements in the management of peripheral nerve disorders.
Keywords: Nerve compression; CMAP; Nerve conduction velocity; Nerve trauma; Neuropathy; Nerve injury; Motor neuron competency; Motor function
Introduction
Compression of a peripheral nerve can cause functional disorders ranging from mild paresthesia to complete sensory loss, and from slight motor weakness to total paralysis [1]. The severity of the nerve injury depends on several factors, with the level of trauma caused by the compressive injury being the most significant one. Neuropathy of the sciatic nerve is a crucial focus for exploring pain mechanisms, addressing the challenges of neuropathic pain (NP), and advancing axonal regeneration and remyelination [24]. Experimental models designed to simulate NP typically arise from various forms of peripheral trauma. These meticulously crafted models effectively replicate sensory disorders, leveraging peripheral neuropathy to elicit pain responses.
[5-7]. However, researchers must rely on indirect measures to gauge pain intensity since NP cannot be directly quantified in animal subjects. First-degree nerve injury is defined as a nerve conduction block with segmental demyelination8. With recovery, this class of nerve injury can recover function through remyelination. Second-degree nerve injury is defined as damage to the axon [8]. Electrophysiological studies show a decrease in amplitude due to this nerve damage [8,9]. However, the nerve can recover and regain function if the axon is damaged and limited scar tissue forms in the endometrium [8,9]. It is considered a third-degree injury. Unfortunately, full recovery is not possible in such cases. Nerve injuries are classified into five degrees based on the severity of damage. First and second-degree injuries are usually caused by acute nerve compression, while third -, fourth -, and fifth-degree injuries are associated with chronic nerve compression [8]. A third-degree injury is characterized by damage to the myelin sheath, while a fourth-degree injury results in extensive scar tissue formation with no possibility of recovery. Lastly, a fifth-degree injury is defined as a complete severance of the nerve [8]. Past research has indicated that electrophysiological analyses of sensory nerve action potentials and compound motor action potentials (CMAPs) are the most effective techniques for evaluating peripheral nerve dysfunction [5-12]. However, these methods and their outcome measures in assessing sciatic nerve dysfunction have been inconsistent and varied significantly in their reporting [3-13]. Therefore, it is difficult to accurately determine sciatic nerve function electrophysiologically across all NP experimental models. In the work by Hideroni et al. [14]. Their proposed electrophysiological analysis of CMAPs, SNAPs, and SCV in the sciatic nerve follows the clinical electrophysiological methods. This approach addresses a significant limitation in prior studies [10-13].
Gasser & Erlanger established that compression pressure produces a size-dependent conduction block order that may eventually lead to nerve injury. This relationship depends on three primary parameters involved in nerve conduction block and injury: the magnitude, duration, and location of the pressure. Denny-Brown and Schlapp conducted experiments using metal clips to compress rabbits’ sciatic nerves [15]. Their study found that applying slight pressure for two hours did not cause a notable decline in nerve conduction. In contrast, more considerable pressures applied for two hours resulted in paralysis that lasted up to 3 weeks [16]. Other parameters that determine susceptibility to injury include nerve diameter, conduction speed, and myelination. Specifically, it was observed that fast and larger-diameter myelinated axons are more vulnerable to conduction block than slower and smaller-diameter myelinated axons [16,17]. In previous studies, two significant consequences of compression nerve injuries have been identified. The first consequence is mechanical deformation, a well-studied manifestation of this type of injury. According to Fern and Harrison, nerve compression creates a pressure gradient between compressed and uncompressed nerve segments. This gradient causes improper shifting of axonal materials. Changes in fiber morphology also indicate mechanical deformation. The epineurium and perineurium surrounding the peripheral nerve and fascicles are thickened. Within the nerve structure, there is a movement of the nuclei to the periphery and an inappropriate scattering of Nissl substance [18]. Additionally, the nerve conduction block has been hypothesized to result from the displacement of the Node of Ranvier [19]. Causey and Palmer stated that early tissue deformation due to pressure applied to a nerve results in a decrease in the nerve’s cross-sectional area. This association is defined by the pressure magnitude being inversely proportional to the change in cross-sectional area. The change in cross-sectional area is primarily due to a decrease in the interstitial space. The mean fiber size was also decreased to a lesser extent [17]. Another significant consequence of nerve injury is the inappropriate regulation of intraneural blood flow. Mainly, the venous blood flow in the epineurium was found to be impaired. This impedes intracellular axonal transport. Impaired blood flow has been attributed to changes in the permeability of intraneural blood vessels. Consequently, this increases the intraneural interstitial fluid pressure, further impeding venous blood flow [20]. Studies examining the impact of compression pressure on nerve injuries have primarily used invasive techniques that directly compress the nerves. These techniques involve exposing an animal’s muscles and soft tissue, isolating the nerve, and applying pressure over the epineurium or myelin sheath. However, such nerve lesions do not provide clinical insight into how nerves respond to real-world injuries involving muscle, soft tissue, and skin. In the present study, we investigate whether variations in the magnitude of compressive trauma, produced by altering external compressive pressure in an in vivo rat model, result in clinically detectable differences in functional disruption. We directly assess functional loss using electrophysiological measures, including the compound motor action potential (CMAP) and nerve conduction velocity (NCV), before, during, and after the injury. Functional loss is compared across four tested compressive pressures as applied to the triceps surae region of both male and female rats.
Methods
This study used Sprague Dawley female (n = 8) and male rats (n = 8). These rats were acquired at 200-250 grams (Charles River Laboratories, Chicago, IL, United States) and acclimated to approximately 300-450 grams before use in experiments. All experimental procedures were approved by the University of Illinois at Chicago Institutional Care and Use Committee. A custom pneumatic compression cuff was devised by modifying a small-animal blood pressure cuff to a size of 2 cm × 12 cm. It was connected to a manual inflation bulb and an analog pressure gauge via a two-way valve system, allowing inflation of the cuff and maintenance of the experimental pressure. Four compression pressures-0, 120, 180, and 240 mmHg-were chosen for experimental exploration. The lower test pressure limit was used as the control, and the remaining pressures were assigned to the experimental groups. Anesthesia was maintained throughout the experiment using 3% isoflurane in oxygen. Induction was achieved in a chamber box with 0.8-1.5 L/min of concomitant oxygen. Maintenance anesthesia was administered via a mask connected to a Bain circuit, with a concomitant oxygen flow rate of 0.4 to 0.8 L/ min. To prevent heat loss, animals were kept draped over a waterrecirculating heating pad for the duration of the experiment until they recovered from anesthesia. The animal’s experimental limb was secured in full extension before wrapping the pneumatic cuff around the proximal aspect of the gastrocnemius muscle. CMAP recordings were obtained before cuff inflation and the start of the experiment (Figure 1).
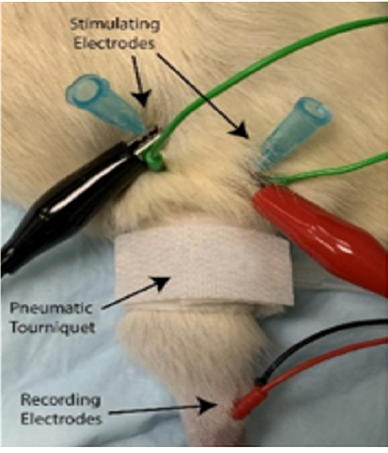
Figure 1: Rat hindlimb with pneumatic tourniquet and CMAP electrodes.
Continuous single-channel CMAP recordings were obtained by placing 32-gauge reading needle electrodes at four different locations: one recording electrode each at the muscle belly of the (electrode 1) lateral and (electrode 2) medial heads of the gastrocnemius, above the limb compression site, and (electrodes 3-4) two within the Achilles tendon, distal to the compression site. To stimulate the Sciatic nerve with an intermittent current pulse, two bipolar stimulating needle electrodes were inserted proximal to the compression site. To appropriately target the Sciatic nerve proximal to its trifurcation, palpation of the rat’s lateral femoral condyle was used as a horizontal and vertical landmark - stimulating electrodes were placed on either side of the hind leg with the distance between cathode and anode approximately ≥ 1 cm. CMAP recordings were captured using a PowerLab modular data-acquisition device, LabChart recording software, and a BioAmp (ADInstruments). Once recording started, the data were processed with a low-pass filter at 1 kHz, a high-pass filter at 1 Hz, and an active primary filter with a 3-second delay to eliminate 60 Hz interference, before being displayed in real time on the screen (Figure 2).
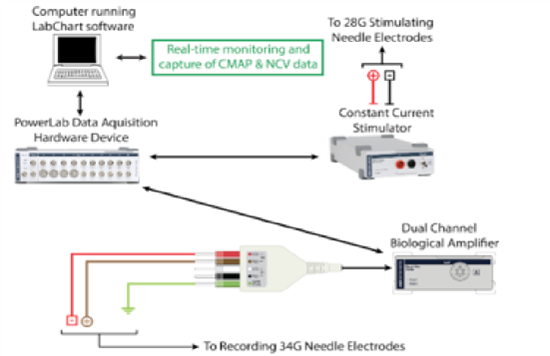
Figure 2: Schematic demonstrating hardware requirements for recording CMAP.
After complete anesthesia was reached, the experimental animal was positioned correctly and secured, and the pneumatic cuff was placed around the rat’s limb at the anticipated site of compression. Initially, the cuff was secured to the animal’s limb but was not yet pressurized. All electrodes were then placed in their proper positions. Only after real-time CMAP recordings were established and running continuously did the compression cuff pressure match the pressure being studied in the respective experiment. Changes in CMAP amplitude (in mV) before and after pressure application were noted. A baseline CMAP amplitude, measured within 5 minutes of cuff pressurization, was calculated as the average of 11 consecutive CMAP peaks. CMAP recordings were maintained continuously for a subsequent 180 minutes. During this time, limb compression pressure was maintained within +/- 5 mmHg. CMAP amplitudes were measured at 10-minute intervals throughout the experiment. Thus, with the baseline value, 18 additional experimentally captured amplitude values allowed us to trend changes in CMAP throughout the experiment.
The following mathematical expression ascertained NCV:
NCV (mm/msec) = ∆D stimulating-recording electrodes (mm) / ∆t (msec), where ∆D stimulating-recording electrodes represent the length measured in millimeters from a point equidistant to the stimulating cathode and anode to a point midway between the two most distal recording electrodes (within the Achilles tendon). ∆t represents the time in milliseconds when an action potential travels the distance ∆D, stimulating-recording electrodes, as determined on the x-axis of a CMAP recording using the Lab Chart software. After proper electrode placement, the distance between the stimulating and recording electrodes was measured with a tape measure, and baseline CMAP measurements were obtained (Table 1).
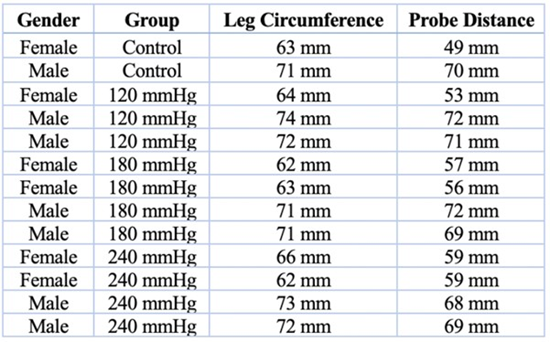
Table 1: Rat Leg Circumference and Probe Distance
All captured electrophysiological data, representing the duration before, during, and after limb compression in each experimental trial, were extracted from LabChart recording software (macOS, Version 8.1.17; AD-Instruments Inc.). Average CMAP amplitude values at each point of interest were determined as the average of 11 consecutively recorded CMAP peaks, with the point of interest set to the median, and 5 preceding and 5 subsequent peaks. The duration of compression was defined as the period from the baseline CMAP to the point at which pressure was maintained within ±5 mmHg of the target. Data analysis was performed using SPSS (IBM SPSS Statistics for macOS, Version 24.0; IBM Corp.), the Python programming language (version 3.10 for Windows, Python Software Foundation: https://www.python. org/), MATLAB (version R2022a for Windows; MathWorks, Inc.), and Excel (Microsoft Excel for macOS, Version 16.47; Microsoft Corp.).
Results
The baseline CMAP amplitude before initiating limb compression (>0 mmHg) was 71.2 ± 14.4 mV, 72.8 ± 4.5 mV, and 69.8 ±19.9 mV for all trials involving male and female rats, respectively. For all trials, the average CMAP amplitude decreased to 60.9 ± 14.5 mV after approximately 3 hours of limb compression, corresponding to a 14.5 ± 0.7% decrease from baseline. Stratified by gender, trials involving male rats decreased to an average amplitude of 58.6 ± 11.7 mV, and those involving female rats decreased to 62.9 ± 17.2 mV. These correspond to decreases of 19.5 ± 160.0% and 9.9 ± 13.6% from baseline, respectively.
0 mmHg Group (Control) | ||||
Time of Compression | CMAP Amplitude | Percent Change in Amplitude | t-statistic | p-value |
Baseline | 53.1 ± 33.7 mV | - | - | - |
After 1 hour | 51.2 ± 30.5 mV | -3.6 ± 9.5% | -0.087 | 0.945 |
After 2 hours | 49.8 ± 31.6 mV | -6.2 ± 6.2% | -0.149 | 0.906 |
After 3 hours | 52.3 ± 32.9 mV | -1.5 ± 2.4% | -0.036 | 0.977 |
Table 2: Summary of Data Points and Statistical Analysis Results for 0 mmHg (Control, N=2).
Two trials, 1 with a male and 1 with a female animal, were conducted at a limb compression pressure of 0 ± 2 mmHg. This was considered the control cohort, as the pneumatic cuff was applied gently to the animal’s limb, flush with the skin, but not inflated. The average baseline CMAP amplitude of the control group was 53.1 ± 33.7 mV. This decreased to 51.2 ± 30.5 mV after 1 hour of continuous cuff application, corresponding to a 3.6 ± 9.5% decrease (t-statistic = -0.087; p-value = 0.945). At the second hour of continuous cuff application, CMAP amplitude was 49.8 ± 31.6 mV, corresponding to a 6.2 ± 6.2% decrease from baseline (t-statistic = -0.149; p-value = 0.906). After 3 hours of compression, CMAP amplitude was 52.3 ± 32.9 mV, corresponding to a 1.5 ± 2.4% decrease from baseline (t-statistic = -0.036; p-value = 0.977) (Table 2).
|
120 mmHg Group |
||||
|
Time of Compression |
CMAP Amplitude |
Percent Change in Amplitude |
t-statistic |
p-value |
|
Baseline |
77.6 ± 3.4 mV |
- |
- |
- |
|
After 1 hour |
75.2 ± 4.0 mV |
-3.1 ± 17.7% |
-1.015 |
0.417 |
|
After 2 hours |
75.3 ± 5.1 mV |
-3.0 ± 50.0% |
-0.777 |
0.519 |
|
After 3 hours |
72.6 ± 5.0 mV |
-6.4 ± 47.1% |
-1.765 |
0.22 |
Table 3: Summary of Data Points and Statistical Analysis Results for 120 mmHg (N=3).
Three trials were performed with the pneumatic cuff applied to the animal’s limb and inflated to a compression pressure of 120 mmHg (Table 3): 2 trials with male rats and 1 with a female rat. The average baseline CMAP amplitude recorded immediately after inflation of the cuff (within <5 minutes from cuff application to the limb) was 77.6 ± 3.4 mV. After 1 hour of continuous limb compression, amplitude decreased to 75.2 ± 4.0 mV, corresponding to a 3.1 ± 17.7% decrease from baseline (t-statistic = -1.015; p-value = 0.417). At 2 and 3 hours of continuous compression, CMAP amplitude was found to be 75.3 ± 5.1 mV and 72.6 ± 5.0 mV, corresponding to decreases from baseline of 3.0 ± 50.0% (t-statistic = -0.777; p-value = 0.519) and 6.4 ± 47.1% (t-statistic = -1.765; p-value = 0.220), respectively.
|
180 mmHg Group |
||||
|
Time of Compression |
CMAP Amplitude |
Percent Change in Amplitude |
t-statistic |
p-value |
|
Baseline |
76.1 ± 11.8 mV |
- |
- |
- |
|
After 1 hour |
68.8 ± 10.9 mV |
-9.6 ± 7.6% |
-1.347 |
0.271 |
|
After 2 hours |
66.9 ± 9.2 mV |
-12.1 ± 22.0% |
-1.987 |
0.141 |
|
After 3 hours |
62.7 ± 11.1 mV |
-17.6 ± 5.9% |
-2.412 |
0.095 |
Table 4: Summary of Data Points and Statistical Analysis Results for 180 mmHg (N=4).
Four trials were performed at a compression pressure of 180 mmHg, with two trials per sex. The average baseline CMAP amplitude, recorded immediately after cuff inflation, was 76.1 ± 11.8 mV. At 1, 2, and 3 hours of continuous compression, CMAP amplitudes were 68.8 ± 10.9 mV, 66.9 ± 9.2 mV, and 62.7 ± 11.1 mV, respectively. This corresponded to decreases from baseline of 9.6 ± 7.6% (t-statistic = -1.347; p-value = 0.271), 12.1 ± 22.0% (t-statistic = -1.987; p-value = 0.141), and 17.6 ± 5.9% (t-statistic = -2.412; p-value = 0.095), respectively (Table 4).
|
240 mmHg Group |
||||
|
Time of Compression |
CMAP Amplitude |
Percent Change in Amplitude |
t-statistic |
p-value |
|
Baseline |
70.4 ± 4.0 mV |
- |
- |
- |
|
After 1 hour |
61.9 ± 6.7 mV |
-12.1 ± 67.5% |
-2.535 |
0.069 |
|
After 2 hours |
57.5 ± 9.4 mV |
-18.3 ± 135.0% |
-2.747 |
0.05 |
|
After 3 hours |
54.8 ± 10.1 mV |
-22.2 ± 152.5% |
-3.086 |
0.044 |
Table 5: Summary of Data Points and Statistical Analysis Results for 240 mmHg (N=4).
Four trials were performed at a compression pressure of 240 mmHg (Table 5), with two trials per sex. The average baseline CMAP amplitude, recorded immediately after cuff inflation, was 70.4 ± 4.0 mV. At 1, 2, and 3 hours of continuous compression, CMAP amplitude was 61.9 ± 6.7 mV, 57.5 ± 9.4 mV, and 54.8 ± 10.1 mV, respectively. This corresponded to decreases from baseline of 12.1 ± 67.5% (t-statistic = -2.535; p-value = 0.069), 18.3 ± 135.0% (t-statistic = -2.747; p-value = 0.051), and 22.2 ± 152.5% (t-statistic = -3.086; p-value = 0.044), respectively.
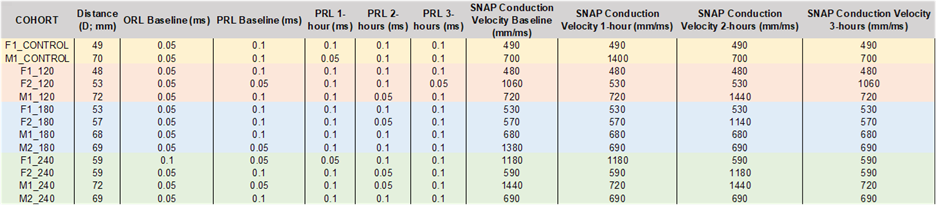
Table 6: Summary of Data Points and Statistical Analysis Results for NCV.
SNAP conduction velocity is measured by calculating the distance and time required for the action potential to propagate. SNAP conduction velocity is expressed in millimeters per second (mm/s). No final change was observed for the control and 120 mmHg cohorts, but alterations occurred at various intervals before returning to the baseline. In contrast, subjects within the 180 mmHg and 240 mmHg cohorts revealed alterations. One rat in the 180-mmHg cohort declined in conduction velocity from 1380 mm/ms to 690 mm/ms after three hours (t-statistic = -1.385; p-value = 0.591). Two rats in the 240-mmHg cohort showed a decline from 1180 mm/ms to 590 mm/ms (t-statistic = -1.092; p-value = 0.532) and from 1440 mm/ms to 720 mm/ms (t-statistic = -1.265; p-value = 0.492). Overall, any changes observed in either cohort were deemed insignificant (Table 6).
Discussion
In the present study, we employed a standardized approach to induce peripheral nerve injuries by applying circumferential compression pressure to the lower extremities of Sprague-Dawley rats. We defined trauma severity based on the magnitude of the force and its duration. The experiments consisted of four groups: 0 mmHg (control), 120 mmHg, 180 mmHg, and 240 mmHg. The durations for the control and experimental groups were 1, 2, and 3 hours of continuous compression [17]. The effects of graded compression were analyzed in situ and in real-time. The nerve conduction studies used CMAP and NCV to explore motor and sensory function. We demonstrate incremental declines in motor-neuron competency of the rat sciatic nerve with increasing magnitudes of compressive trauma. Although motor nerve function steadily decreases with increasing injury severity, no statistically significant declines are observed at compressive pressures of 0, 120, or 180 mmHg. In contrast, conduction of injury at a pressure of 240 mmHg is demonstrated to be the critical threshold value above which loss of motor function becomes statistically and clinically meaningful. Moreover, clinically relevant nerve injury was shown to occur only after 2 hours of continuous trauma (Figure 3). In previous studies, a discernible trend emerges, with the data showing considerable inconsistency. These studies predominantly focus on direct pressure injury, neglecting careful consideration of the diverse tissues and anatomical structures that exist between nerves and the external environment of the limbs.
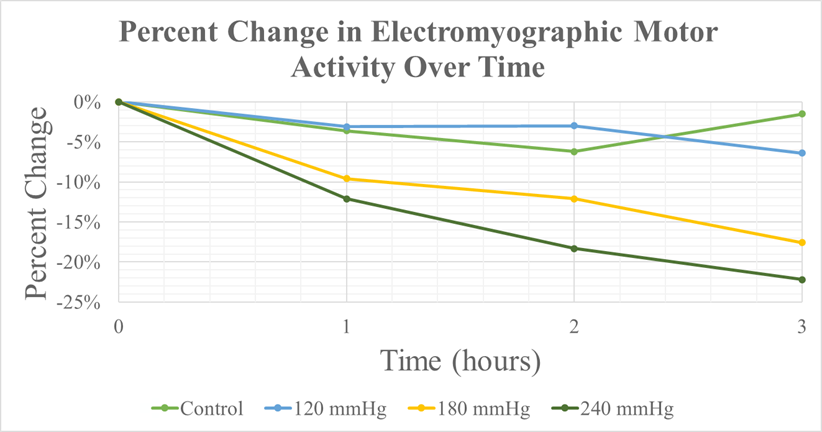
Figure 3: Percent Change on EMG v. Time.
Our study supports and extends previous research by establishing quantitative measures of nerve function decline due to compressive injury. Stecker et al. constructed a model in which they applied compressive pressures up to 2000 mmHg at 200-second intervals for up to 20 minutes. The CMAP amplitude reduction was approximately 50% from baseline at the highest pressures tested [21]. Therefore, a positive correlation is evident between higher pressure magnitudes and greater reductions in CMAP amplitudes. Our findings support this conclusion by demonstrating a reduction in CMAP amplitude with increasing pressure and longer continuous pressure durations (Table 7 and Figure 4). Unlike Stecker et al., our experiment did not lead to significant changes in NCV. The NCV fluctuation was minimal, with any decreases in velocity plateauing over the three-hour interval. This finding suggests that the nerve’s microenvironment is adaptable, enabling it to dynamically recalibrate and establish a new baseline in response to external compression and subsequent mechanical damage.
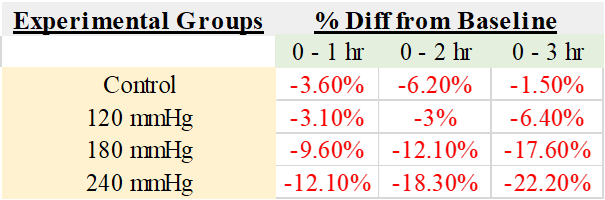
Table 7: Amplitude Percent Change from Baseline for Each Group after 1, 2, or 3 Hours of Compression.
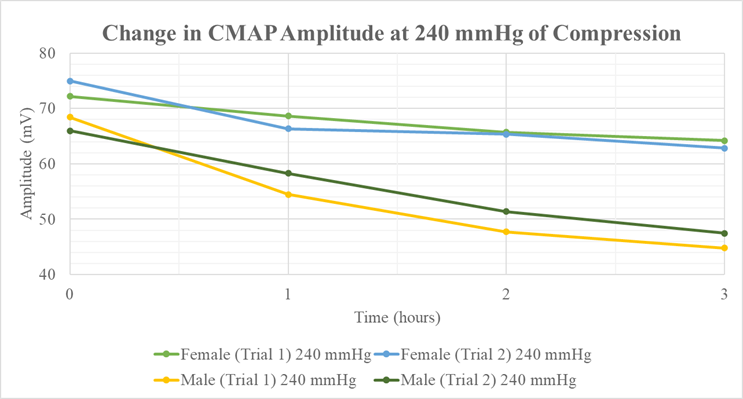
Figure 4: Amplitude Change v. Time for 240 mmHg.
Nerve conduction studies have been widely used clinically and in the research realm to characterize the functional state of a peripheral nerve. NCS uses a stimulating electrode to stimulate nerves electrically, and a recording electrode to record evoked action potentials from the muscle or nerve. Action potentials have an amplitude that represents the number of muscle fibers that are actively conducting an electrical impulse. These action potentials represent both motor and sensory functions [22]. Studied the effects of directly compressing a rabbit’s tibial nerve and observed changes in nerve function regarding conduction velocity and action potential amplitude. Although their experiments utilized the aforementioned conduction studies, they induced the compression injury using invasive techniques. The nerve was compressed in a compression chamber made of two symmetrical plexiglass halves. Both halves were placed around the nerve trunk and inflated by a specialized air-pressure system that inflated rubber cuffs within the chambers. 23Although this study examined the direct effect of compression on a nerve, it fails to account for all the components surrounding the nerve, such as connective tissue, muscles, and skin. The histological and pathophysiological findings of acute nerve compression have been well-established in previous studies. Two mechanisms have been hypothesized to explain the consequences of compression injuries. First, histology findings investigated by Fern & Harrison support the mechanical deformation mechanism. Compression creates a pressure gradient between the compressed and uncompressed nerve segments. This gradient disrupts the flow and transport of axonal materials. The compressed segments showed changes to the positioning of the nucleus with the diffusion of Nissl bodies [18]. Both these neuronal findings indicate an adaptation in the axonal state. Furthermore, their experiments found that the connective tissue of nerve structures thickened. The second mechanism explored is the change in blood flow within the neuron. Rydevik et al. established the differences in intraneural blood flow in response to different compression magnitudes. At 20 mmHg, epineural venous blood flow was reduced. At higher compression magnitudes of 30 mmHg and 80 mmHg, axonal material transport was obstructed, and intraneural blood flow was blocked, respectively [23]. They found that the structure of the compressed nerves’ myelin sheath changed. The myelin sheath was dissected and displaced from its natural anatomical position. Most studies examining the effects of compression injury have directly compressed a surgically exposed peripheral nerve [24]. Although these studies elucidated histological and physiological changes in response to compression injuries, the relative effects of external compression on motor and sensory impulse conduction remain unclear.
The blood-nerve barrier is the microenvironment between a nerve and its blood supply. This structural space is crucial for maintaining nerve tissue homeostasis by regulating the passage of micronutrients. Yayama et al. examined the consequences of barrier breakdown during ischemia. Failure of the blood-nerve barrier was observed after 20 minutes of ischemia [25-27]. Thus, intraneural edema ensues, which may lead to demyelination and a decline in nerve function. A mechanical injury, such as external compression, can damage this barrier. This study suggests that external compression in a rat model at pressures above 240 mmHg for more than 2 hours may cause irreversible ischemic damage and intraneural edema. Moreover, nerve conduction studies indirectly measure the integrity of the blood-nerve barrier. The relationships we elucidated and quantitatively characterized in this study between compression severity, trauma duration, and resulting loss of motor competence likely correspond to those that affect human peripheral nerves and give rise to the most commonly observed clinical neuropathies. Only by understanding the nature and magnitude of trauma required to produce neuromotor or sensory deficits can we begin to account for the severity of injury in clinical practice, potentially allowing the development of more nuanced and patient-specific therapies. Furthermore, these findings should be considered when applying a tourniquet. Nerves are inherently sensitive to mechanical strain and stretching, which may precipitate nerve injury. Protective measures, such as limb repositioning, careful tourniquet tightening, and padding, can help mitigate the risk of nerve injury. In our study, we conducted 16 compression trials, of which 13 were ultimately included in the final analysis, 6 involving male rats and 7 involving female rats. Three trials were excluded due to technical difficulties during realtime CMAP data capture. Another limitation of this study was the inability to assess recovery from the compression injury. Future research should conduct histological comparisons before and after the injury. Specifically, analyzing histological changes at 1-hour intervals over 3 hours could provide valuable insights into the recovery capabilities of peripheral nerves.
Conclusion
In conclusion, our study provides a comprehensive evaluation of the effects of varying compression pressures on motor and sensory function of the sciatic nerve in a rat model. The findings demonstrate that higher compression levels, particularly at 240 mmHg, result in significant declines in motor-neuron competency, underscoring the critical threshold for notable functional impairment. Additionally, our observations indicate that clinically relevant nerve injury does not occur until at least 2 hours of continuous pressure, underscoring the importance of both the magnitude and duration of compressive forces in nerve injury. The insights gained from this research not only enhance our understanding of the pathological mechanisms underlying peripheral nerve injuries but also underscore the importance of carefully considering compressive forces in clinical settings. The established relationships between compression levels, functional outcomes, and recovery potential provide a foundation for developing targeted therapeutic strategies for patients suffering from various neuropathies.
References
- Menorca RMG, Fussell TS, Elfar JC (2013) Nerve physiology: mechanisms of injury and recovery. Hand Clin 29(3): 317-330.
- Dyck PJ, Albers JW, Wolfe J, Bolton CF, Walsh N, et al. (2013) A trial of proficiency of nerve conduction: greater standardization still needed. Muscle Nerve 48(3): 369-374.
- Jolivalt CG, Frizzi KE, Guernsey L, Marquez A, Ochoa J, et al.(2016) Peripheral Neuropathy in Mouse Models of Diabetes. Curr Protoc Mouse Biol 6(3): 223-255.
- Guida F, De Gregorio D, Palazzo E, Ricciardi F, Boccella S, et al.(2020) Behavioral, Biochemical, and Electrophysiological Changes in Spared Nerve Injury Model of Neuropathic Pain. Int J Mol Sci 21(9): 3396.
- Decosterd I, Woolf CJ (2000) Spared nerve injury: an animal model of persistent peripheral neuropathic pain. Pain 87(2):149-158.
- Klein I, Lehmann HC (2021) Pathomechanisms of Paclitaxel-Induced Peripheral Neuropathy Toxics 9(10): 229.
- Hamad MN, Boroda N, Echenique DB, Dieter RA, Amirouche FML, et al.(2022) Compound Motor Action Potentials During a Modest Nerve Crush. Front Cell Neurosci 16: 798203.
- Mackinnon SE (2002) Pathophysiology of nerve compression. Hand Clin 18(2): 231-241.
- Watanabe M, Yamaga M, Kato T, Ide J, Kitamura T, Takagi K (2001) The implication of repeated versus continuous strain on nerve function in a rat forelimb model. J Hand Surg 26(4): 663-669.
- Hort-Legrand C, Lestrade R, Behar A (2001) Motor and sensory conduction velocities and amplitude of nerve or muscle potentials in the normal rat according to age. Acta Physiol Hung 88(3-4): 239-249.
- Walsh ME, Sloane LB, Fischer KE, Austad SN, Richardson A, Van Remmen H (2015) Use of Nerve Conduction Velocity to Assess Peripheral Nerve Health in Aging Mice. J Gerontol A Biol Sci Med Sci 70(11): 1312-1319.
- Fontanesi LB, Fazan FS, Dias FJ, Schiavoni MCL, Marques W, Fazan VPS (2019) Sensory and Motor Conduction Velocity in Spontaneously Hypertensive Rats: Sex and Aging Investigation. Front Syst Neurosci 13: 62.
- Smith AK, O’Hara CL, Stucky CL (2013). Mechanical sensitization of cutaneous sensory fibers in the spared nerve injury mouse model. Mol Pain 9: 61.
- Suzuki H, Funaba M, Ogi S, Matsumoto K, Nishida N, et al. (2025) Electrophysiological characteristics of a mouse neuropathic pain model and a technique to evaluate sciatic nerve damage. Heliyon 11(4): e42879.
- Gasser HS, Erlanger J (1929) The rôle of fiber size in the establishment of a nerve block by pressure or cocaine. Am J Physiol-Leg Content 88(4): 581-591.
- Denny-Brown D (1944) Lesion in peripheral nerve resulting from compression by spring clip. Arch Neurol Psychiatry 52(1): 1-19.
- Causey G, Palmer E (1949) The effect of pressure on nerve conduction and nerve-fibre size. J Physiol 109(1-2): 220-231.
- Fern R, Harrison PJ (1991) The effects of compression upon conduction in myelinated axons of the isolated frog sciatic nerve. J Physiol 432: 111-122.
- Dahlin LB, Shyu BC, Danielsen N, Andersson SA (1989) Effects of nerve compression or ischaemia on conduction properties of myelinated and non-myelinated nerve fibres. An experimental study in the rabbit common peroneal nerve. Acta Physiol Scand 136(1): 97105.
- Gelberman RH, Eaton RG, Urbaniak JR (1994) Peripheral nerve compression. Instr Course Lect 43: 31-53.
- Stecker MM, Baylor K, Chan YM (2008) Acute nerve compression and the compound muscle action potential. J Brachial Plex Peripher Nerve Inj 3:1.
- Navarro X (2016) Functional evaluation of peripheral nerve regeneration and target reinnervation in animal models: a critical overview. Eur J Neurosci 43(3): 271-286.
- Rydevik B, Nordborg C (1980) Changes in nerve function and nerve fibre structure induced by acute, graded compression. J Neurol Neurosurg Psychiatry 43(12):1070-1082.
- Dyck PJ, Lais AC, Giannini C, Engelstad JK (1990) Structural alterations of nerve during cuff compression. Proc Natl Acad Sci U S A 87(24): 9828-9832.
- Yayama T, Kobayashi S, Nakanishi Y, Uchida K, Kokubo Y, et al. (2010) Effects of graded mechanical compression of rabbit sciatic nerve on nerve blood flow and electrophysiological properties. J Clin Neurosci 17(4): 501-505.
- Lundborg G, Myers R, Powell H (1983) Nerve compression injury and increased endoneurial fluid pressure: a miniature compartment syndrome. J Neurol Neurosurg Psychiatry 46(12): 1119-1124.
- Kobayashi S, Meir A, Baba H, Uchida K, Hayakawa K (2005) Imaging of intraneural edema by using gadolinium-enhanced MR imaging: experimental compression injury. AJNR Am J Neuroradiol 26(4): 973980.
© by the Authors & Gavin Publishers. This is an Open Access Journal Article Published Under Attribution-Share Alike CC BY-SA: Creative Commons Attribution-Share Alike 4.0 International License. Read More About Open Access Policy.