Cross-sectional Study of Self-reported Physical Activity and BMI in Adolescents: The Role of Gender and Age
by Armend Myftiu*
Department of Physical Education, Sport and Health, Ss. Cyril and Methodius University, North Macedonia
*Corresponding author: Armend Myftiu, Department of Physical Education, Sport and Health, Ss. Cyril and Methodius University, North Macedonia.
Received Date: 21 September, 2025
Accepted Date: 29 September, 2025
Published Date: 02 October, 2025
Citation: Myftiu A (2025) Cross-sectional Study of Self-reported Physical Activity and BMI in Adolescents: The Role of Gender and Age. J Orthop Res Ther 10: 1402. DOI: https://doi.org/10.29011/2575-8241.001402
Abstract
This cross-sectional study examined the association between physical activity and body mass index (BMI) among 754 middle school students (39.5% female, 60.5% male; aged 15–18 years). Both BMI and physical activity were derived from self-reported data: weight and height were used to calculate BMI, while the frequency, duration and intensity of physical activity were assessed using the International Physical Activity Questionnaire (IPAQ). Logistic regression was applied to analyze the influence of activity, gender and grade on overweight status. Overall, 73.2% of students reported meeting the WHO guideline of ≥60 minutes of moderate-to-vigorous activity per day, while 26.8% did not. Clear gender- and grade-specific differences emerged: girls, particularly in the third and fourth grades, were disproportionately represented among those reporting less than 60 minutes of daily activity, whereas boys more frequently met the recommendations. The regression model was statistically significant (χ²(5) = 29.76, p < .001), explaining 3.9% (Cox & Snell R²) to 5.7% (Nagelkerke R²) of the variance. Gender and grade were significant predictors, while activity level was not (B = –0.10, p = .63, OR = 0.91, 95% CI [0.64, 1.29]). Boys had 38% lower probability of being overweight than girls (B = –0.48, p = .009, OR = 0.62, 95% CI [0.43, 0.89]). Compared with grade 4, overweight risk was significantly lower in grade 1 (OR = 0.33, p < .001), grade 2 (OR = 0.44, p = .001), and grade 3 (OR = 0.47, p = .001). These findings highlight gender- and age-related differences in activity and overweight. Preventive strategies should be specifically adapted for girls in higher grades.
Keywords: Moderate-to-vigorous physical activity; Weight status; Exercise behaviour; Sex differences; Survey-based data
Introduction
The fundamental characteristics of growth and healthy development during the subtle period of adolescence are influenced by various factors, both gender- and age-related. These factors can play decisive role in the preservation of an individual’s health; therefore, the establishment of healthy habits is considered a primary goal. In this context, continuous monitoring of the current health status and the development of strategies to prevent the risk of various non-communicable diseases associated with lifestyle and beyond play an important role [1-3]. Regular physical activity is a relevant factor for both physical and mental health during adolescence. It should not be seen solely as a factor influencing the balance between energy intake and consumption, but also as a fact or affecting health outcomes both during adolescence and later in adulthood. International guidelines recommend at least 60 minutes of moderate-to-vigorous physical activity per day for children and adolescents. This is considered sufficient to promote the reduction of obesity, increase fitness, and improve cardiometabolic health [4]. Improvements in health status and fitness in adolescents are significantly influenced by moderate- and vigorous-intensity physical performance, especially when it is also applied during leisure time [5]. Similarly, various cross-sectional studies consistently show significant inverse relationships between physical activity and obesity, indicating that insufficient engagement in physical activities may predispose young people to higher body fat [6].
When it comes to preschool children, it is suggested that efforts addressing pediatric obesity may be beneficial only by prioritizing high-intensity physical activity [7], as time spent sitting or engaging in low- to moderate-intensity physical activity does not show a significant association with obesity.
Alternatively, a review study [8] summarized nineteen investigations examining the relationship between physical activity intensity and body mass index (BMI). Of these studies, eleven showed that high-intensity physical activity was negatively correlated with body mass index, and this association was more pronounced in the relationships between high- or moderateintensity physical activity and BMI in both genders. Two of these studies demonstrated that high-intensity physical activity was more strongly associated with BMI only in boys, while moderateintensity physical activity emerged as a stronger predictor only in girls. Meanwhile, seven studies showed no significant relationship between physical activity and body mass index, regardless of the intensity of the activity.
These findings indicate that physical activity during adolescence is not necessarily associated with the body mass index, which is also reflected in the cross-sectional and longitudinal analyses [9] of a large Dutch research sample, where no relationship was found between the physical activity and body mass index.
Furthermore, a considerable number of longitudinal studies have also failed to demonstrate a consistent relationship between physical activity and subsequent BMI in adolescents. For example, it is reported that the intensity of physical activity in early adolescence was not associated with changes in obesity over four years [10]. Another research [11] found similar results in a Norwegian sample, in which moderate- to high-intensity physical activity showed no potential effects on BMI or body fat. It is also highlighted a reverse association [12,13], in which increased obesity leads to lower subsequent physical activity, but not vice versa. One more study [14] also reported inconsistent findings, in some cases even weak positive associations between physical activity and body fat, which argues against a clear effect. Meanwhile, research data from Norway indicate that physical activity measured with an accelerometer does not demonstrate predictive power for body mass index [15].
Overall, these results indicate that, although physical activity has multiple health benefits, its impact on body mass during adolescence may be limited or not clearly observable.Given the inconsistent findings regarding the impact of physical activity, an updated research review is needed to evaluate the relationship between physical activity and body mass index across different age groups and genders in adolescents. This research, therefore, aims to provide a database of self-reported information from which specific recommendations can be developed regarding the prevalence of overweight.
Methods
Sample
The study is based on a cross-sectional survey involving middle school students (n = 754) in Skopje, North Macedonia, from grades 1 to 4, aged 15 to 18 years, of both genders (39.5% female and 60.5% male). Students who were ill or unable to participate in physical education and sports classes were excluded from the survey. Participation in the study was voluntary and monitored by physical education teachers.
Procedure
The body mass index (BMI) was calculated based on students’ self-reported answers collected through a survey. When direct measurements are not possible, self-reported measures provide a reliable approximation across subsamples of class, gender, and ethnicity among adolescents [16].
BMI was calculated using the equation: weight (kg) / height (m)², and was standardized and categorized as follows: normal weight 18.5–24.9 and overweight above 25. Students’ physical activity was collected through the standardized International Physical Activity Questionnaire (IPAQ) [17]. Physical activity of moderate intensity (3–6 MET) and vigorous intensity (above 6 MET) was calculated. The minutes spent in vigorous intensity were multiplied by a factor of 2 and added to the minutes of moderate intensity, in order to provide a realistic overview of the total minutes spent in moderate-to-vigorous physical activity. Finally, the variable was categorized into two groups: (< 60 minutes and ≥ 60 minutes). Gender (f/m) and age groups (grades 1 to 4) were also taken into account in this study.
Statistical Analysis
For the statistical analysis of the data, the standard descriptive method was used to reflect the characteristics of body mass index (BMI) and daily physical activity in general, as well as separated by gender and age groups (grades 1 to 4). To examine the likelihood of the effect of physical activity on the body mass index, analyzed according to age groups and gender, logistic regression was calculated. A significance level of p < .05 was considered statistically significant in the study. Data processing was carried out using the statistical software SPSS (version 25).
Results
The analyses are presented in the figures showing the level of physical activity among high school students, differentiated by gender, age groups and body mass index (BMI). Overall, 73.2% of the students met the recommendation for physical activity—at least 60 minutes of moderate to vigorous intensity—while 26.8% did not.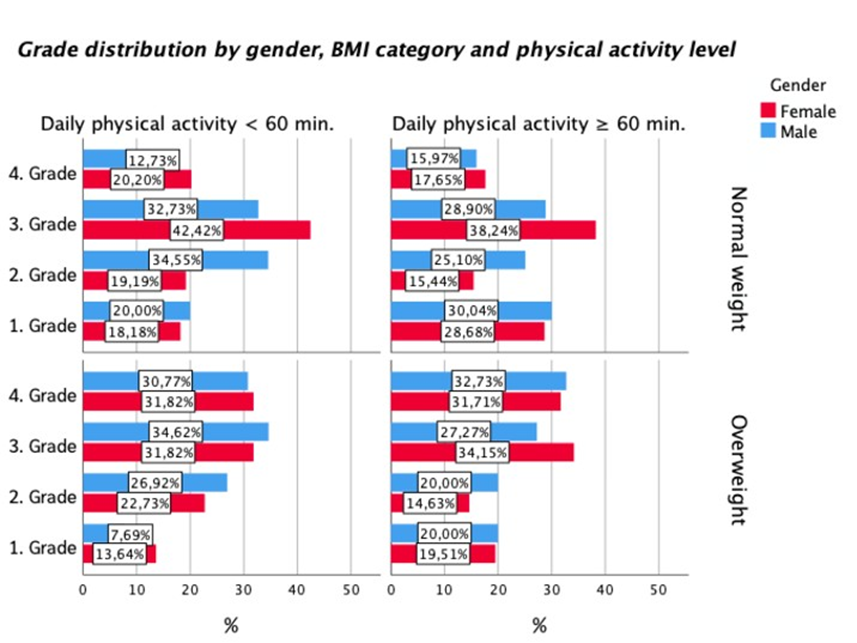 Figure 1: Distribution accros school grades (1 – 4) within gender, BMI categories and physical activity levels.
Figure 1 shows how the school grades (1–4) are distributed within each panel, defined by a combination of BMI category, physical activity level and grade.
Normal weight (< 60 min daily activity)
Girls: The distribution shows relevant inactivity across all grades. The highest proportion occurs in grade 3 (42.42%), followed by grade 4 (20.20%) and grade 2 (19.19%). Grade 1 shows the lowest proportion (18.18%).
Boys: Here as well, the highest proportion is observed in grade 2 (34.55%) and grade 3 (32.73%). Lower values are found in grade 1 (20.00%), while grade 4 shows the lowest proportion (12.73%).
Normal weight (≥ 60 min daily activity)
Girls: More active children are distributed relatively evenly across grades. The highest proportion is found in grade 3 (38.24%), followed by grade 1 (28.68%). Lower proportions occur in grade 4 (17.65%) and grade 2 (15.44%).
Boys: The largest proportion is observed in grade 1 (30.04%), followed by grade 3 (28.90%). Lower values are seen in grade 2 (25.10%) and grade 4 (15.97%).
Overweight (< 60 min daily activity)
Girls: Inactivity is particularly pronounced in grade 4 and grade 3 (31.82%). Lower proportions are observed in grade 2 (22.73%) and especially grade 1 (13.64%).
Boys: The highest proportion is found in grade 3 (34.62%), followed by grade 4 (30.77%) and grade 2 (26.92%). Grade 1 shows the lowest proportion (7.69%).
Overweight (≥ 60 min daily activity)
Girls: The highest activity levels are observed in grade 3 (34.15%) and grade 4 (31.71%). Lower values occur in grade 1 (19.51%) and grade 2 (14.63%).
Boys: The highest proportion is observed in grade 4 (32.73%), followed by grade 3 (27.27%). Grade 2 and grade 1 (20.00%) show lower but similar values.
A key finding is the distinct role of grade 3. Among both normal-weight and overweight children, relatively high proportions are found in grade 3 across several panels. In the <60-minute groups, grade 3 shows particularly high shares (e.g., normal-weight girls 42.42%, overweight boys 34.62%). At the same time, grade 3 also exhibits high proportions in the ≥60-minute groups (normal-weight girls 38.24%, overweight girls 34.15%). This pattern suggests a certain polarization within this grade, with a comparatively large number of children being either relatively inactive or clearly active.
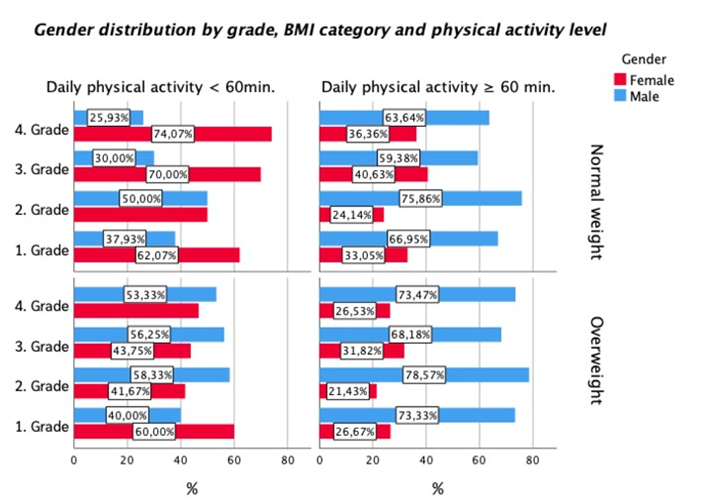
Figure 2: Gender Dusrtibution within grades by BMI and activity level (<60vs≥60min/day).
Figure 2 shows the distribution of boys and girls within each panel, defined by a combination of grade (1–4), BMI category, and daily physical activity with moderate to vigorous intensity (<60 min vs ≥60 min).
Among normal-weight children who engage in less than 60 minutes of daily activity, girls are strongly overrepresented in the higher grades: in 4th grade, 74.07% are female and 25.93% male, and in 3rd grade 70.00% are female and 30.00% male, while in 2nd grade the distribution is balanced at 50.00% each. In 1st grade, girls are also more represented in the inactive group, with 62.07% girls and 37.93% boys.
Conversely, among normal-weight children achieving 60 minutes or more of daily activity, boys clearly dominate across all grades: 63.64% boys vs 36.36% girls in 4th grade, 59.38% vs 40.63% in 3rd grade, 75.86% vs 24.14% in 2nd grade, and 66.95% vs 33.05% in 1st grade.
Among overweight children with less than 60 minutes of daily activity, boys slightly outnumber girls in 4th, 3rd, and 2nd grades, with 53.33% vs 46.67%, 56.25% vs 43.75%, and 58.33% vs 41.67%, respectively, whereas in 1st grade girls are more represented with 60.00% vs 40.00% boys.
For overweight children achieving 60 minutes or more of daily activity, boys strongly dominate across all grades: 73.47% vs 26.53% in 4th grade, 68.18% vs 31.82% in 3rd grade, 78.57% vs
21.43% in 2nd grade, and 73.33% vs 26.67% in 1st grade.
The largest gender difference is observed in 2nd grade, where 78.57% are boys and 21.43% are girls, representing the most pronounced imbalance among the grades.
These results highlight a consistent pattern of higher activity levels among boys, while girls are more strongly represented among less active normal-weight children, particularly in the higher grades.
Predictor | Reference | B | SE | Wald | DF | P | EXP(B) |
Gender | Female | -0.48 | 0.19 | 6.79 | 1 | .009** | 0.62 |
Grade 1 | Grade 4 | -1.10 | 0.25 | 19.15 | 1 | <.001*** | 0.33 |
Grade 2 | Grade 4 | -0.82 | 0.25 | 11.02 | 1 | .001** | 0.44 |
Grade 3 | Grade 4 | -0.75 | 0.22 | 11.41 | 1 | .001** | 0.47 |
Physical Activity | ≥ 60 min | -0.10 | 0.20 | 0.23 | 1 | .634 | 0.91 |
Model Fit: χ²(5) = 29.76, p < .001; -2 Log-Likelihood = 839.31; Cox & Snell R² = .04; Nagelkerke R² = .057. Classification Accuracy: 73.5% overall (Normal Weight =100%, Overweight = 0%) Significance levels: p < .01, **p < .001 | |||||||
Table1: Logistic regression predicting BMI categiry (normal weight vs over weight ) from gender, grade levels, and phisical acticity.
A binary logistic regression was conducted to examine the association of gender, grade and physical activity with standardized BMI (dependent variable: standardized BMI; classified as normal weight [≤1] vs. overweight [>1]). The overall model was statistically significant, χ² (5) = 29.76, p < .001, indicating improvement over the null model, and explained 3.9% (Cox & Snell R²) to 5.7% (Nagelkerke R²) of the variance in BMI category. The Hosmer-Lemeshow test suggested good model fit, χ² (7) = 1.24, p = .99.
Regarding individual predictors, gender and grade were significant, while physical activity did not contribute significantly. Boys were less likely than girls to be overweight (B = –0.48, SE = 0.19, Wald = 6.79, p = .009, OR = 0.62, 95% CI [0.43, 0.89]), indicating 38% lower odds of overweight. Compared to 4th grade (reference), children in 1st grade had 66% lower odds of overweight (B = –1.10, p < .001, OR = 0.33, 95% CI [0.20, 0.55]), in 2nd grade 56% lower (B = –0.82, p = .001, OR = 0.44, 95% CI [0.27, 0.72]), and in 3rd grade 53% lower (B = –0.75, p = .001, OR = 0.47, 95% CI [0.31, 0.73]). Physical activity category (meeting ≥60 min/ day) was not a significant predictor of overweight (B = –0.10, p = .63, OR = 0.91, 95% CI [0.64, 1.29]). The logistic regression indicates that both gender and grade are important characteristics associated with overweight in high school children. Girls have a higher likelihood of being overweight than boys, and the risk of overweight increases significantly with higher grade levels.
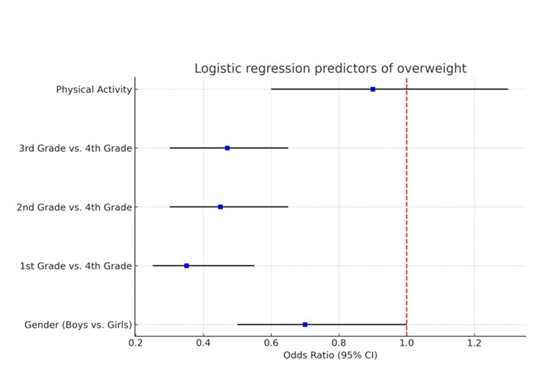
Figure 3: Relative risk estimates for factors association with overweight.
The results of the logistic regression analysis are illustrated in Figure 3. Displayed are the odds ratios and 95% confidence intervals for each predictor in the model. The dashed line at an odds ratio of 1 serves as a reference for no effect. This allows for a direct comparison of the relative differences in overweight risk between groups.
Discussion
The results of this study show that gender-specific differences in physical activity behavior are already pronounced in high school students and become more distinct with increasing the age. In particular, girls in grades 3 and 4 are disproportionately represented in the group with less than 60 minutes of daily moderate-to-vigorous physical activity. These findings are consistent with international studies that also document gender-specific differences in physical activity behavior among schoolchildren. A distinct study [18], which included more than 200,000 children and adolescents from Latin America, found that boys were more likely than girls to meet the recommended 60 minutes of moderate-to-vigorous physical activity per day. Similar results were reported in another study [19], which analyzed gender differences in children’s physical activity. Surprisingly, overweight boys in this study often met the recommendation of at least 60 minutes of daily activity, indicating that BMI alone is not a reliable indicator of activity level. A recent study [20] also found that, on average, overweight children were even more likely than their normal-weight peers to meet the WHO recommendation of at least 60 minutes of moderate-to-vigorous physical activity per day. Based on the objectively collected data of this study, the authors reported that 37% of overweight children and only 27% of normal-weight children met the physical activity recommendation. The difference in activity levels between overweight and normal-weight children was not statistically significant (p = 0.13). Such gender-specific disparities suggest that the promotion of physical activity should be planned not only according to body mass but also differentiated by gender. These findings are in line with the observation that, in the present sample, overweight children are not less active than their normal-weight peers. On the contrary, they may even be more active.
Conclusion
The results of this study are significant in this context, indicating that physical activity showed no statistically significant effect on BMI, whereas gender and age group revealed clear differences. This supports the assumption that body mass in adolescence may be more strongly influenced by biological and developmental factors than by participation in physical activity alone. This by no means implies that physical activity loses its importance; rather, it suggests that its positive effects may manifest in other health-related domains, such as cardiovascular fitness, metabolic parameters, or psychological well-being, without necessarily being reflected in BMI. Therefore, the promotion of physical activity should remain a central goal of preventive health measures, regardless of whether immediate measurable changes in body weight are observed. This review highlights the need for long-term observational and intervention studies to better understand the health effects of physical activity, including its impact on BMI, in adolescents of different ages and genders.
Study Limitations
The use of questionnaires for data collection may be limited by the students’ ability to recall information. In addition, the selfreported assessment of physical activity intensity may have been ambiguous in some cases. Differences in the age of students within the same grades, although not large, may also have influenced the evaluation of other parameters related to physical activity.
Acknowledgements
I would like to thank all participants for their valuable contribution to this study. I also wish to acknowledge the positive feedback and support received throughout the publication process.
References
- Bélanger M, Sabiston C M, Barnett T A, Loughlin E O, Ward S, et al. (2015) Number of years of participation in some, but not all, types of physical activity during adolescence predicts level of physical activity in adulthood: Results from a 13-year study. International Journal of Behavioral Nutrition and Physical Activity 12(1): 76.
- Swinburn B A, Kraak V I, Allender S, Atkins V J, Baker P I, et al. (2019) The global syndemic of obesity, undernutrition, and climate change: The Lancet Commission report. The Lancet 393(10173): 791-846.
- World Health Organization (2020) Adolescent health and development.
- Katzmarzyk PT, Barreira TV, Broyles ST, Champagne CM, Chaput JP, et al. (2015) Physical activity, sedentary time, and obesity in an international sample of children. Medicine & Science in Sports & Exercise 47(10): 20622069.
- Júdice PB, Silva AM, BerriaJ, Petroski EL, Ekelund U, et al. (2017) Sedentary patterns, physical activity and health-related physical fitness in youth: a crosssectional study. International Journal of Behavioral Nutrition and Physical Activity 14(1): 25.
- Ekelund U, Hildebrand M, Collings P J (2014) Physical activity, sedentary time and adiposity during the first two decades of life. Proceedings of the Nutrition Society 73(2): 319-329.
- Collings P J, Brage S, Ridgway CL, Harvey NC, Godfrey KM, et al. (2013) Physical activity intensity, sedentary time, and body composition in preschoolers. The American Journal of Clinical Nutrition 97(5): 1020-1028.
- Gralla MH, McDonald SM, Breneman C, Beets MW, Moore JB (2019) Associations of objectively measured vigorous physical activity with body composition, cardiorespiratory fitness, and cardiometabolic health in youth: a review. American Journal of Lifestyle Medicine 13(1): 61-97.
- Huppertz C, Bartels M, Van Beijsterveldt CEM, Willemsen G, Hudziak JJ, et al. (2015) Regular exercise behaviour in youth is not related to current body mass index or body mass index at 7-year follow-up. Obesity science & practice 1(1): 1–11.
- Van Sluijs EM, Sharp SJ, Ambrosini GL, Cassidy A, Griffin SJ, et al. (2016) The independent prospective associations of activity intensity and dietary energy density with adiposity in young adolescents. British Journal of Nutrition 115(5): 921–929.
- Aars NA, Beldo S, Jacobsen BK, Horsch A, Morseth B, et al. (2020) Association between objectively measured physical activity and longitudinal changes in body composition in adolescents: the Tromsø study fit futures cohort. BMJ open 10(10): e036991.
- Metcalf BS, Hosking J, Jeffery AN, Voss LD, Henley, et al. (2011) Fatness leads to inactivity, but inactivity does not lead to fatness: a longitudinal study in children (EarlyBird 45). Archives of disease in childhood 96(10): 942-947.
- Hjorth MF, Chaput JP, Ritz C, Dalskov SM, Andersen R, et al. (2014) Fatness predicts decreased physical activity and increased sedentary time, but not vice versa: support from a longitudinal study in 8-to 11-year-old children. Int J obes (Lond) 38(7): 959-65.
- Collings PJ, Wijndaele K, Corder K, Westgate K, Ridgway CL, et al. (2016) Objectively measured physical activity and longitudinal changes in adolescent body fatness: an observational cohort study. Pediatric obesity 11(2): 107-114.
- Dalene KE, Anderssen SA, Andersen LB, Steene-Johannessen J, Ekelund U, et al. (2017) Cross-sectional and prospective associations between physical activity, body mass index and waist circumference in children and adolescents. Obesity science & practice 3(3): 249–257.
- Pérez A, Gabriel K, Nehme EK, Mandell DJ, Hoelscher DM (2015) Measuring the bias, precision, accuracy, and validity of self-reported height and weight in assessing overweight and obesity status among adolescents using a surveillance system. The Int J Behav Nutr Phys Act 12(Suppl 1).
- Craig CL, Marshall AL, Sjöström M, Bauman AE, Booth ML, et al. (2003) International physical activity questionnaire: 12-country reliability and validity. Medicine & science in sports & exercise 35(8): 1381-1395.
- Brazo-Sayavera J, Aubert S, Barnes JD, González SA, Tremblay MS (2021) Gender differences in physical activity and sedentary behavior: Results from over 200,000 Latin-American children and adolescents. PloS one 16(8): e0255353.
- Kretschmer L, Salali GD, Andersen LB, Hallal PC, Northstone K, et al. (2023) Gender differences in the distribution of children’s physical activity: evidence from nine countries. International Journal of Behavioral Nutrition and Physical Activity 20(1): 103.
- Leeuwen JV, Koes BW, Paulis WD, Bindels PJ, Middelkoop MV, et al. (2020) No differences in physical activity between children with overweight and children of normal-weight. BMC Pediatrics 20(1): 431.
© by the Authors & Gavin Publishers. This is an Open Access Journal Article Published Under Attribution-Share Alike CC BY-SA: Creative Commons Attribution-Share Alike 4.0 International License. Read More About Open Access Policy.