Comparison of Early Results Between Bone-Conserving and Conventional High-Flexion Posterior-Stabilized Total Knee Arthroplasty
by Young-Hoo Kim1*, Jang-Won Park2, Young-Soo Jang1, and Eun-Jung Kim1
1The Joint Replacement Center of Seoul Metropolitan Government, SeoNam Hospital, Republic of Korea
2Department of Orthopedic Surgery, Ewha Womans University, Seoul Hospital, Republic of Korea
*Corresponding author: Young-Hoo Kim, The Joint Replacement Center, Seoul Metropolitan Government SeoNam Hospital, 20, Shinjoung ipen1ro, Yangchun-Gu, Seoul, Republic of Korea.
Received Date: 26 Septemeber, 2024
Accepted Date: 04 October, 2024
Published Date: 09October, 2024
Citation: Kim YH, Park JW, Jang YS, Kim EJ (2024) Comparison of Early Results between Bone-Conserving and Conventional High-Flexion Posterior-Stabilized Total Knee Arthroplasty. J Orthop Res Ther 9: 1363. https://doi.org/10.29011/2575-8241.001363
Abstract
Background: The purpose of this study was to compare early clinical and radiographic results between bone-conserving and conventional high-flexion posterior-stabilized TKA. Methods: Two hundred and eighty-five patients (477 knees; mean age, 68.7 years) received a NexGen Legacy posterior-stabilized high-flex (NexGen LPS-Flex) TKA and 280 patients (472 knees; mean age, 70.1 years) received a Freedom posterior-stabilized prosthesis. The mean follow-up was 3.5 (range, 2 to 5 years) for each group. Results: Significantly less bone was resected from the distal femur (mean, 8.7 vs 7.8 mm), the posterior femoral condyles (mean, 11.5 vs 5.7 mm), and the intercondylar notch (mean, 11 vs 8.1 cm3) in the Freedom TKA group compared with the NexGen LPS-Flex TKA group. There were no significant differences between the 2 groups at the latest follow-up regarding the Knee Society score (91 vs 93 points), the Western Ontario and McMaster Universities Osteoarthritis index (40 vs 38 points), knee range of motion (125 vs 128°), the University of California, Los Angeles activity score (6.0 vs 6.2 points), and radiographic findings. The estimated survival rate was 99% (95% confidence interval, 92% to 100%) for the NexGen LPS-Flex TKA group and 99.6% (95% confidence interval, 93% to 100%) for the Freedom TKA group, with revision or aseptic loosening as the endpoint at 3.5 years after the operation. Conclusion: The present study suggests that the early clinical and radiographic results of the bone-conserving Freedom TKA were similar to those of the conventional NexGen LPS-Flex TKA.
Keywords: Bone conservation; Conventional; High-flexion; Posterior-stabilized; Total knee arthroplasty
Introduction
Besides pain relief, achieving appropriate range of motion after total knee arthroplasty (TKA) is an important component of a patient’s overall functional outcome [1]. However, patients rarely flex their knees beyond 120° following TKA [1-4]. Thus, the NexGen LPS-Flex total knee system (Zimmer, Warsaw, IN, USA) was introduced to enhance knee flexion beyond 120° after TKA. The NexGen LPS-Flex system includes a 2-mm extension of the posterior condyle of the femoral component that replaces an extra 2 mm of bone that is removed from the posterior femoral condyles; this approach increases posterior femoral translation and the range of flexion.
The Freedom Total Knee System (MAXX Orthopedics, Inc., Norristown, PA, USA) was introduced to conserve bone while achieving a condylar profile that allows for high knee flexion. The Freedom knee system was designed to enhance knee flexion by accommodating changes in the femoral condylar radii of curvature based on the degree of flexion change and the amount of rollback needed through knee range of motion while minimizing bone resection from the posterior femoral condyles [5].
Several authors [6-8] reported that the high-flexion knee prosthesis had a higher risk of loosening at high flexion angles. The motivation of this study was to compare the results of the NexGen LPSFlex TKA (removal of the extra bone from the posterior femoral condyles) and Freedom TKA (bone conserving posterior femoral condyles).
We examined 5 hypotheses: (1) the amount of bone resected from the distal femur, posterior femoral condyles, and intercondylar notch is less for a Freedom TKA compared with a NexGen LPS TKA; (2) the clinical and radiographic results are at least as good in patients who receive a NexGen LPS-Flex prosthesis compared with those who receive a Freedom prosthesis (Figure. 1); (3) the knee range of motion achieved with a NexGen LPS-Flex prosthesis is better than the knee range of motion achieved with a Freedom prosthesis; (4) patient satisfaction is the same for NexGen LPSFlex and Freedom TKAs; and (5) the complication rate is lower with a Freedom TKA compared with a NexGen LPS-Flex TKA. Photographs showing the design features of NexGen LPS-Flex and Freedom knee prostheses (Figures 1A-B).
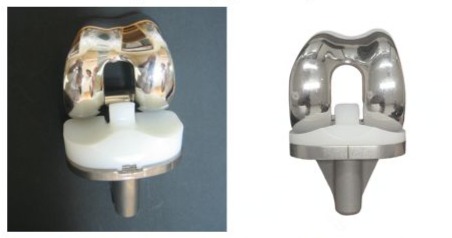
Figure 1A: Frontal views of the NexGen LPS-Flex (left) and Freedom (right) total knee prostheses. The Freedom component is narrower in the intercondylar notch (box cut).
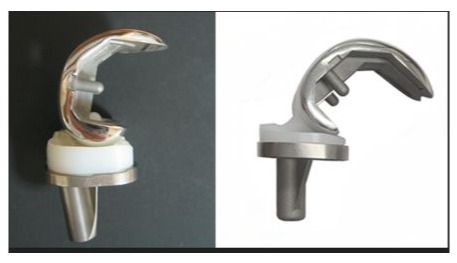
Figure 1B: Lateral views of the NexGen LPS-Flex (left) and Freedom (right) total knee prostheses. In the Freedom prosthesis, the anterior and posterior femoral condyles are thinner.
Materials and Methods
Demographics
We identified 296 patients (488 knees) who received a NexGen LPS-Flex knee prosthesis. These 296 patients were matched individually with 295 patients who received a Freedom knee prosthesis, for age, sex, body mass index (BMI), preoperative active range of motion, and preoperative Knee Society knee and function scores. We performed the matching process blinded to the eventual outcomes of NexGen LPS-Flex and Freedom TKAs. We matched preoperative variables by using a spreadsheet program in the following order: age, BMI, preoperative knee score, preoperative function score, preoperative active range of motion, and sex. There were no differences in the preoperative characteristics of the patients in the NexGen LPS-Flex and Freedom TKA groups.
All patients who underwent a TKA performed by a senior author at one institute were included in the study. The indication for TKA in both groups was osteoarthritis that was severe enough to warrant a TKA after an adequate trial of nonoperative therapy. Among the 296 patients who received a NexGen LPS-Flex prosthesis, 3 died and 8 were lost to follow-up, leaving 285 patients available with a minimum follow-up duration of 2 years (mean, 3.5 years; range, 2 to 5 years). Among the 295 patients with a Freedom knee prosthesis, 4 died and 11 were lost to follow-up, leaving 280 patients available with a minimum duration of follow-up of 2 years (mean, 3.5 years; range, 2 to 5 years). We obtained approval from our institutional review board before beginning this study (Table 1).
|
Parameters |
Study Groups |
P value |
|
|
NexGen LPS-Flex TKA |
Freedom Knee TKA |
||
|
Number of patients (knees) |
(477) |
(472) |
0.522 |
|
Number of males/females |
/ 237 |
/ 231 |
0.568 |
|
Age* (yr) |
68.7 (50-86) |
70.1 (53-88) |
0.871 |
|
Height* (cm) |
151.2 (140-181) |
154.1 (139-180) |
0.879 |
|
Weight* (kg) |
63.1 (41-91) |
63.5 (41-98) |
0.712 |
|
BMI* (kg/m2) |
27.1 (21-38) |
26.7 (19.3-40) |
0.813 |
|
Range of motion |
126° (98°-150°) |
125° (70°-150°) |
0.953 |
|
Knee Score (Knee Society) |
points (7-36 points) |
points (9-39 points) |
0.712 |
|
Function score (Knee Society) |
points (13-28 points) |
points (15-31 points) |
0.813 |
|
Diagnosis (osteoarthritis) |
knees |
knees |
0.125 |
|
Follow-up* (yr) |
3.5 (2-5) |
3.5 (2-5) |
0.119 |
|
*Values are given as the mean, with the range in parentheses. BMI = Body Mass Index |
|||
Table 1: Demographic Data of 950 Total Knee Arthroplasties*.
Surgical Technique
A pneumatic tourniquet at a pressure of 250 mmHg was used in all patients after exsanguination with an Esmarch bandage. In all knees, an anterior midline skin incision (12 to 15 cm in length) was used, followed by a medial parapatellar capsular incision. The femur was prepared first, followed by the tibia. All patellae were resurfaced routinely with a polyethylene patellar prosthesis. Femoral implant sizing was done using an anterior referencing. All implants were cemented using modern techniques, including pulsed lavage, drying, and pressurization of the cement. Intraoperatively, the amount of resected bone from the medial and lateral condyles of the distal femur and those of the posterior femoral condyles was measured the greatest dimension of width, length and depth using a caliper in. The rationale for measuring the resected bone volume was to determine whether there is a correlation between the amount of bone resection and clinical results, particularly knee range of motion.
Rehabilitation
Starting on postoperative day 1, the patients started active knee range of motion exercise and began standing at the bedside and transitioning to weight bearing as soon as it was comfortable.
Clinical Evaluation
Clinical evaluations were done at the following times after the operation: 3 months, 1 year, and then 2-3 years thereafter. The mean follow-up duration was 3.1 and 3.5 years (range, 2 to 5 years), in each group. All clinical data at the time of each followup were recorded and compiled by a research associate who was not part of the operative team. The Knee Society score [9] and the Western Ontario and McMaster Universities Osteoarthritis (WOMAC) index [10] were determined. Active knee range of motion of the patient in the supine position was determined by 2 observers with the use of a standard (60-cm) clinical goniometer before the operation and at each follow-up [11]. When the measured knee motion differed by > 5° between the 2 observers, the values were averaged, and that number was reported. Intraobserver agreement regarding knee range of motion was 0.95 to 0.99. Patient satisfaction was assessed with a visual analog scale (VAS) that ranged from 0 to 10. The answers were categorized as ≤ 2 (fully dissatisfied); 3, 4, or 5 (somewhat dissatisfied); 6, 7, or 8 (somewhat satisfied); or 9 or 10 (fully satisfied). The level of activity was assessed by using the University of California, Los Angeles (UCLA) activity score [12].
Radiographic Evaluation
Anteroposterior radiographs of knees (taken with the patient standing as well as lying supine), lateral radiographs, and skyline patellar radiographs were taken preoperatively and at each follow-up. They were assessed for the alignment of the limb (tibiofemoral angle), the position of the components, the posterior slope of the tibial components, the level of the joint line, and the presence and location of radiolucent lines at the bone-cement interface in accordance with the recommendations of the Knee Society [9]. Anteroposterior standing radiographs were used to determine the sequential change in the alignment of the limb as a result of polyethylene wear and/or loosening of the implant. Supine anteroposterior radiographs were used to determine the presence of a radiolucent line more precisely. Skyline patellar radiographs were examined to determine the presence of patellar tilt, subluxation, or dislocation. All radiographs were taken under fluoroscopic guidance to control rotation of the knee. Radiographic data at the time of each follow-up were analyzed and recorded by a research associate who was not part of the operative team.
Data Analyses
We performed an a priori power analysis to minimize the chance of a type-2 error and to increase the power of our study. We assumed the difference in the Knee Society knee score to be 5 points with a power of 0.99, which revealed that a total of 252 patients (468 knees) would be needed in each group. We recruited approximately 10% more patients to account for possible dropouts. We calculated descriptive statistics (mean, standard deviation and proportions) for the continuous study variables [13-15]. We compared the amount of resected bone, the Knee Society score, the WOMAC index, the knee range of motion, and the radiological data between the groups with a paired t-test. We compared the postoperative Knee Society pain score between the groups using the Mantel-Haenszel chi-square test. We compared the complication rate between the groups with a chi-squared test. Moreover, we performed survivorship analysis to determine the cumulative rate of survival of the implant during the study period [16].
Results
The resection thickness from the distal femur (averaged 8.7 mm from the medial and lateral sides for the NexGen LPS-Flex TKA group and averaged 7.8 mm from the medial and lateral sides for the Freedom TKA group). The resection thickness from the posterior femoral condyles (averaged 11.5 mm from the medial and lateral sides for the NexGen LPS-Flex TKA group and averaged 5.7 mm from the medial and lateral sides for the Freedom TKA group). And the resection volume of from the intercondylar notch was 11 cm3 for the NexGen LPS-Flex TKA group and 8.1 cm3 for the Freedom TKA group. (Table 2).
|
NexGen LPS-Flex |
Freedom knee |
P-value |
|
|
Distal femoral condyle (mm) |
|||
|
Medial condyle |
9 (8-10) |
7.21 (2-11) |
0.06 |
|
Lateral condyle |
8.5 (7-9) |
8.32 (0-12) |
0.512 |
|
Posterior femoral condyle (mm) |
|||
|
Medial condyle |
12 (9-13) |
6.56 (3-13) |
< 0.001 |
|
Lateral condyle |
11.5 (9-13) |
4.70 (0-10) |
< 0.001 |
|
Proximal tibia (mm) |
|||
|
Medial condyle |
6 (5-11) |
5.09 (0-11) |
0.125 |
|
Lateral condyle |
9 (8-12) |
8.79 (3-14) |
0.119 |
|
Box cut volume (Cm3) |
11 (10.2-11.8) |
8.1 (6.4-9.7) |
< 0.001 |
Table 2: Resected Bone Volume.
Clinical Results
In this short-term follow-up study, there were no differences in clinical function between the NexGen LPS-Flex TKA and Freedom TKA groups. Specifically, the mean preoperative Knee society score was 31 points for each group, while the mean postoperative Knee Society score was 91 points for the NexGen LPS-Flex TKA group and 93 points for the Freedom TKA groups, and the mean postoperative functional score was 81 points for the NexGen LPS-Flex TKA group and 83 points for the Freedom TKA group. The knee range of motion was similar between the groups preoperatively (126° for the NexGen LPS-Flex TKA group and 125° for the Freedom TKA group) and postoperatively (125° for the NexGen LPS-Flex TKA group and 128° for Freedom TKA). Overall, at a mean follow-up of 3.5 years after the operation, the clinical data were not significantly different between the NexGen LPS-Flex TKA and Freedom TKA groups (Table 3).
|
Parameter |
NexGen LPS-Flex TKA |
Freedom TKA |
Difference of Difference |
P value |
|||||
|
Preop. |
Postop. |
Difference |
Preop. |
Postop. |
Difference |
Preop. |
Postop. |
||
|
Knee Society Knee score+ (points) |
31 (7-36) |
91 (69100) |
60 |
31 (9-39) |
93 (79100) |
62 |
2 (95% CI, 1.1-2.6) |
0.712≠ |
0.835≠ |
|
Knee Society Pain score+ (points) |
19 (0-25) |
41 (42-50) |
22 |
22 (6-31) |
42 (41-50) |
20 |
2 (95% CI, 1.1-2.6) |
0.921§ |
0.823§ |
|
Knee Society deformity score+ (points) |
5 (1-99) |
0.5 (0-3) |
4.5 |
4 (6-15) |
0.4 (0-4) |
3.6 |
0.9 (95% CI, 0.5-1.3) |
0.141≠ |
0.134≠ |
|
Knee Society function score+ (points) |
17 (13- 28) |
81 (67100) |
62 |
19 (15- 31) |
83 (71100) |
64 |
2 (95% CI, 1.1-2.0) |
0.813≠ |
0.852 |
|
Range of motion (degree) |
126 (98150) |
125 (110- 145) |
1 |
125 (65150) |
128 (70150) |
3 |
2 (95% CI, 1.1-2.0) |
0.953≠ |
0.981≠ |
|
WOMAC score (points) |
66.3 (55- 85) |
39.1 (19-35) |
39.6 |
65.8 (51- 81) |
28.1 (21-39) |
37.7 |
1.9 (95% CI, 0.9-2.4) |
0.912≠ |
0.928≠ |
|
UCLA activity score (points) |
1.7 (1-3) |
6.1 (4-9) |
4.3 |
1.6 (1-4) |
6.2 (5-9) |
4.6 |
0.3 (95% CI, 0.1-1.3) |
0.910≠ |
0.937≠ |
|
Patient satisfaction score (points) |
N/A |
7.3 (5-10) |
N/A |
N/A |
7.6 (6-10) |
N/A |
0.3 (95% CI, 0.1-1.8) |
0.912≠ |
0.937≠ |
|
*Preop. = Preoperative, Postop. = postoperative, CI= Confidence Interval, WOMAC = Western Ontario McMaster Universities. Osteoarthritis Index, UCLA = University of California, Los Angeles. + The values are given as the mean, with the range in parentheses ≠ Paired t test, § Chi-square test17 points (13-28 points). |
|||||||||
Table 3: Comparison of Clinical Results
Radiographic Results
The radiographic results were similar in the NexGen LS-Flex and Freedom TKA groups with regard to the alignment of the knee and the position of the femoral and tibial components in the coronal and sagittal planes. If one assumes a tolerance level of 3°, then the prevalence of outliers ranged from 2 to 4% for all parameters in the NexGen LPS-Flex TKA group and from 1 to 3% in the Freedom TKA group. These differences between the groups were not significant (P > 0.05; Table 4). No knee in either group had osteolysis around the components (Figures 2 and 3).
|
Parameters |
NexGen LPS-Flex TKA |
Freedom TKA |
P value* |
|
Mean knee alignment (°) (range) |
|||
|
Preoperative |
10.1 (5-20) |
11.2 (8-20) |
0.651 |
|
Postoperative |
5.3 valgus (3-6) |
5.4 (3-7) |
0.125 |
|
Mean femoral component position (femoral angle) (°) (range) |
|||
|
Coronal |
96 (93-103) |
95 (94-101) |
0.256 |
|
Saggital |
2.9 (-0.6-8) |
3.1 (1-7) |
0.912 |
|
Tibial component position (°) (range) |
|||
|
Coronal |
91 (86-93) |
90 (87-92) |
0.133 |
|
Saggital |
86 (78-89) |
85 (78-90) |
0.167 |
|
Joint line (mm) (range) |
|||
|
Preoperative |
15.3 (11-23) |
15.7 (9-24) |
0.676 |
|
Postoperative |
14.9 (9-21) |
14.7 (8-20) |
0.793 |
|
Postoperative condylar offset (mm) (range) |
|||
|
Preoperative |
25.1 (23-32) |
25.9 (18-31) |
0.125 |
|
Postoperative |
25.6 (20-30) |
25.7 (21-31) |
0.151 |
|
Radiolucent line (tibial side) (%) |
|||
|
Zone 1 (< 1 mm) |
(0) |
(0) |
N/A |
|
Radiolucent line (> 1 mm) (femoral side) (%) |
|||
|
Anterior flange |
3 knees (0.6%) |
0 knees (0%) |
0.176 |
|
Posterior flange |
0 knees (0%) |
0 knees (0%) |
N/A |
|
*Paired t test N/A: not applicable |
|||
Table 4: Radiographic Results.
Radiographs of the knees of a 67-year-old woman who had osteoarthritis in both knees (Figure 2A-B).
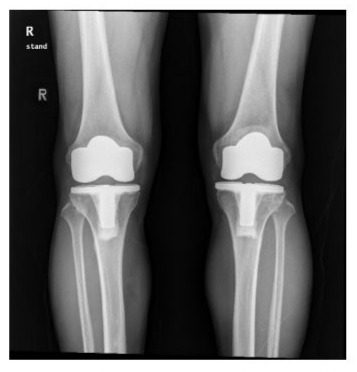
Figure 2A: Standing anteroposterior radiograph of both knees taken 4 years after surgery, showing that the NexGen LPS-Flex prostheses are embedded solidly in a satisfactory position. There are no radiolucent lines and there is no osteolysis around the components in either knee.
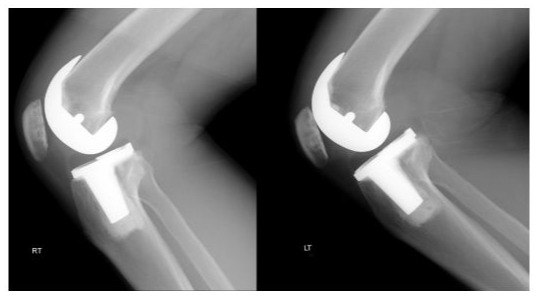
Figure 2B: Lateral radiograph showing that NexGen LPS-Flex prostheses are fixed satisfactorily. There are no radiolucent lines and there is no osteolysis around the components in either knee.
Radiographs of the knees of a 65-year-old woman who had osteoarthritis in both knees (Figure 3).
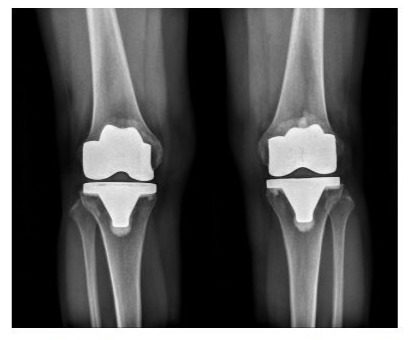
Figure 3A: Standing anteroposterior radiograph of both knees taken 4 years after surgery, showing that the Freedom knee prostheses are embedded solidly in a satisfactory position. There are no radiolucent lines and there is no osteolysis around the components in either knee.
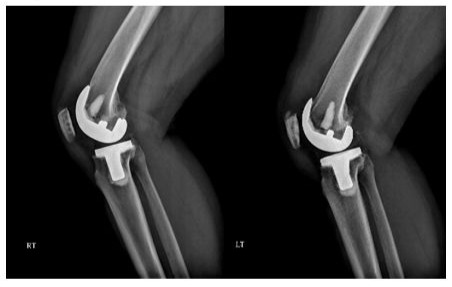
Figure 3B: Lateral radiographs showing that the Freedom knee prostheses are fixed satisfactorily. There are no radiolucent lines and there is no osteolysis around the components in either knee.
Patient Satisfaction
The mean patient satisfaction score was 7.6 ± 2.4 points in the NexGen LPS-Flex TKA group and 7.9 ± 2.1 points in the Freedom TKA group. This difference was not significant (P = 0.421). For the NexGen LPS-Flex TKA group, 217 (76%) patients were fully satisfied with the outcome, 58 (20%) were somewhat satisfied, and 5 (2%) were fully dissatisfied. For the Freedom TKA group, 218 (78%) patients were fully satisfied with the outcome, 56 (20%) were somewhat satisfied, and 2 (0.1%) were fully dissatisfied.
Complications
In the NexGen LPS-Flex TKA group, 2 (0.4%) knees had a coronal instability that was revised with a Legacy condylar constrained knee (LCCK) (Zimmer, Warsaw, Indiana) prosthesis. Three (0.6%) knees had an aseptic loosening of the femoral component. These knees were revised with an LCCK prosthesis. In the Freedom TKA group, 2 (0.4%) knees had a recurrent effusion presumably due to instability; they were revised with an LCCK prosthesis. No knee had subluxation or dislocation of the tibiofemoral joint or a patellar dislocation.
Survivorship
At 3.5 years, the survival rate was 99% (95% CI 92 to 100%) for the NexGen LPS-Flex prosthesis and 99.6% (95% CI 93 to 100%) for the Freedom prosthesis.
Discussion
Based on our short-term follow-up, the clinical and radiographic results, knee range of motion, and complication and survival rates were not significantly different between the NexGen LPS-Flex TKA and Freedom TKA groups.
Several authors have reported a high incidence of early femoral component loosening for NexGen LPS-Flex TKA [17-20]. They suggested that inadequate support of the posterior femoral condyles due to extra bone cuts, deficient bone quality, or poor cementing technique may cause the femoral component to migrate during deep knee flexion. On the contrary, several other authors have not found evidence of early loosening of the femoral component for NexGen LPS-Flex TKA [11,21-28]. In the present study, the prevalence of aseptic loosening of the femoral component was low (3 knees, 0.6%). We speculate that this low prevalence is attributable to adequate support of the anterior and posterior femoral condyles due to precise bone cuts, relatively good bone quality, and good cementing technique. Three femoral components were loose presumably due to excessive cutting of the posterior femoral condyles and poor cement technique.
The Freedom Total Knee System was designed to accommodate changes in the femoral condylar radii of curvature based on the degree of flexion change and the amount of rollback needed through range of motion while minimizing bone resection. In the current study, significant less bone was resected from the distal femur, posterior femoral condyles, and the intercondylar notch in the Freedom TKA group compared with the NexGen LPSFlex TKA group. However, there were comparable clinical and radiographic results in both groups.
In the current study, the mean postoperative knee range of motion was not significantly different between the 2 groups. Moreover, there was a high degree of flexion in both groups. Several factors may have an important role in this high degree of flexion, including the preponderance of women, the low BMI of the patients, and the good preoperative knee range of motion [29,30]. Postoperatively, the posterior femoral condylar offset was comparable in both groups. For the NexGen LPS-Flex TKA, an additional 2 mm of bone cut was cut from the posterior femoral condyles and was replaced with the 2 mm thicker posterior femoral condyles of the prosthesis. In the Freedom TKA group, a minimum amount of bone was cut from the posterior femoral condyles. This finding suggests that extra bone removal from the posterior femoral condyles is not needed to improve the knee range of flexion.
Radetzki et al. [30] reported that 3 of 17 (18%) high-flexion TKAs required revision at a mean follow-up of 10 years. The authors claimed that this high revision rate could be attributed to excessive bone removal. Hence, they concluded that the use of high-flexion TKA system should be seriously reconsidered. In the current study, the revision rate at a mean follow-up of 3.5 years was not significantly different between the 2 groups (1% in the NexGen LPS-Flex TKA group and 0.4% in the Freedom TKA group), but a longer follow-up is mandatory to determine whether this continues to hold true in the long term. Our short-term clinical results of the Freedom TKA are consistent with the results of Durbhakula et al. [31] Furthermore, patient satisfaction and the complication rate were similar between the two groups.
Our study has some limitations. First, no patients were morbidly obese, and a large majority of the patients were women. In addition, preoperative knee range of motion was generally good. These factors may limit the generalizability of our findings to other patient groups or practice settings. Second, the small sample size and lack of inter-observer comparisons could have led to bias in interpreting the radiological results. Third, we only examined one type of posterior-stabilized TKA prosthesis. Therefore, the findings are not necessarily applicable to other types of highflexion TKA designs. In addition, the findings are not directly applicable to cruciate-retaining designs. Fourth, there was lack of randomization. Finally, a single surgeon performed all of the studies, and follow-up was relatively short.
The results of the present short-term clinical study suggest that excellent clinical and radiographic results were achieved with the bone-conserving Freedom TKA and the conventional NexGen LPS-Flex TKA. We found no significant clinical advantage for a conventional NexGen LPS-Flex TKA over a bone-conserving Freedom TKA. We believe that the extra bone that is removed to allow for the thicker posterior aspect of the femoral condyles in the NexGen LPS-Flex prosthesis (particularly in patients with small bones) may be a concern should revision be necessary.
Acknowledgements
We would like to acknowledge Doori Kim for her work on data collection and data analysis.
Funding sources
Meril Health Care Private Limited, Mumbai India
Competing interest
YHK: International member of AAOS. Member of American association of Hip and Knee surgeons
JWP: None
YSJ: None
EJK: None
References
- Bellemans J, Banks S, Victor J, Vandenneucker H, Moemans A (2002) Fluoroscopic analysis of the kinematics of deep flexion in total knee arthroplasty. Influence of posterior condylar offset. J Bone Joint Surg Br 84(1): 50-53.
- Anouchi YS, McShane M, Kelly F Jr, Elting J, Stiehl J (1996) Range of motion in total knee replacement. Clin Orthop Relat Res (331): 87-92.
- Hartford JM, Banit D, Hall K, Kaufer H (2001) Radiographic analysis of low contact stress meniscal bearing total knee replacements. J Bone Joint Surg Am 83(2): 229-234.
- Li G, Schule SL, Zyontz SJ, Maloney WJ, Rubash HE (2003) Improving flexion in total knee arthroplasty. In: Callaghan JJ, Rosenberg AG, Rubash HE. Simontan PT, Wickiowicz TL, editors. The adult knee. Volume 2. Philadelphia: Lippincott Williams and Wilkins p.1233-1244.
- Durbhakula S, Rego L (2016) Restoration of femoral condylar anatomy for achieving optimum functional expectations: component design and early results. Joint Implant Surg Res Found 6: 31-35.
- Han HS, Kang SB, Yoon KS (2007) High incidence of loosening of the femoral component in legacy posterior stabilized-flex total knee replacement. J Bone Joint Surg Br 89(11): 1457-1461.
- King TV, Scott RD (1985) Femoral component loosening in total knee arthroplasty. Clin Orthop Relat Res 194: 285-290.
- Zelle J, Janssen D, Van Eijden JV, De Waal Malefijt M, Verdonschot N (2011) Does high-flexion total knee arthroplasty promote early loosening of the femoral component? J Orthop Res 29(7): 976-983.
- Insall JN, Dorr LD, Scott RD, Scott WN (1989) Rationale of the Knee Society Clinical rating system. Clin Orthop Relat Res (248): 13-14.
- Bellamy N, Buchanan WW, Goldsmith CH, Campbell J, Stitt LW (1988) Validation study of WOMAC: a health status instrument for measuring clinically important patient relevant outcomes to antirheumatic drug therapy in patients with osteoarthritis of the hip or knee. J Rheumatol 15(12): 1833-1840.
- Kim Y-H, Choi Y, Kwon OR, Kim JS (2009) Functional outcome and range of motion of high-flexion posterior cruciate-retaining and high-flexion posterior cruciate-substituting total knee prostheses. A prospective, randomized study. J Bone Joint Surg Am 91(4): 753-760.
- Zahiri CA, Schmalzried TP, Szuszczewicz ES, Amstutz HC (1998) Assessing activity in joint replacement patients. J Arthroplasty 13(8): 890-895.
- Rosner B (2000) Fundamentals of biostatistics. 5th ed. Duxbury Press, Pacific Grove, USA, p.527-530.
- Riffenburgh RH (2006) Tests on the distribution shape of continuous data. In: Riffenburgh RH, editor. Statistics in medicine. Amsterdam: Elsevier p.370-380.
- National Institute of Standards and Technology. Statistical Engineering Division, Levene test, Dataplot.
- Kaplan EL, Meier P (1958) Nonparametric estimation from incomplete observations. J Am Statist Assoc 53(282): 457-481.
- Bollars P, Luyckx JP, Innocenti B, Labey L, Victor J, Bellemans J (2011) Femoral component loosening in high-flexion total knee replacement: an in vitro comparison of high-flexion versus conventional designs. J Bone Joint Surg Br 93(10): 1355-1361.
- Zelle J, Janssen D, Van Eijden J, De Waal Malefijt M, Verdonschot N (2011) Does high flexion total knee arthroplasty promote early loosening of the femoral component? J Orthop Res 29(7): 976-983.
- King TV, Scott RD (1985) Femoral component loosening in total knee arthroplasty. Clin Orthop Relat Res (194): 285-290.
- Huang HT, Su JY, Wang GJ (2005) The early results of high-flex total knee arthroplasty: a minimum of 2 years of follow-up. J Arthroplasty 20(5): 674-679.
- Kim YH, Sohn KS, Kim JS (2005) Range of motion of standard and high-flexion posterior stabilized total knee prostheses. A prospective, randomized study. J Bone Joint Surg Am 87(7): 1470-1475.
- Kim YH, Choi Y, Kim JS (2009) Range of motion of standard and highflexion posterior cruciate-retaining total knee prostheses: a prospective randomized study. J Bone Joint Surg Am 91(8): 1874-1881.
- Mehin R, Burnett RS, Brasher PM (2010) Does the new generation of high-flex prostheses improve the post-operative range of movement: a meta-analysis. J Bone Joint Surg Br 92(10): 1429-1434.
- Nutton RW, Vander Linden ML, Rowe PJ, Gaston P, Wade FA (2008) A prospective randomized double-blind study of functional outcome and range of flexion following total knee replacement with the NexGen standard and high flexion components. J Bone Joint Surg Br 90(1): 37-42.
- Choi WC, Lee S, Seong SC, Jung JH, Lee MC (2010) Comparison between standard and high-flexion posterior stabilized rotatingplatform mobile-bearing total knee arthroplasties: a randomized controlled study. J Bone Joint Surg Am 92(16): 2634-2642.
- Crawford DA, Adams JB, Hurst JM, Berend KR, Lombardi Jr AV (2019) Ten-year minimum outcomes and survivorship with a high flexion knee system. J Arthroplasty 34(9): 1975-1979.
- Kim Y-H, Park J-W, Kim J-S (2012) High-flexion total knee arthroplasty: survivorship and prevalence of osteolysis: results after a minimum of ten years of follow-up. J Bone Joint Surg Am 94(15): 1378-1384.
- Kim YH, KooK HK, Kim JS (2001) Comparison of fixed-bearing and mobile-bearing total knee arthroplasties. Clin Orthop Relat Res (392): 101-115.
- Kim YH, Kim JS (2004) Comparison of anterior-posterior-glide and rotating-platform low contact stress mobile-bearing total knee arthroplasties. J Bone Joint Surg Am 86(6): 1239-1247.
- Radetzki F, Wienke A, Mendel T, Gutteck N, Delank KS, Wohlrab D (2013) High flex total knee arthroplasty- a prospective, randomized study with results after 10 years. Acta Orthop Belg 79(5): 536-540.
- Durbhakula S, Durbhakula V, Durbhakula N (2019) Restoration of femoral condylar anatomy for achieving optimum functional expectations: continuation of an earlier study at 5-year minimum follow-up. Joint Implant Surg 9(1): 17-22.
© by the Authors & Gavin Publishers. This is an Open Access Journal Article Published Under Attribution-Share Alike CC BY-SA: Creative Commons Attribution-Share Alike 4.0 International License. Read More About Open Access Policy.