Changes in Quality of Life in Traumatic Spinal Injury Patients Undergoing Operative Procedures: A Prospective Observational Study
by Simin Clarise Lin1, Michelle Trevenen2, Leon Flicker1,2, Emma-Leigh Synnott3, Peter Woodland4, Mayura Thilanka Iddagoda1,2*
1Perioperative Service, Royal Perth Hospital, Wellington Street, Perth, WA, 6000, Australia
2University of Western Australia, Stirling Hwy, Crawley, Perth, WA, 6009, Australia
3State Rehabilitation Service, Fiona Stanley Hospital, Murdoch, WA, 6150, Australia
4State Spinal Service, Royal Perth Hospital, Wellington Street, Perth, WA, 6000, Australia
*Corresponding author: Mayura Thilanka Iddagoda, Royal Perth Hospital, 197, Wellington Street, Perth. WA 6000, Australia
Received Date: 19 October 2025
Accepted Date: 24 October 2025
Published Date: 27 October 2025
Citation: Lin SC, Trevenen M, Flicker L, Synnott E, Woodland P, Iddagoda, MT. (2025) Changes in quality of life in traumatic spinal injury patients undergoing operative procedures: A prospective observational study J Surg 10: 11474 https://doi.org/10.29011/2575-9760.011474
Abstract
Background: Traumatic spinal injuries significantly impact Quality Of Life (QoL) due to physical and psychosocial challenges. Understanding determinants of QoL outcomes in patients undergoing surgical interventions is crucial for optimising care.
Aim: To assess the Quality Of Life (QoL) of patients who have traumatic spinal injuries and to determine which demographic- and injury-related factors are associated with changes in QoL in traumatic spinal injured patients.
Methodology: 104 patients with traumatic spinal injuries admitted to a state spinal unit or trauma centre from October 2022 to January 2023 were prospectively enrolled. The EQ-5D outcomes comprised ‘mobility’, ‘self-care’, ‘usual activities’, ‘pain/discomfort’ and ‘anxiety/depression’ domains, and a visual analogue scale. Demographic, clinical, and injury-related factors were analysed using generalised linear mixed models against changes in QoL domains over time.
Results: Overall, mobility, self-care, and usual activities significantly improved over time, with the greatest improvement observed early in the post-admission period (p < .001). Pain/discomfort and anxiety/depression domains showed improvement (p = .003 and .001 respectively) albeit at a slower rate. Patients with SCI consistently reported poorer physical QoL but similar psychological QoL compared to non-SCI patients. Surgical intervention was not associated with QoL outcomes across domains.
Conclusions: This study found significant improvements in QoL domains over the initial three months following traumatic spinal injuries, particularly in physical aspects. While SCI patients demonstrated ongoing physical limitations, psychological aspects of QoL were comparable between SCI and non-SCI groups. Surgical intervention was not associated with poorer QoL outcomes.
Keywords: Activity; Mobility; Pain; Quality of Life; Self-Care; Spinal Cord Injury; Spinal Surgery; Traumatic Spinal Injury; Mood Disorder.
Abbreviations: American Spinal Injury Association (ASIA); EuroQol-5D (EQ-5D); Motor Vehicle Accident (MVA); Quality of Life (QoL); Spinal Cord Injury (SCI); Visual Analogue Scale (VAS)
Introduction
Traumatic spinal injury, or spinal trauma, is defined as acquired damage to the spinal cord and/or spinal column [1]. Spinal column trauma has an incidence up to 45 times greater than traumatic Spinal Cord Injuries (SCI) [2]. The worldwide incidence of traumatic SCI is estimated at 23 cases per million population in 2007, i.e., nearly 180,000 new traumatic SCI cases annually [3]. According to the Australian Institute of Health and Welfare, [4] land transport crashes constituted the majority (46%) of traumatic SCI in 2017-2018, followed by falls (35.8%). Other causes of SCI include water-related injury, heavy falling object, and horserelated and football-related injuries [4]. SCI has been considered to be one of the most detrimental conditions of acquired disabilities resulting in adverse outcomes to the individual, [5] with negative impacts on families and on society at large [6,7]. According to current evidence, sociodemographic and trauma-related factors associated with higher functional outcome following a SCI include: decreased severity of the SCI, younger age, lower neurological level of injury, and the higher initial American Spinal Injury Association (ASIA) Impairment Scale motor score [8]. The main modifiable factors associated with higher functional outcome following a SCI are: availability of surgical management, higher functional status at discharge from acute care, shorter acute care length of stay, and presence of a specialised multidisciplinary functional rehabilitation process [8]. Other potential modifiable factors include: prevention of medical complications, and higher intensity and patient participation level in functional rehabilitation therapies [8].
Quality of Life (QoL) can be affected after spinal trauma. A study identified that suboptimal physical health status following spinal trauma was predicted by tachycardia and hyperglycaemia (reversible factors), as well as multiple comorbidities and thoracic spine injuries (irreversible factors) [2]. However, none of the early predictors were associated with mental health-related QoL outcomes. This study noted that the proportion of patients with satisfactory mental health well-being (53.4%) was higher than the proportion of patients with satisfactory physical well-being (32.6%) [2]. Another study reported that younger age, return to work, and non-hospitalisation were associated with better overall QoL ratings [9]. Injury severity was related to physical domains of QoL, but was not associated with mental health after SCI [9]. Changes in physical function after SCI often affects psychosocial function thus affecting patients’ health-related QoL [10]. Psychological changes after SCI include depression and anxiety, loss of independence and social isolation [11]. Secondary conditions or complications related to the SCI can further affect QoL and incur further costs to the healthcare system [11]. Not all aspects of QoL are necessarily affected following a SCI. While some studies have shown that individuals with SCI typically have rated their physical functioning, pain and general health lower than the general population, [12] their ratings on emotional and mental health are varied and may not be lower [13,14]. To build on the current understanding, our study aimed to assess changes in QoL in the first three months following traumatic spinal injuries in Western Australia, taking into account the potential impact of sociodemographic-, injury- and treatment-related factors (including surgery). We hypothesised that QoL ratings would improve over time following surgery.
Method
Study Sample
A prospective cohort of patients with traumatic spinal injuries who were admitted to either the Western Australia State Spinal Unit or State Trauma Centre between October 2022 and January 2023 were recruited. The care of patients admitted via the State Spinal Unit (i.e., typically patients with only spinal injuries) was managed by spinal orthopaedic surgeons, while the care of patients admitted via the State Trauma Unit (i.e., typically patients with multiple injuries) was managed by trauma surgeons. These patients received multidisciplinary care, and surgical care if required. Based on the patients’ post-intervention function and eligibility, they were either discharged home, to a local rehabilitation facility, or to the State Rehabilitation Service. Patients were included if there was evidence of spinal injury on CT or MRI. Patients were excluded if they were not able to consent due to moderate cognitive impairment (i.e., Mini Mental State Examination score less than 20 out of 28) or if they had spinal injuries due to non-traumatic causes (e.g., ischaemic, cancer related causes).
Data Collection
Patients were approached within the first 4 days post-admission to obtain consent and were followed for three further assessments (i.e., 7-9 days post-admission, 4-5 weeks post-admission, 3 months post-admission). Patients were assessed in person if they were inpatients, or via telephone if they were discharged home.
Variables
Measurements: Age, gender and whether individuals identified as Aboriginal or Torres Strait Islander were recorded. Baseline function (i.e., independent or supported) and living status (i.e., living alone or with others) were recorded. The Clinical Frailty Scale (CFS) [15,16] and the Charlson Comorbidity Index (CCI) [17] were also recorded. The Mini Mental State Examination (MMSE) [18] was used to determine baseline cognition, and was modified. The two motor-related items were removed from the 30item MMSE to derive a total score out of 28. This adaptation was implemented as many patients were in strict spinal precautions or had lost hand function. Surgical intervention status (i.e., with or without surgery), mechanism of injury (i.e., motor vehicle accident [MVA] or non-MVA), highest level of spinal injury (i.e., lumbar/ sacral or cervical/thoracic) and the ASIA Impairment Scale [15] were recorded.
Outcome Variables: EuroQoL-5D (EQ-5D). This was used as recommended by the International Consortium for Health Outcomes Measurement forum to allow benchmarking across different countries, cultures, and patient demographic groups [19-21]. The five dimensions of the scale include: mobility, selfcare, usual activity, pain/discomfort and anxiety/depression. The EQ-5D-3L version rates each domain at three levels (1 = “no problem”, 2 = “some problem” or 3 = “extreme problem”)[19]. An overall QoL score is created by summing scores from each of the five domains, with scores ranging from 5 to 15. The EQ-5D also consists of a visual analogue scale (VAS) that assesses perceived health status from 0 (“worst health you can imagine”) to 100 (“best health you can imagine”)[19].
Analysis
Descriptive statistics were performed. Generalised linear mixed models with a cumulative logit link (i.e., an ordinal logistic regression with mixed effects) were performed for each of the five EQ-5D outcome domains separately. To analyse the overall QoL score (5 to 15) and the VAS, general linear mixed models were performed. Initially, univariate models were conducted, with fixed effects of time, each of the patient factors (age, gender, baseline function, Clinical Frailty Scale, living alone and Charlson Comorbidity Index) and each of the injury factors (surgical intervention, baseline ASIA, mechanism of injury, highest level of injury) for each of the of the five EQ-5D domains. Subsequently, a multivariate model was run for each outcome where time, and all patient and injury factors were included, as well as interactions between time and each injury factor so as to assess whether the relationships between each of the injury factors with each QoL outcome changed over time. All models contained a random effect of patient ID. Backwards hierarchical model selection was performed, where factors/interactions were sequentially removed (p > .05). All analyses were conducted in the R environment for statistical computing [22].
Ethics
The research project was assessed by the East Metropolitan Health Service Health Research and Ethics Committee. Approval was granted (Quality Activity reference number 47361) to recruit patients with spinal injuries and access medical records.
Results
(Table 1) shows the demographic and injury-related information of the 104 participants at admission. The mean age of participants was 55.8 (SD =±21.2), and 39.4% were aged above 65 years and 3% of the sample identified as Aboriginal or Torres Strait Islander. The majority of participants (84.6%) did not have a spinal cord injury. The most common cause of spinal injury was due to falls (54.8%) followed by motor vehicle related accidents (31.7%). Univariate and multivariate results are reported in (Supplementary Tables A.1 and A.2) respectively. Thirty-two participants (30.8%) underwent surgery, of which three participants required a second surgery.
|
Variable |
No. (%) |
|
|
Mean Age (Years; Mean (±SD)) |
55.8 (±21.2) |
|
|
Age Group |
Above 65 years |
41 (39.4%) |
|
65 years and below |
63 (60.6%) |
|
|
Aboriginal or Torres Strait Islander |
Yes |
3 (2.9%) |
|
No |
101 (97.1%) |
|
|
Gender |
Male |
81 (77.9%) |
|
Female |
23 (22.1%) |
|
|
Baseline Cognition |
Normal |
99 (95.2%) |
|
Mild Cognitive Impairment |
5 (4.8%) |
|
|
Baseline Function |
Independent |
91 (87.5%) |
|
Walking Stick |
3 (2.9%) |
|
|
Walking Aid |
9 (8.7%) |
|
|
Bedbound |
1 (1.0%) |
|
|
Clinical Frailty Scale |
1-3 |
89 (85.6%) |
|
4-6 |
14 (13.5%) |
|
|
7-9 |
1 (1.0%) |
|
|
Living Situation |
Alone |
20 (19.2%) |
|
Family |
77 (74.0%) |
|
|
Friends |
6 (5.8%) |
|
|
Nursing Home |
1 (1.0%) |
|
|
Work Status |
Retired |
38 (36.5%) |
|
Semi-Retired |
1 (1.0%) |
|
|
Employed |
55 (52.9%) |
|
|
Student |
2 (1.9%) |
|
|
Unemployed |
7 (6.7%) |
|
|
Comorbidities |
Mean (SD) |
2.5 (±2.3) |
|
0-2 |
61 (58.7%) |
|
|
3-5 |
30 (28.8%) |
|
|
6 or more |
13 (12.5%) |
|
|
Charlson Comorbidity Index |
0 |
36 (34.6%) |
|
1-2 (Mild) |
30 (28.8%) |
|
|
3-4 (Moderate) |
21 (20.2%) |
|
|
>4 (Severe) |
47 (45.2%) |
|
|
Mechanism of injury / Aetiology |
MVA / Other Vehicles |
33 (31.7%) |
|
Fall |
57 (54.8%) |
|
|
Sports / Recreation |
10 (9.6%) |
|
|
Other |
4 (3.8%) |
|
|
ASIA at Baseline |
A |
2 (1.9%) |
|
B |
2 (1.9%) |
|
|
C |
4 (3.8%) |
|
|
D |
8 (7.7%) |
|
|
(Total A to D) |
16 (15.4%) |
|
|
E |
88 (84.6%) |
|
|
Intervention |
Surgery |
32 (30.8%) |
|
Brace Only |
57 (54.8%) |
|
|
Conservative |
15 (14.4%) |
|
|
Highest Level of Injury |
Cervical |
49 (47.1%) |
|
Thoracic |
33 (31.7%) |
|
|
Lumbar |
21 (20.2%) |
|
|
Sacral |
1 (1.0%) |
|
Table 1: Demographic and Injury-related Variable Table at Hospital Admission.
|
Mobility |
Self-Care |
Usual Activities |
Pain / Discomfort |
Anxiety / Depression |
Overall QoL |
VAS |
|
|
OR (95% CI) |
OR (95% CI) |
OR (95% CI) |
OR (95% CI) |
OR (95% CI) |
MD (95% CI) |
MD (95% CI) |
|
|
Time |
|||||||
|
7-9 days vs admission |
0.02 (0.01, 0.04) |
0.04 (0.02, 0.09) |
0.11 (0.03, 0.37) |
0.83 (0.45, 1.53) |
0.55 (0.30, 1.02) |
1.97 (1.61, 2.33) |
-9.9 (-14.7, -5.2) |
|
4-5 weeks vs admission |
0.004 (0.001, 0.012) |
0.007 (0.003, 0.018) |
0.02 (0.01, 0.08) |
0.37 (0.20, 0.69) |
0.41 (0.22, 0.77) |
3.22 (2.86, 3.58) |
-23.8 (-28.6, -19.0) |
|
3 months vs admission |
0.002 (0.001, 0.006) |
0.002 (0.001, 0.006) |
0.003 (0.001, 0.011) |
0.43 (0.23, 0.80) |
0.27 (0.14, 0.54) |
4.1 (3.73, 4.46) |
-28.7 (-33.6, -23.9) |
|
4-5 weeks vs 7-9 days |
0.26 (0.13, 0.50) |
0.18 (0.09, 0.35) |
0.21 (0.10, 0.44) |
0.44 (0.24, 0.82) |
0.74 (0.39, 1.41) |
1.25 (0.88, 1.61) |
-13.9 (-18.7, -9.1) |
|
3 months vs 7-9 days |
0.11 (0.05, 0.24) |
0.05 (0.02, 0.11) |
0.03 (0.01, 0.06) |
0.52 (0.28, 0.96) |
0.50 (0.25, 0.99) |
2.13 (1.76, 2.5) |
-18.81 (-23.7, -14.0) |
|
3 months vs 4-5 weeks |
0.44 (0.21, 0.91) |
0.26 (0.13, 0.54) |
0.12 (0.06, 0.25) |
1.16 (0.63, 2.14) |
0.67 (0.34, 1.34) |
0.88 (0.51, 1.25) |
-5.0 (-9.8, -0.1) |
|
Overall |
*** |
*** |
*** |
** |
** |
*** |
*** |
|
Age (years) |
|||||||
|
For a 10-year increase |
1.22 (1.10, 1.35) |
1.29 (1.16, 1.43) |
1.03 (0.93, 1.13) |
1.06 (0.95, 1.20) |
1.10 (0.92, 1.31) |
0.23 (0.10, 0.36) |
-0.8 (-2.2, 0.8) |
|
Gender |
|||||||
|
Male vs Female |
1.18 (0.67, 2.08) |
1.70 (0.97, 2.98) |
1.30 (0.81, 2.08) |
1.10 (0.62, 1.97) |
0.65 (0.28, 1.54) |
-0.26 (-0.94, 0.43) |
3.1 (-4.4, 10.6) |
|
Baseline Function |
|||||||
|
Supported vs Independent |
4.09 (2.11, 7.95) |
4.65 (2.30, 9.41) |
1.57 (0.80, 3.07) |
1.51 (0.69, 3.34) |
3.21 (1.11, 9.28) |
-1.76 (-2.57, -0.94) |
14.3 (5.0, 23.6) |
|
Clinical Frailty Scale |
|||||||
|
4+ vs 1-3 |
3.60 (1.92, 6.77) |
4.33 (2.26, 8.30) |
1.44 (0.78, 2.67) |
1.37 (0.65, 2.88) |
3.67 (1.36, 9.87) |
-1.65 (-2.41, -0.88) |
10.9 (2.1, 19.8) |
|
Living Alone |
|||||||
|
Yes vs No |
1.76 (0.99, 3.12) |
1.30 (0.72, 2.35) |
1.38 (0.82, 2.34) |
1.32 (0.70, 2.47) |
3.02 (1.26, 7.23) |
-0.78 (-1.49, -0.07) |
4.4 (-3.6, 12.3) |
|
Charlson Comorbidity Index |
|||||||
|
1-2 vs 0 |
0.95 (0.56, 1.60) |
1.27 (0.76, 2.11) |
0.74 (0.45, 1.22) |
1.11 (0.61, 2.03) |
1.32 (0.53, 3.29) |
-0.08 (-0.97, 0.59) |
1.5 (-6.5, 9.5) |
|
3-4 vs 0 |
3.48 (1.94, 6.26) |
3.45 (1.91, 6.20) |
1.19 (0.66, 2.12) |
1.48 (0.73, 2.96) |
1.09 (0.39, 3.03) |
-1.21 (-1.96, 0.46) |
4.24 (-4.7, 13.2) |
|
5+ vs 0 |
2.28 (1.24, 4.19) |
3.61 (1.94, 6.72) |
1.16 (0.62, 2.16) |
1.44 (0.68, 3.07) |
2.29 (0.78, 6.73) |
-1.24 (-2.04, -0.43) |
3.58 (-6.0, 13.2) |
|
3-4 vs 1-2 |
3.68 (2.00, 6.75) |
2.72 (1.50, 4.93) |
1.61 (0.90, 2.87) |
1.33 (0.65, 2.71) |
0.82 (0.29, 2.35) |
-1.13 (-1.90, -0.36) |
2.73 (-6.5, 11.9) |
|
5+ vs 1-2 |
2.41 (1.29, 4.51) |
2.85 (1.52, 5.34) |
1.57 (0.84, 2.93) |
1.30 (0.61, 2.80) |
1.74 (0.58, 5.20) |
-1.15 (-1.98, -0.33) |
2.07 (-7.8, 11.9) |
|
5+ vs 3-4 |
0.66 (0.34, 1.28) |
1.05 (0.53, 2.06) |
0.98 (0.49, 1.95) |
0.98 (0.42, 2.26) |
2.11 (0.64, 7.00) |
-0.03 (-0.92, 0.87) |
-0.66 (-11.3, 10.0) |
|
Overall |
*** |
*** |
n.s. |
n.s. |
n.s. |
*** |
n.s. |
|
Surgical Intervention |
|||||||
|
Yes vs No |
1.94 (1.18, 3.17) |
1.64 (0.999, 2.69) |
1.33 (0.85, 2.07) |
1.66 (0.98, 2.81) |
1.63 (0.75, 3.53) |
-0.78 (-1.38, -0.19) |
5.7 (-1.1, 12.4) |
|
Baseline ASIA |
|||||||
|
E vs A-D |
0.17 (0.10, 0.31) |
0.24 (0.13, 0.45) |
0.43 (0.23, 0.82) |
0.61 (0.31, 1.20) |
0.53 (0.20, 1.40) |
1.75 (1.05, 2.45) |
-10.9 (-19.3, -2.5) |
|
Mechanism of Injury |
|||||||
|
Non-MVA vs MVA |
1.70 (1.03, 2.81) |
1.47 (0.89, 2.43) |
0.92 (0.59, 1.42) |
1.17 (0.69, 2.00) |
0.80 (0.37, 1.76) |
-0.34 (-0.95, 0.28) |
1.4 (-5.4, 8.2) |
|
Highest Level of Injury |
|||||||
|
Lumbar / Sacral vs Cervical / Thoracic |
0.71 (0.40, 1.25) |
0.73 (0.42, 1.28) |
1.02 (0.62, 1.66) |
0.81 (0.45, 1.47) |
0.35 (0.14, 0.87) |
0.58 (-0.11, 1.27) |
-5.17 (-12.8, 2.5) |
Note. OR = Odds Ratio; MD = Mean Difference; p < .01 **, p < .001 ***; n.s. = not significant
Table A.1: Univariate results analysing the seven outcome variables.
|
Mobility |
Self-Care |
Usual Activities |
Pain / Discomfort |
Anxiety / Depression |
Overall QoL |
VAS |
|
|
OR (95% CI) |
OR (95% CI) |
OR (95% CI) |
OR (95% CI) |
OR (95% CI) |
MD (95% CI) |
MD (95% CI) |
|
|
Time |
|||||||
|
7-9 days vs admission |
0.02 (0.01, 0.04) |
Interaction with mechanism of injury |
0.11 (0.03, 0.37) |
0.83 (0.45, 1.53) |
0.55 (0.30, 1.01) |
Interaction with baseline ASIA |
-9.95 (-14.67, -5.22) |
|
4-5 weeks vs admission |
0.004 (0.002, 0.012) |
0.02 (0.01, 0.08) |
0.37 (0.20, 0.69) |
0.40 (0.22, 0.76) |
-23.73 (-28.48, -19.0) |
||
|
3 months vs admission |
0.002 (0.001, 0.006) |
0.003 (0.001, 0.011) |
0.43 (0.23, 0.80) |
0.27 (0.14, 0.53) |
-28.68 (-33.5, -23.87) |
||
|
4-5 weeks vs 7-9 days |
0.27 (0.14, 0.52) |
0.021 (0.10, 0.44) |
0.44 (0.24, 0.82) |
0.74 (0.39, 1.40) |
-13.78 (-18.57, -8.99) |
||
|
3 months vs 7-9 days |
0.11 (0.05, 0.25) |
0.02 (0.01, 0.06) |
0.52 (0.28, 0.96) |
0.50 (0.25, 0.99) |
-18.73 (-23.58, -13.88) |
||
|
3 months vs 4-5 weeks |
0.43 (0.21, 0.90) |
0.12 (0.06, 0.24) |
1.16 (0.63, 2.14) |
0.67 (0.34, 1.33) |
-4.95 (-9.82, -0.09) |
||
|
Overall |
*** |
*** |
** |
** |
*** |
||
|
Age (years) |
|||||||
|
For a 10-year increase |
n.s. |
1.43 (1.16, 1.77) |
n.s. |
n.s. |
n.s. |
n.s. |
n.s. |
|
Gender |
|||||||
|
Male vs Female |
n.s. |
n.s. |
n.s. |
n.s. |
0.43 (0.19, 0.97) |
n.s. |
n.s. |
|
Baseline Function |
|||||||
|
Supported vs Independent |
19.1 (5.75, 63.2) |
8.50 (2.17, 33.3) |
n.s. |
n.s. |
n.s. |
-1.59 (-2.30, -0.89) |
13.2 (4.16, 22.2) |
|
Clinical Frailty Scale |
|||||||
|
4+ vs 1-3 |
n.s. |
n.s. |
n.s. |
n.s. |
3.23 (1.18, 8.85) |
n.s. |
n.s. |
|
Living Alone |
|||||||
|
Yes vs No |
n.s. |
n.s. |
n.s. |
n.s. |
3.19 (1.31, 7.79) |
n.s. |
n.s. |
|
Charlson Comorbidity Index |
|||||||
|
1-2 vs 0 |
n.s. |
n.s. |
n.s. |
n.s. |
n.s. |
n.s. |
n.s. |
|
3-4 vs 0 |
|||||||
|
5+ vs 0 |
|||||||
|
3-4 vs 1-2 |
|||||||
|
5+ vs 1-2 |
|||||||
|
5+ vs 3-4 |
|||||||
|
Overall |
|||||||
|
Surgical Intervention |
|||||||
|
Yes vs No |
n.s. |
n.s. |
n.s. |
n.s. |
n.s. |
n.s. |
n.s. |
|
Baseline ASIA |
|||||||
|
E vs A-D |
0.02 (0.01, 0.07) |
0.07 (0.02, 0.22) |
0.20 (0.07, 0.61) |
n.s. |
n.s. |
Interaction with time |
-11.4 (-19.5, -3.31) |
|
Mechanism of Injury |
|||||||
|
Non-MVA vs MVA |
n.s. |
Interaction with time |
n.s. |
n.s. |
n.s. |
n.s. |
n.s. |
|
Highest Level of Injury |
|||||||
|
Lumbar / Sacral vs Cervical / Thoracic |
n.s. |
n.s. |
n.s. |
n.s. |
0.26 (0.11, 0.64) |
n.s. |
n.s. |
Note. OR = Odds Ratio; MD = Mean Difference; p < .01 **, p < .001 ***; n.s. = not significant. For the multivariate model, time, and all demographic and injury factors were included, as well as interactions between time and each injury factor.
Table A.2: Multivariate results analysing the seven outcome variables.
Three participants (2.9%) passed away, but none of these were post-surgical patients. There were no missing data for predictor variables (as the information was obtained during the first assessment). (Figure 1) shows how the QoL scores changed over the four assessment timepoints (Baseline, 7-9 days, 4-5 weeks and 3 months) across the five EQ-5D outcome subdomains (Mobility, SelfCare, Usual Activities, Pain/Discomfort and Anxiety/Depression).
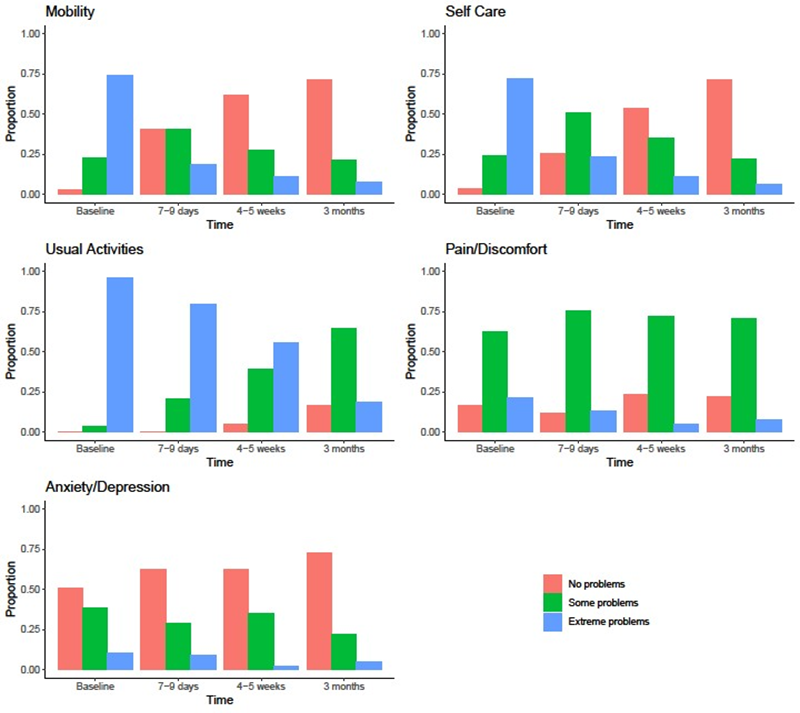
Figure 1: Distribution of QoL ratings over time across the five EQ-5D outcome subdomains
Mobility
Mobility QoL improved over time (see Figure 1 and Table A.2). Specifically, patients had significantly lower mobility QoL scores (i.e., better mobility) at every time point compared to any earlier time point (p < 0.001). Comparing each time point interval, the rate of improvement of mobility scores was the largest between the admission and 7-9 days interval (OR 0.02, 95% CI 0.01-0.04, p < .001; Table A.2). Other than baseline functional status and baseline ASIA, there were no statistically significant relationships between any of the other patient or injury factors with the mobility QoL domain (see Table A.2).
Self-Care
Age, baseline function, baseline ASIA, and an interaction between time and mechanism of injury were associated with the self-care QoL domain. The interaction between time and mechanism of injury indicated that how the self-care QoL domain changed over time depended on the mechanism of injury (see Figure 2 and Table A.3). Those with a non-MVA mechanism of injury were less likely to have higher self-care QoL (i.e., more likely to have better self-care) at admission than those with a MVA, although this did not reach statistical significance (OR 0.30, 95% CI 0.08-1.14, p = 0.078). Conversely, at 3-months post admission, those with a non-MVA mechanism of injury were more likely to have higher self-care QoL domain scores (more likely to have poorer self-care) than those with an MVA mechanism of injury (OR 6.02, 95% CI 1.06-34.1, p = 0.043; Table A.3). For those with an MVA mechanism of injury, self-care QoL scores were significantly lower (i.e., better self-care) at each time point than at all previous time points.
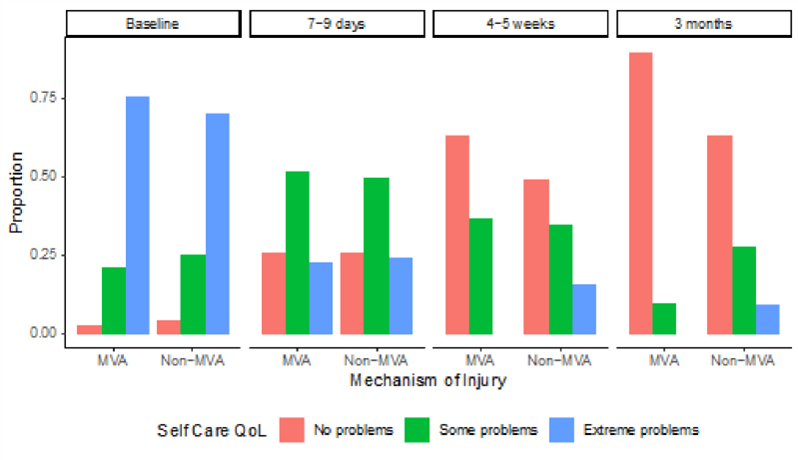
Figure 2: Proportions of patients with each Self-Care QoL score broken down by mechanism of injury and time
|
Comparison |
OR (95% CI) |
P-Value |
|
Within MVA mechanism of injury: comparison between time points |
||
|
7-9 days vs admission |
0.03 (0.01, 0.09) |
<.001 |
|
4-5 weeks vs admission |
0.002 (0.000, 0.009) |
<.001 |
|
3 months vs admission |
0.0002 (0.0000, 0.0013) |
<.001 |
|
4-5 weeks vs 7-9 days |
0.07 (0.02, 0.25) |
<.001 |
|
3 months vs 7-9 days |
0.007 (0.001, 0.038) |
<.001 |
|
3 months vs 4-5 weeks |
0.09 (0.02, 0.50) |
0.006 |
|
Within non-MVA mechanism of injury: comparison between time points |
||
|
7-9 days vs admission |
0.04 (0.02, 0.10) |
<.001 |
|
4-5 weeks vs admission |
0.010 (0.003, 0.029) |
<.001 |
|
3 months vs admission |
0.003 (0.001, 0.011) |
<.001 |
|
4-5 weeks vs 7-9 days |
0.25 (0.12, 0.54) |
<.001 |
|
3 months vs 7-9 days |
0.08 (0.03, 0.20) |
<.001 |
|
3 months vs 4-5 weeks |
0.59 (0.17, 2.10) |
0.418 |
|
Comparison between mechanisms of injury at each time point (Non- MVA vs MVA) |
||
|
Admission |
0.30 (0.08, 1.14) |
0.078 |
|
7-9 days |
0.48 (0.15, 1.52) |
0.212 |
|
4-5 weeks |
1.68 (0.48, 5.95) |
0.418 |
|
3 months |
6.02 (1.06, 34.1) |
0.043 |
Table A.3: Interaction results between time and mechanism of injury from the multivariate model (also adjusted for age, baseline function and baseline ASIA) on Self-Care.
Usual Activities
Usual activities improved over time (Figure 1 and Table A.2). Specifically, patients had significantly lower usual activities QoL domain scores (i.e., better usual activities) at every time point compared to any earlier time point (p < 0.001). Comparing each time point interval, the rate of improvement of usual activities scores was the largest between the 7-9 days and 4-5 weeks interval (OR 0.021, 95% CI 0.10-0.44, p < .001; Table A.2). Other than baseline ASIA, there were no statistically significant relationships between any of the other patient or injury factors with the mobility QoL domain (see Table A.2).
Pain/Discomfort
Patients had lower pain and discomfort QoL domain scores at 4-5 weeks and 3 months when compared to admission and 7-9 days (Figure 1 and Table A.2). The rate of improvement of pain/discomfort scores was the largest between the 7-9 days and 4-5 weeks interval (OR 0.44, 95% CI 0.24-0.82, p = .009; Table A.2). There were no associations between any of the patient or injury factors with the pain and discomfort QoL domain (Table A.2).
Anxiety/Depression
Anxiety/depression QoL domain scores were lower (i.e., better QoL) at 4-5 weeks and 3 months when compared to admission, and when comparing 3 months to 7-9 weeks (Figure 1 and Table A.2). Multivariately, time, gender, clinical frailty scale, living alone, and highest level of injury were associated with the anxiety/depression QoL domain (see Table A.2).
Overall QoL
(Figure 3) shows the overall QoL scores over time. On multivariate analysis, baseline function and an interaction between baseline ASIA and time (p = 0.025) were associated with the overall QoL domain (see Figure 4 and Table A.4). Those participants independent at baseline had a lower overall QoL score (i.e., better overall QoL) than those that were supported at baseline (MD -1.59, 95% CI -2.30 to -0.89, p < .0001; Table A.2).
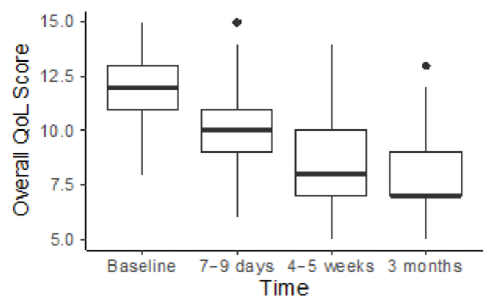
Figure 3: Overall QoL Scores over time
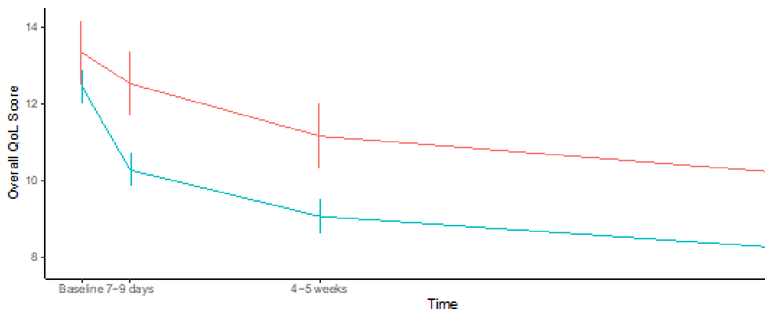
Figure 4: Means and 95% confidence intervals of overall QoL score over time, categorised by baseline ASIA estimated from the model (i.e., these values are averaged over baseline function levels).
|
Comparison |
MD (95% CI) |
P-Value |
|
Within baseline ASIA A-D: comparison between time points |
||
|
Admission – 7-9 days |
0.81 (-0.08, 1.71) |
0.0755 |
|
Admission – 4-5 weeks |
2.19 (1.29, 3.08) |
<.0001 |
|
Admission – 3 months |
3.19 (2.29, 4.08) |
<.0001 |
|
7-9 days – 4-5 weeks |
1.38 (0.48, 2.27) |
0.0028 |
|
7-9 days – 3 months |
2.37 (1.48, 3.27) |
<.0001 |
|
4-5 weeks – 3 months |
1 (0.1, 1.9) |
0.0289 |
|
Within baseline ASIA E: comparison between time points |
||
|
Admission – 7-9 days |
2.19 (1.8, 2.58) |
<.0001 |
|
Admission – 4-5 weeks |
3.4 (3.01, 3.79) |
<.0001 |
|
Admission – 3 months |
4.26 (3.87, 4.66) |
<.0001 |
|
7-9 days – 4-5 weeks |
1.21 (0.82, 1.61) |
<.0001 |
|
7-9 days – 3 months |
2.07 (1.67, 2.47) |
<.0001 |
|
4-5 weeks – 3 months |
0.86 (0.46, 1.26) |
<.0001 |
|
Comparison between baseline ASIA A-D and E at each time point (A-D vs E) |
||
|
Admission |
0.89 (0.02, 1.75) |
0.0452 |
|
7-9 days |
2.26 (1.39, 3.13) |
<.0001 |
|
4-5 weeks |
2.1 (1.23, 2.97) |
<.0001 |
|
3 months |
1.96 (1.09, 2.84) |
<.0001 |
Table A.4: Interaction results between time and baseline ASIA from the multivariate model (also adjusted for baseline function) on Overall QoL.
Overall QoL score was significantly greater (worse overall QoL) in those with an SCI (ASIA A-D) compared to non-SCI (ASIA E) patients at all time points except at admission (i.e., this difference was greater at 7-9 days, 4-5 weeks and 3 months). Comparing each time point interval, the rate of improvement of overall QoL scores in SCI patients was the largest between the 7-9 days and 4-5 weeks interval (MD 1.38, 95% CI 0.48-2.27, p < .003; Table A.4) while the largest rate of improvement of overall QoL scores in non-SCI patients was between the admission and 7-9 days interval (MD 2.19, 95% CI 1.8-2.58, p < .0001; Table A.4).
Visual Analogue Scale (VAS)
(Figure 5) shows the VAS ratings over time. Following multivariate analysis, time, baseline function and baseline ASIA were associated with VAS. Specifically, VAS increased over time, where each time point had significantly greater VAS than at all previous time points (p < .0001; Table A.2). Comparing each time point interval, the rate of improvement of VAS ratings was the largest between the 7-9 days and 4-5 weeks interval (MD 13.78, 95% CI 8.99-18.57, p < .0001; Table A.2). Other than baseline functional status and baseline ASIA, there were no statistically significant relationships between any of the other patient or injury factors with VAS ratings (see Table A.2).
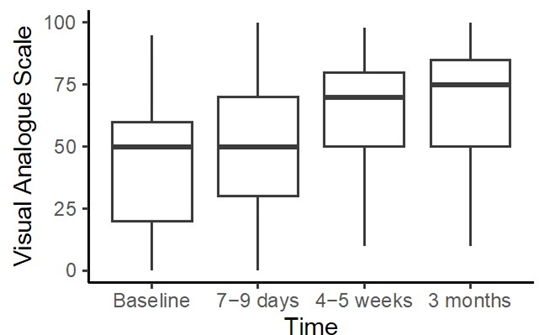
Figure 5: Visual Analogue Scale (VAS) ratings over time
Discussion
This study aimed to assess the changes over time in QoL in patients with traumatic spinal injuries both with and without associated spinal cord injury. These changes were observed across the pre-operative, post-operative and post-inpatient rehabilitation stages, and identified demographic-, injury- and treatment-related factors that were associated with these changes. On average, all QoL domains showed considerable improvement over the initial three months after injury, with ‘mobility’, ‘self-care’ and ‘usual activities’ ratings showing greatest improvement.
The rate of change for ‘pain/discomfort’ and ‘anxiety/depression’ domains differed only showing improvements by the 4–5-week follow-up timepoint. This is in keeping with another study that tracked the QoL ratings of individuals with spinal cord injuries at 6 weeks, 12 weeks, 1 year, and 2 years post injury [23]. They also found that the physical component of QoL improved in the shortterm but also in the long-term post injury period. This implies that perceived physical QoL may continue to improve for spinal cord injured patients after the initial rehabilitation phase. However, Lude and colleagues’ results showed that psychological QoL after spinal cord injury remains below the general population reference norms for as long as one-year post-injury [23]. Overall, while our study suggests that there may be some improvements in anxiety and depression after 4-5 weeks post-injury, the mental health wellbeing of patients may continue to be poor when compared with the general population. We found that ‘Overall QoL’ rating (as determined by the combination of measures of mobility, ability for self-care and return to usual activities) demonstrated relatively faster improvement compared with the more subjective ‘VAS’ rating of overall health. This may result from the VAS rating reflecting a greater component of psychological morbidity, that demonstrated slower improvement. In a previous study, patients with thoracic fractures without significant neurological injury (i.e., ASIA D and E), demonstrated disability on the Oswestry Disability Index but their QoL (on the 36-Item Short-Form Health Survey) did not differ from population norms even at 6-years post-injury [24]. However, in contrast, those patients with thoracic fractures with significant neurological injury (i.e., ASIA A to C) reported significantly poorer QoL relative to population norms at 6-years post-injury [24].
Another study revealed similar findings. Using the 36-Item ShortForm Health Survey (SF-36), they found that individuals with SCI have poorer physical function compared with the general population. They also expressed greater pain and poorer general health. Unexpectedly, their mental health scores were not worse compared with the general population [25]. The results of our study are broadly consistent with these findings, as there were only associations between baseline ASIA and the domains of ‘mobility’, ‘self-care’ and ‘usual activities’, but not ‘pain/discomfort’ and ‘anxiety/depression’. To the best of our knowledge, a direct comparison of QoL in SCI vs non-SCI in the subacute phase has not previously been reported in the literature. Our study suggests that the rate of improvement in general QoL in non-SCI is greater than that seen in the SCI sub-sample. This is consistent with reports of poor QoL after SCI [2,9-11]. Interestingly, the QoL outcomes did not differ whether individuals received surgical intervention or not. Although surgical intervention is usually recommended to achieve spinal alignment, nerve decompression and/or stabilisation of the spine, a secondary benefit would be to prevent an SCI [26]. The present study provides support to proceed with surgery to prevent SCI in an unstable patient as the outcomes of having an SCI are poorer. Nonetheless, this should be balanced against the perioperative risk associated with surgery. Furthermore the severity of the injury and the management options are linked with outcomes after spinal injuries irrespective of demographic variabilities and could affect QoL [27].
We found that the MVA subgroup showed faster and more improvements across all time points, whereas individuals in the non-MVA subgroup showed slower gains in ‘self-care’ and their rate of recovery appeared to have plateaued earlier with less gains over time relative to the MVA sub-group. While there is no clear explanation why this interaction was only evident in the ‘self-care’ QoL domain, the presence of the interaction suggests different baseline characteristics in the MVA vs non-MVA subgroups. It may be that people who fall as their source of injury have greater frailty and disability and have lower baseline functional status compared to individuals in the MVA group resulting in a slower recovery of ‘self-care’ QoL.
Limitations
We recognise several limitations in our study. The first is that the majority of participants suffered a non-spinal cord injury with only 15% of participants having a SCI. These small numbers prevented further subset analyses.
The second is the short study duration. While longitudinal research on QoL in spinal injuries is sparse, it has been demonstrated that recovery and QoL improvements post-spinal injury have been recorded up to two years post-spinal injury[23]. Patients may take more than three months to adapt following a spinal injury. Our study focused on QoL changes up to 3 months post-spinal injury, including the initial acute and subacute periods encompassing any surgical intervention and rehabilitation. Unfortunately, we are unable to comment on any QoL changes in patients occurring after this initial 3-month period, including the time of outpatient rehabilitation.
Conclusion
This study analysed QoL after spinal injuries over the initial three months post-injury. By three-month follow-up, all participants had an improvement in self-rated QoL. However, there was some discordance between physical and psychological domains. There were poorer outcomes in physical domains such as mobility, self-care usual activities were noted in SCI participants, whereas psychological domains such as pain/discomfort and anxiety/ depression were similar between SCI and non-SCI groups. Outcomes of those requiring surgery to prevent SCI had equivalent QoL ratings on five outcome domains relative to those who had less severe spinal injuries (i.e., not requiring surgery).
References
- Algahtany M, McFaull S, Chen L, Zhang S, Saarela O, et all (2021) The changing etiology and epidemiology of traumatic spinal injury: A population-based study. World Neurosurg. 149: e116-127.
- Tee JW, Chan CH, Gruen RL, Fitzgerald MC, Liew SM, et all (2014) Early predictors of health-related quality of life outcomes in polytrauma patients with spine injuries: a level 1 trauma center study. Global Spine J. 4: 21-32.
- Lee BB, Cripps RA, Fitzharris M, Wing PC (2014) The global map for traumatic spinal cord injury epidemiology: update 2011, global incidence rate. Spinal Cord.52: 110-116.
- Harrison J, O’Brien D, Pointer S. (2017–18) Spinal cord injury, Australia. Injury research and statistics series no. 136.Cat. no.INJCAT 219. Canberra:AIHW.
- New PW, Farry A, Baxter D, Noonan VK (2013) Prevalence of nontraumatic spinal cord injury in Victoria, Australia. Spinal Cord. 51: 99102.
- Cieza A, Kirchberger I, Biering-Sørensen F, Baumberger M, Charlifue S, et all (2010) ICF Core Sets for individuals with spinal cord injury in the long-term context. Spinal Cord. 48: 305-312.
- Whiteneck G, Meade MA, Dijkers M, Tate DG, Bushnik T, et all (2004) Environmental factors and their role in participation and life satisfaction after spinal cord injury. Arch Phys Med Rehabil. 85: 1793-1803.
- Richard-Denis A, Beauséjour M, Thompson C, Nguyen BH, MacThiong JM (2018) Early predictors of global functional outcome after traumatic spinal cord injury: a systematic review. J Neurotrauma. 35:1705-1725.
- Leduc BE, Lepage Y (2002) Health-related quality of life after spinal cord injury. Disabil Rehabil. 24:196-202.
- Whalley Hammell KR (1992) Psychological and sociological theories concerning adjustment to traumatic spinal cord injury: the implications for rehabilitation. Spinal Cord. 30: 317-326.
- Tschoepe R, Benfield A, Posey R, Mercer V (2021) A Systematic Review of the Effects of Community Transition Programs on Quality of Life and Hospital Readmissions for Adults With Traumatic Spinal Cord Injury. Arch Phys Med Rehabil. 103:1013-1022.
- Dijkers MP (2005) Quality of life of individuals with spinal cord injury: a review of conceptualization, measurement, and research findings. J Rehabil Res Dev. 42:87-110.
- Post M, Noreau L (2005) Quality of life after spinal cord injury. J Neurol Phys Ther. 29: 139-146.
- Kreuter M, Siösteen A, Erkholm B, Byström U, Brown DJ (2005)Health and quality of life of persons with spinal cord lesion in Australia and Sweden. Spinal Cord. 43: 123-129.
- Marino RJ, Barros T, Biering-Sorensen F, Burns SP, Donovan WH, et all (2003) International standards for neurological classification of spinal cord injury. J Spinal Cord Med. 26: S50-56.
- Rockwood K, Song X, MacKnight C, Bergman H, Hogan DB, et all (2005)A global clinical measure of fitness and frailty in elderly people. Cmaj. 173: 489-495.
- Charlson M, Szatrowski TP, Peterson J, Gold J (1994) Validation of a combined comorbidity index. J Clin Epidemiol. 47: 1245-1251.
- Folstein MF, Folstein SE, McHugh PR (1975) “Mini-mental state”: a practical method for grading the cognitive state of patients for the clinician. J Psychiatry Res. 12: 189-198.
- TEQ Group (1990) EuroQol-a new facility for the measurement of health-related quality of life. Health Pol. 16: 199-208.
- Németh G (2006) Health related quality of life outcome instruments. Eur Spine J. 15: S44-51.
- Connell S. ICHOM Connect (Low Back Pain Forum). [cited 2022 Aug 20].
- R Core Team (2022) R: A language and environment for statistical computing. R Foundation for Statistical Computing, Vienna, Austria.
- Lude P, Kennedy P, Elfström M, Ballert C (2014) Quality of life in and after spinal cord injury rehabilitation: A longitudinal multicenter study. Top Spinal Cord Inj Rehabil. 20: 197-207.
- Schouten R, Keynan O, Lee RS, Street JT, Boyd MC,et all(2014) Health-related quality-of-life outcomes after thoracic (T1–T10) fractures. Spine J. 14:1635-1642.
- LeDuc BE, LePage Y (2002) Health-related quality of life after spinal cord injury. Disabil Rehabil. 24:196-202.
- Cristante AF, Barros Filho TE, Marcon RM, Letaif OB, Rocha ID (2012) Therapeutic approaches for spinal cord injury. Clinics. 67:1219-1224.
- O’Hanlon A, Trevenen M, Altaf F, Flicker L, Iddagoda M (2024) The Association Between Injury Characteristics and in-Patient Outcomes in a Cohort of Adult Patients Admitted to a State Spinal Unit Following Spinal Injuries: A Retrospective Observational Study. Advanced Spine Journal. 43: 2.
© by the Authors & Gavin Publishers. This is an Open Access Journal Article Published Under Attribution-Share Alike CC BY-SA: Creative Commons Attribution-Share Alike 4.0 International License. Read More About Open Access Policy.