Breaking The Cycle: A Dietary Approach To Modulating The Microbial-Immune Crosstalk In A Patient With Crohn’s And Autism
by Shaikha Alabduljabbar1#, Nadhir Mohammed Djekidel1#, Salma H Ahmed1, Nour Shallouf1, Manoj Kumar1, Duaa Elhag1, Marwa Saadaoui1, Nazira Ibrahim2, Mamoun Elawad2, Souhaila Al Khodor1§, Annalisa Terranegra1§*
1Translational Medicine Department, Sidra Medicine, Doha, Qatar
2Gastroenterology, Hepatology and Nutrition Division, Sidra Medicine, Doha, Qatar
# Equal first authors
§Equal senior authors
*Corresponding author: Annalisa Terranegra, Translational Medicine Department, Sidra Medicine, Doha, Qatar
Received Date: 13 August 2025
Accepted Date: 18 August 2025
Published Date: 20 August 2025
Citation: Alabduljabbar S, Djekidel NM, Ahmed SH, Shallouf N, Kumar M, et al. (2025). Breaking The Cycle: A Dietary Approach To Modulating The Microbial-Immune Crosstalk In A Patient With Crohn’s And Autism. Ann Case Report. 10: 2378. https://doi.org/10.29011/2574-7754.102378
Abstract
This case report examines the beneficial effects of a self-prescribed restricted diet (RD) on disease progression, gut microbiome composition, and systemic immune responses in a pediatric patient with Crohn’s disease (CD) and autism. Over a two-year period of dietary intervention, the patient maintained sustained clinical remission (visits 1-4), followed by disease relapse upon reintroduction of a free diet (FD) at visit 5. The RD included selected animal products, cooked vegetables, fresh fruits, legumes, beans, and healthy fats, while excluding white bread, rice, pasta, cereal, fresh vegetables, caffeine, processed foods, milk, fast food, and fizzy drinks. During remission, longitudinal microbiome analysis revealed a progressive stabilization of gut microbial ecology, marked by a shift from the phylum Bacteroidota to the Firmicutes, mainly dominated by Lachnospiraceae and Bifidobacterium species. Similarly, the oral microbial profile showed an increase in the Firmicutes, notably Streptococcus thermophilus and Lactobacillus crispatus. The microbiome recovery paralleled the transcriptomic shifts, wherein gene expression profiles also began to normalize, particularly in pathways related to immune modulation and metabolic homeostasis. The blood transcriptome analysis at V3 showed a downregulation of pro-inflammatory biomarkers, reduced activity of macrophages versus an increased activity of T cells CD4+, CD8+, and Tregs. Metabolic and neurological pathway analysis revealed downregulation of insulin signaling and apoptosis alongside enhanced neurotransmission (dopamine, norepinephrine, serotonin) and gap junction assembly. Together, these patterns suggest that specific dietary regimens may promote clinical remission in CD symptoms by rebalancing the microbiome-immune cross-talks. The observed relapse upon cessation of the restricted diet underscores the potential role of personalized nutrition in disease management, warranting further investigation into microbiome-directed dietary therapies for CD-autistic patients.
Keywords: Inflammatory Bowel Disease; Crohn’s diseases; Autism; Diet; Microbiome; Immune transcriptome.
Introduction
Crohn’s disease (CD) is a subtype of inflammatory bowel disease (IBD) characterized by transmural inflammation that can affect any segment of the gastrointestinal tract, most commonly the terminal ileum and colon [1], resulting in symptoms such as abdominal pain, severe diarrhea, weight loss, and malnutrition [2, 3]. The pathophysiology is complex, including both genetic and environmental factors [4]. Dietary interventions play a pivotal role in CD management [5]. Specialized diet therapies have been developed for CD [6]. Exclusive enteral nutrition (EEN), the initial line of management for inducing remission in pediatric CD, achieves efficacy through anti-inflammatory and microbiomemodulating effects [7-9]. However, for those who are intolerant to EEN, alternative dietary strategies such as the Crohn’s Disease Exclusion Diet (CDED) and CD treatment-with-eating diet (CDTREAT) have emerged [10]. CDED restricts pro-inflammatory dietary components, including animal fats, gluten, maltodextrin, and emulsifiers known to be linked to microbial dysbiosis, intestinal barrier disruption, and immune activation [11, 12]. When combined with partial enteral nutrition (PEN), CDED achieves remission rates of up to 80% [13, 14]. In contrast, CD-TREAT mimics EEN’s composition while excluding gluten and lactose, though further validation is needed [10]. Current guidelines prioritize EEN, reserving CDED+PEN for patients preferring solid food [15]. Another notable approach, the Specific Carbohydrate Diet (SCD), originally designed for celiac disease, has been repurposed for IBD [16, 17]. SCD restricts or excludes intakes of grains, fiber, sugars (mainly lactose and sucrose), all refined and processed foods (e.g., processed meats, canned foods, artificial sweeteners), along with soy, and further limits the intake of certain vegetables (such as potatoes and other starchy vegetables) and dairy products (except for hard cheese and homemade yogurt fermented for 24 hours) [18-20]. Despite promising outcomes, patient responses to these diets are heterogeneous, underscoring the need for precision nutrition strategies tailored to individual microbiomes and immune profiles.
The composition of the human gut microbiota and its metabolites play a critical role in human health and the development of diseases, impacting the immune response and intestinal barrier integrity [2124]. This is particularly true for gastrointestinal (GI) tract disorders, such as CD [25-27]. Any different therapies used for CD have been shown to impact the gut microbiome composition including antibiotics, biological therapy, and nutritional interventions such as EEN and CDED+PEN [28, 29]. Beyond the gut, perturbations in the oral microbiome have been implicated in CD pathogenesis, with Streptococcus and Prevotella identified as overlapping discriminators across stool, saliva, and mucosal samples [30, 31].
The diversity and composition of both gut and saliva microbiomes are influenced by the quantity and types of foods and nutrients [3234]. The microbiome is considered a key mediator in the crosstalk diet-immune response, as specific dietary regimens influence inflammatory status, mainly via the microbiota modulation [35]. This complex interaction can explain the beneficial effect of restricted dietary regimens, such as CDED and CD-TREAT, on CD. The precise mechanism remains elusive, and any emerging evidence contributes to deciphering their underlying complexity.
Here, we present a pediatric CD case in which a self-prescribed restricted diet (RD) correlated with clinical remission, microbiome stabilization, and immunomodulation effects that reversed upon dietary cessation. This case highlights the potential for personalized dietary strategies to rebalance host-microbiome-immune axes in CD patients.
Materials and Methods
Recruitment and clinical assessment
The patient was referred to the Gastroenterology and Nutrition
Division at Sidra Medicine, where he was diagnosed with CD L3, B1 based on the Montreal Classification [36]. The disease progression was assessed using clinical, endoscopic, histological, radiological, and calprotectin assessments. In 2018, the patient was enrolled in an observational study investigating the role of gut and oral microbiota in IBD. Over the course of five clinical visits, longitudinal data and samples were collected. Outside the study protocol, the patient independently adopted a self-prescribed restricted diet (RD) for approximately two years, which was assessed for the purpose of this case report.
Dietary assessment
The dietary intake was assessed by using the 24-hour recall (24HRs) and Food Frequency questionnaire (FFQ) at 2 timepoints: visit 1 (self-prescribed RD) and visit 5 free diet (FD). The dietary data were collected by trained staff and used to compute the nutrient intake by Nutritionist Pro (Axxya Inc.) software. The FFQ measures the frequency and portion sizes of 30 food items consumed on a weekly basis. The diet quality was defined using the Healthy Eating Index (HEI) and Dietary Inflammatory Index (DII), calculated from the FFQ and 24HRs, at both time points. HEI reflects the adherence of the diet to the American dietary recommendations, a higher HEI score shows a high-quality diet and vice versa [37, 38]; DII reflects the inflammatory potential of the diet, with lower DII score suggesting an anti-inflammatory diet, whereas a higher score indicates a pro-inflammatory diet [38].
Description of diet regimens
As reported in the 24HRs and the FFQ, the self-prescribed (RD) consisted of selected animal products, cooked vegetables, fresh fruits, legumes and beans, healthy fats, an adequate amount of water, reduced or a null intake of white bread, rice, pasta, cereal, fresh vegetables, caffeine, processed foods, milk, fast food and fizzy drinks. Furthermore, the patient consumed some special homemade recipes, like almond-flavored bread without wheat flour and a homemade yogurt rich in probiotics (shown in Supplementary Table S1). The free diet consisted of consuming various kinds of foods, including processed foods, carbs, milk, fresh vegetables, sweets and fast food (shown in Supplementary Table S2).
Collection of clinical parameters
Weight, height, BMI percentile, calprotectin, endoscopy and histological assessment, disease status, symptoms, and patient well-being data were collected from the medical records and questionnaires at each clinical visit.
Microbiome profiling and analysis
The microbiome was assessed using 16S rDNA-sequencing on the Illumina MiSeq platform, with stool samples collected from visit 1 to visit 3, and saliva samples collected from visit 1 to visit 5. Microbial DNA was extracted with the QIAamp Fast DNA Stool Mini Kit (Qiagen) via combined chemical/mechanical lysis and magnetic‐bead purification. DNA purity (A260/A280) and integrity (1% agarose gel) were confirmed before amplification. The V1–V3 and V3–V4 regions were amplified for saliva and stool samples, respectively. Libraries were prepared with the Illumina Nextera XT kit (FC‑131‑1002), PCR products were purified using AMPure XP beads (Beckman Coulter), pooled equimolarly, and sequenced on the MiSeq. Demultiplexed reads underwent quality control with FastQC [39]. The raw sequencing reads obtained from the saliva and stool samples were processed using the standard Qiime2 and Dada2 pipeline using custom classifiers specific to the amplified regions to generate the amplicon sequence variant (ASV) count table. These classifiers were built using the GreenGenes2 data base (v2022.10). For the stool samples, the classifier was designed to target the V3-V4 regions (V3_F: CCTACGGGNGGCWGCAG, V4_R: GACTACHVGGGTATCTAATCC). For saliva samples, the classifier was tailored for the V1-V3 regions (V1_F: AGAGTTTGATCMTGGCTCAG, V3_R: GWATTACCGCGGCKGCTG). The downstream analysis was conducted using MicrobiotaProcess [40] and mia R packages [41]. To address sequencing bias, ASV counts were normalized to 5,000 reads per sample.
Blood transcriptome profiling and analysis
Total RNA was extracted from whole blood cultures using the PAXgene Blood RNA Kit (Qiagen) and assessed for integrity with the Agilent 2100 Bioanalyzer (RNA 6000 Pico assay). Libraries were prepared with Lexogen’s QuantSeq 3′ mRNA Seq Kit, incorporating oligo(dT) priming, globin depletion, UMI tagging, and single index barcoding, then evaluated by LabChip NGS 3K and KAPA qPCR before sequencing as single end 75 bp reads on an Illumina NextSeq 500. Raw sequencing reads were qualitytrimmed using BBMap toolkit (v38.69). The trimmed reads were then mapped to the human genome GRCh38 using STAR (v2.6.1d) [42]. Reads were then collapsed based on their unique molecular identifiers (UMIs). Counts were generated using HTSeq-count (v0.9.1) and subsequently normalized using Trimmed Mean of M-values (TMM) method from the edgeR package (v4.0.16) [43]. The analysis focused on a customized human inflammation panel of gene from CD genomics [44]. The quanTIseq method [45] was used for immune deconvolution analysis. Pathway analysis was done using the gene variation analysis (GSVA) (v1.50.5) [46] on the MSigDB C2 canonical pathways gene sets [47].
Transcriptome-Microbiome Association Analysis
The mixOmics R package (v6.30.3) [48] was used to estimate associations microbial abundance and Diet. Very sparse dietary elements were excluded using the mixOmics:nearZeroVar function. The multi-block sparse Latent Structure models Discriminant Analysis method (block.splsda) with 2 latent components was used to identify the most associated features [49]. The most associated bacteria and dietary elements on the plsda component one, were used to estimate the association values using the cimDiablo function [50] was plotted using ComplexHeatmap R/Bioconductor package was used for plotting [51].
Results
Case presentation
The study presents a case of a 13-year-old male originally from Asia, who moved to Qatar in 2012. He was born via normal delivery, exclusively breastfed, and introduced to solid foods at six months of age. In 2017, he was referred to the Gastroenterology and Nutrition Division at Sidra Medicine, where he was diagnosed with CD affecting the lower GI tract exhibiting an ileocolonic, non-penetrating, and non-structuring phenotype, corresponding to L3, B1 based on the Montreal Classification. The patient was evaluated at baseline (visit 1) and at each follow-up visit (visits 2-5) for the IBD clinical outcome and anthropometric parameters. The initial symptoms were mild abdominal pain with no patient’s family history related to IBD and treatment included Azathioprine and cholecalciferol supplement. A form of autism spectrum disorder (ASD) was also documented in his medical records; however, detailed neurological assessments and management were conducted in a different hospital, limiting available data on his neurodevelopmental status. At recruitment, the patient was in remission, with fecal calprotectin value of 116 ug/g at visit 1 and remaining in the range of normality throughout the subsequent visits, except at visit 5 at which it was reported as 708 ug/g, an indication of the patient’s relapse (Table 1). The patient
was monitored by calprotectin and endoscopic assessment was done only if these indices indicated relapse. Endoscopic imaging was performed at visit 5 to confirm relapse diagnosis following elevated fecal calprotectin levels (Figure 1), whereas during remission, fecal calprotectin was solely used as a diagnostic tool. Anthropometric measurements remained stable throughout the study period. Baseline assessment revealed normal growth parameters (BMI at 36th percentile), with all subsequent measurements maintaining a healthy weight trajectory despite minor fluctuations. At recruitment, the patient was under medication, Azathioprine, and Cholecalciferol, then discontinued in the follow-up visits. The patient reported feeling well, without fatigue or symptoms of depression during the entire study (Table 1). This suggests the RD period was not associated with reduced quality of life or apparent nutritional deficiencies.
|
VISITS |
DATE |
AgE (yEARS) |
BMI PERCE NTIlE |
CAlPR oTECTIN (ug/g) |
DISEASE STATuS |
ABDoMEN PAIN |
TREATMENT |
gENERAl WEll- BEINg |
FEElINg TIRED |
FEElINg DEPRESSED |
|
1ST |
23-Dec- 2018 |
13.58 |
36th |
116 |
Remission |
Mild |
Azathioprine and cholecalciferol |
well |
No data |
No data |
|
2ND |
20-Oct- 2019 |
14.42 |
20th |
40 |
Remission |
no |
None |
well |
no |
no |
|
3RD |
29-Dec- 2019 |
14.58 |
21st |
200 |
Remission |
no |
None |
well |
no |
no |
|
4TH |
19-Jul- 2020 |
15.2 |
17th |
- |
Remission |
no |
None |
well |
no |
no |
|
5TH |
25-Oct- 2020 |
15.42 |
32nd |
708 |
Relapse |
no |
None |
well |
no |
no |
Table 1: Patient’s demographic and clinical data at each visit.
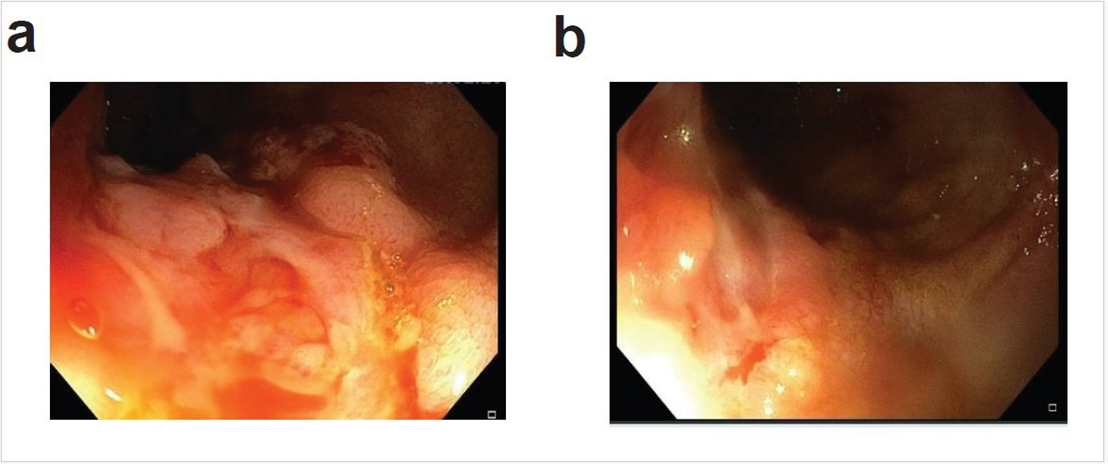
Figure 1: Endoscopic appearance after the patient had indication of relapse on PCDAI and high calprotectin, showing deep ulcers and fissuring in the colon. Two sections of the colon are showed in panels a and b.
Nutrients intakes of the two dietary practices
The patient adhered to the RD from visit 1 to visit 4, then transitioned to FD prior to visit 5. Data from the 24HRs were analyzed to compute the intake of macro- and micronutrients during both RD and FD. The macronutrient analysis indicated a lower caloric intake during RD than FD, with 2600 kcal/day at visit 1 versus 3200 kcal/day at visit 5 (Figure 2a). The higher amounts of calories in the FD were primarily due to a higher intake of proteins and total fats (Figure 2b).
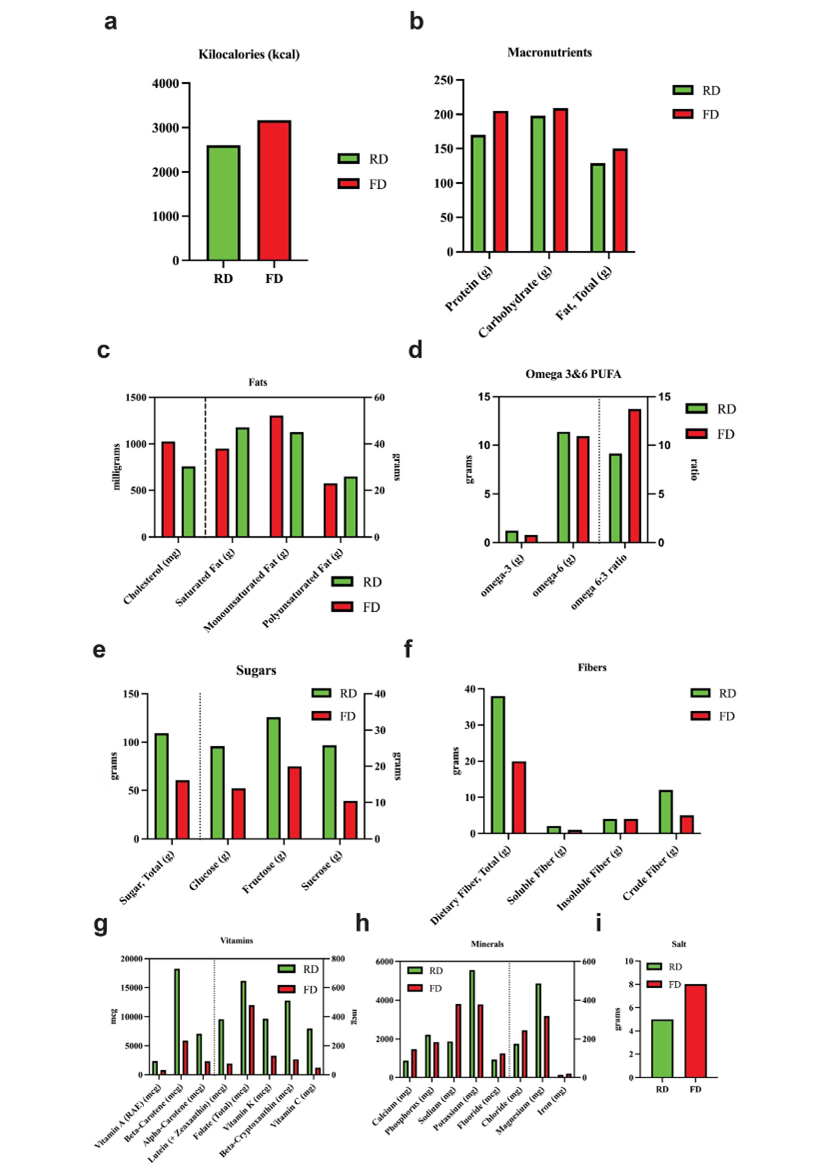
Figure 2: The distribution of the major macronutrients and micronutrients intakes during RD and FD. Panel a: Kcal; Panel b: proteins, carbs, and fats; Panel c: fats components, cholesterol; Panel d: omega-3 and -6 PUFA; Panel e: sugars; Panel f: fibers components (crude, soluble, and insoluble fibers); Panel g: vitamins; Panel h: minerals; and Panel i: salt.
The detailed fat analysis showed a higher consumption of cholesterol (main food source: salmon, cheese, and chicken) in FD, and a higher intake of saturated fats and polyunsaturated fatty acids (PUFA) in RD, mainly sourced from eggs, chicken, salmon, and sunflower oil. Monounsaturated fatty acid (MUFA) intake was shown slightly higher in FD compared to RD. It is notable that omega-3 fatty acids were higher in RD than in FD while omega-6 remained unchanged. Consequently, the omega-6/omega-3 ratio was 9.14 and 13.73 in RD and FD, respectively. The omega-3 fatty acids are derived from chicken, unsalted butter, and almondfloured homemade bread.
The total carbs level showed minimal difference between the two diet regimes, however, in RD, the carbs were derived from fresh fruits, steamed and peeled vegetables, and boiled beans and honey, whereas most carbs in FD were derived from rice, toasted bread, milk, cookies, and fresh fruit. Total sugar level was higher in RD with 109.2g compared to 60.5g in FD, and in particular, glucose, fructose, and sucrose mainly derived from fresh fruits, steamed carrots, boiled green peas, and natural honey. The intake of total dietary fiber revealed a higher level in RD vs FD, with 38.2g as opposed to 19g, mostly contributed by the crude fiber originating from boiled green beans, steamed vegetables, and fresh fruits.
The micronutrient analysis showed a higher level of all vitamins and of some minerals in the RD than in FD. In particular, vitamin A, beta- and alpha-carotene, lutein, total folate, vitamin K, betacryptoxanthin and vitamin C were higher in RD, mainly sourced from steamed broccoli and carrots, orange juice, eggs, unsalted butter, peas, and broccoli. Similarly, the mineral intake indicated that potassium and magnesium are elevated in RD compared to FD, derived mainly from grilled salmon, chicken, green peas, fresh fruits, steamed carrots, and broccoli. The phosphorus level is slightly higher in RD, mostly from grilled salmon, chicken, and eggs. On the other side, sodium and chloride are elevated in FD compared to RD, mostly derived from high-salt food (almondfloured homemade bread, eggs, chicken, and sea salt). As a confirmation, the total salt consumption was higher in FD than RD (7.6g vs 4.7g), mainly from rice, cheddar cheese, processed meat (turkey salami), and chicken. Likewise, calcium, iron, and fluoride levels are higher in FD, primarily sourced from milk and cheddar cheese; fortified cornflakes, rice, and salmon; and drinking water, respectively.
Food Frequency and Dietary patterns across diet regimens
The frequency of food consumption was recorded at both time points using FFQ. During RD, the patient reported higher consumption of fruits, fresh juices, cooked vegetables, nuts, red meat, and eggs compared to FD. The return to FD coincided with a shift in dietary habits: bread consumption changed from homemade bread recipes (using non-wheat flour) to the common white bread; the consumption of homemade yogurt was reduced, whereas poultry and fish intake increased. Furthermore, some food items were introduced in the FD, such as cereal, rice, pasta, potatoes, fresh vegetables, milk, processed food, pizza, fast food, fried potatoes, and chocolate and cookies, which were absent from the RD (Figure 3a). The dietary pattern analysis was conducted from the 24HRs and FFQ using the HEI and DII scores. The results indicated an anti-inflammatory diet (DII = -2.97) when the patient followed the RD, whereas it shifted to a slightly pro-inflammatory profile (DII = -0.65) when the FD was reintroduced. Similarly, a modest difference in HEI scores between the RD (HEI=72) and FD (HEI=67), yet RD reflects a higher overall diet quality compared to the FD (Figure 3b).
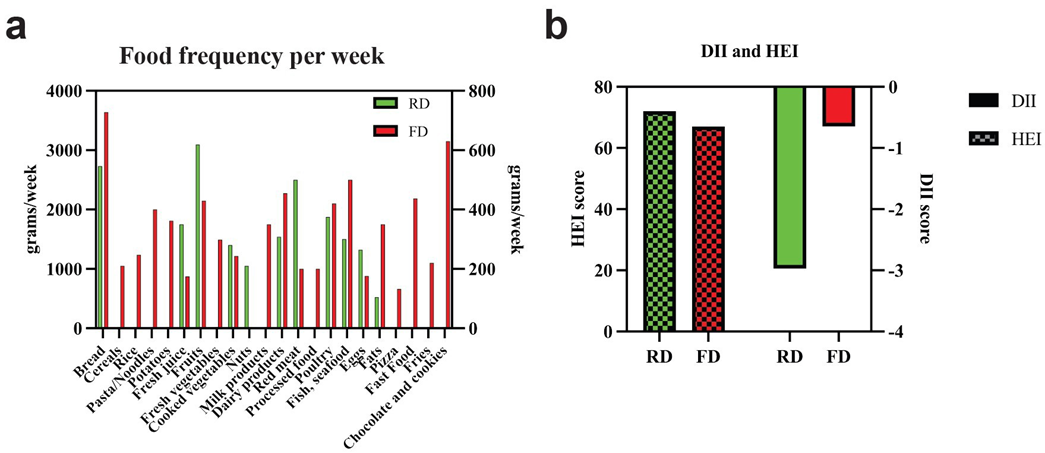
Figure 3. Food frequency intake (grams/week, Panel a) and DII and HEI dietary scores (Panel b) in both RD and FD.
gut microbiome
During the RD period (Visits 1-3), analysis of gut microbiota composition revealed significant temporal changes. The bacterial composition shifted across three visits from a profile mainly dominated by the phylum Bacteroidota and the species Phocaeicola_dorei, with a respective abundance of 62.1% (V1), 59.84% (V2), and 48.79% (V3), to the phylum Firmicutes, specifically the unclassified species from the family Lachnospiraceae (6.48% at V1, 3.08% at V2, and 10.53% at V3), from genera Lachnospira (4.8% at V1, 5.5% at V2 and 3.79% at V3) and multiple species of the genus Faecalibacterium. We also observed the appearance of the species Bifidobacterium longum (0.06% at V1, 0.1% at V2, and 0.66% at V3) and the Bilophila wadsworthia (0% at V1, 0.08% at V2 and 0.66% at V3) (Figure 4a). The enrichment analysis confirmed the increased abundance of the Faecalibacterium species, Butyribacter intestine, Bacteroides uniformis, Bifidobacterium longum, Bilophila wadsworthia, Dialister invisus, unclassified species from the genera Blautia and Roseburia, and the family Lachnospiraceae at V3 compared to V1. Conversely, abundances of species from the genera Clostridium and Haemophilus, and the families Peptostreptococcaceae and Butyricicoccaceae decreased in V3 compared to V1 (Figure 4b). These microbial changes suggest a beneficial modulation of the gut ecosystem during RD, characterized by a more favorable Bacteroidota/Firmicutes ratio, expansion of protective bacterial taxa, and attenuation of potentially harmful bacterial species, possibly contributing to the observed clinical improvements during this dietary intervention period.
oral microbiome
Analysis of the oral microbiota from saliva samples collected during both dietary regimens revealed significant compositional shifts. During the RD period (V1-4), the microbial profile was initially dominated by Proteobacteria, which showed a relative decrease by V4. However, at species level, we observed a fluctuation of abundance of unclassified_Neisseria (28.52% at V1, 18.15% at V2, 18.61% at V3, 5.14% at V4 and 24.55% at V5), Moraxella bovoculi (2.4% at V1, 9.59% at V2, 10.81% at V3, 0.32% at V4 and 4.43% at V5), and Lautropia mirabilis (2.42% at V1, 11.50% at V2, 9.83% at V3, 0.38% at V4 and 0.63% at V5). Visit 4 marked a dramatic transition with Firmicutes becoming predominant, particularly through increased abundance of unclassified_Streptococcus (rising steadily from 3.51% at V1 to 18.61% at V5) and a striking appearance of Lactobacillus crispatus (33.70% at V4, absent at other visits) (Figure 4c). The enrichment analysis showed the most abundant species across the visits including Neisseria cinerea, unclassified_Haemophilus, and unclassified_Porphyromonas at V1; Neisseria oralis and Porphyromonas gingivalis at V2; unknown species HOT-345, Moraxella bovoculi at V3; Prevotella melaninogenica, Cutibacterium acnes, Lactobacillus crispatus, and Streptococcus sanguinis at V4; unclassified_Streptococcus, Streptococcus infantis, and Streptococcus pseudopneumoniae at V5 (Figure 4d).
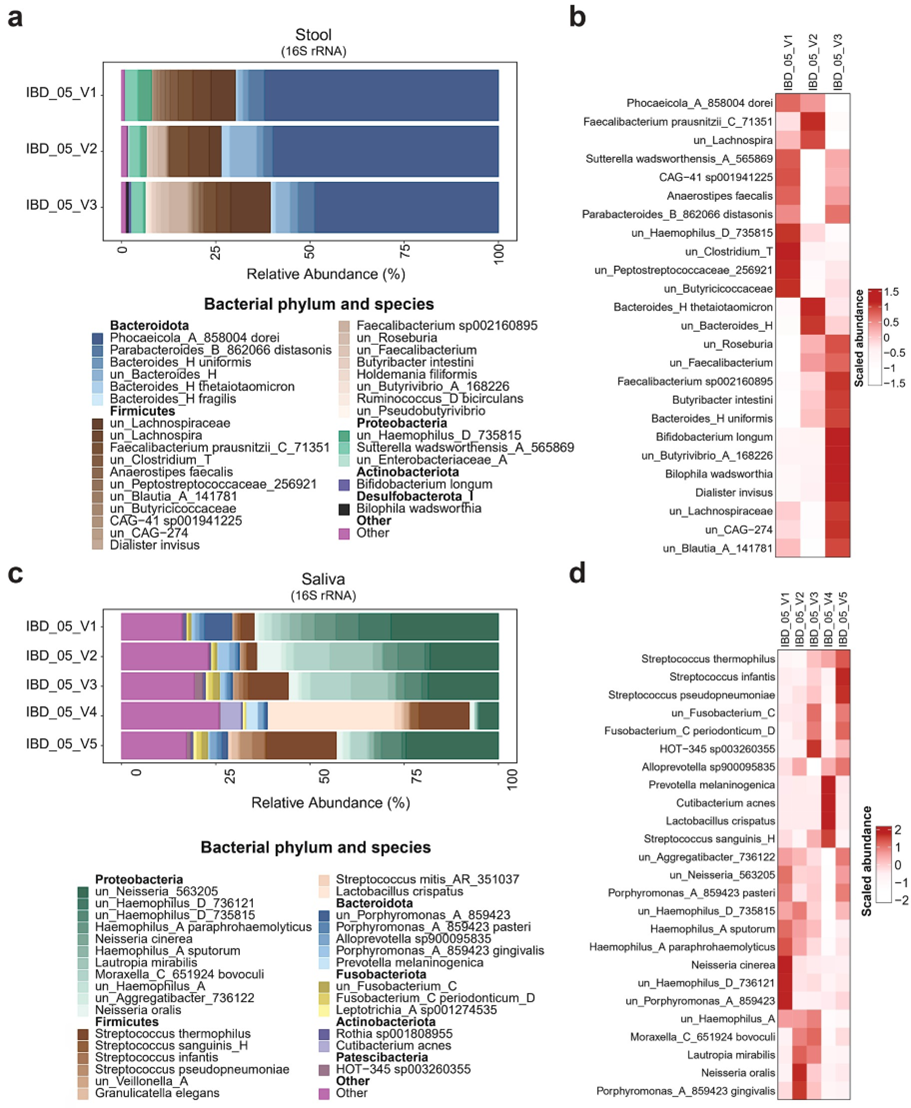
Figure 4: Gut and oral microbiota profiling across study visits. Panel a: Gut microbiota composition at the species level, represented by relative abundance at visits V1-V3. Panel b: Heatmap of enriched gut microbial species at visits V1–V3. Panel c: Oral microbiota composition at the species level, represented by relative abundance at visits V1–V5. Panel d: Heatmap of enriched oral microbial species across visits V1–V5. Note: In heatmaps (Panels b and d), scaled abundance is represented by color intensity, where darker shades indicate stronger positive associations and lighter shades indicate negative associations.
Correlation analysis revealed opposing nutrient-microbe associations between remission (V1-2) and relapse (V5), with several Streptococcus and Prevotella species showing negative correlation with the intake of carbohydrates, vitamins D and E, niacin and a few amino acids at V1-V2, which then shifted to positive correlation at V5. Some nutrients, such as vitamins, carotenoids, polyphenols, and fatty acids showed a strong negative association at V5 compared to V1-V2 (Figure 5a, b), suggesting that the RD may have promoted microbial-nutrient interactions supportive of remission. These findings demonstrate the potential responsiveness of the oral microbiome to dietary changes.
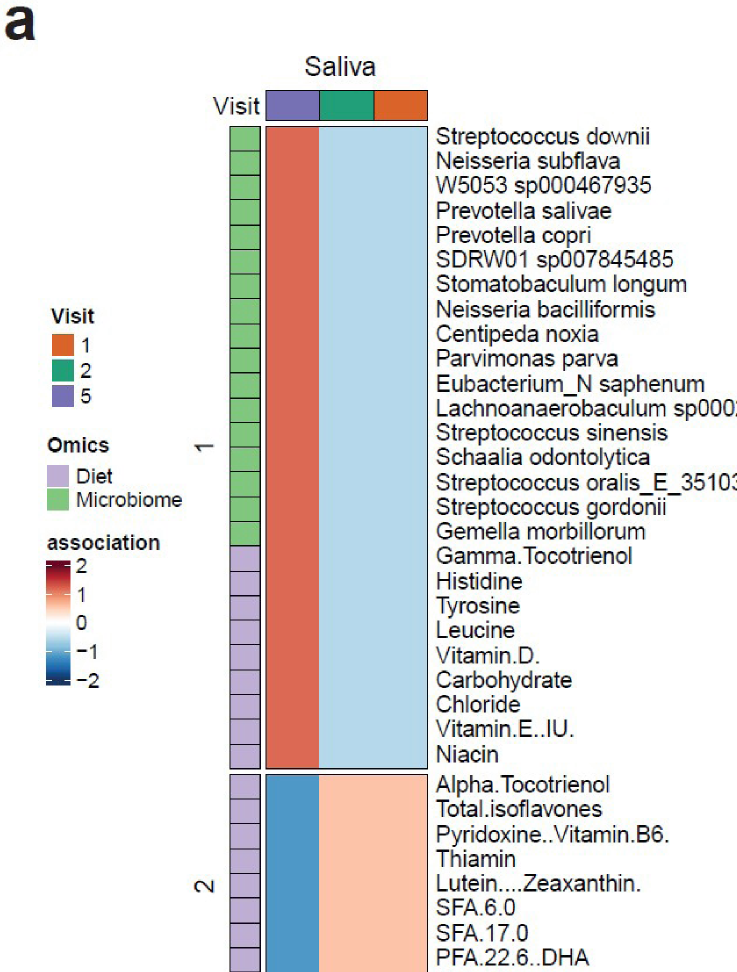
Figure 5: The correlation between nutrients and oral microbiota at visits 1, 2 (RD) and 5 (FD). Color intensity indicates the strength and direction of correlation: darker red represents stronger positive correlations, while darker blue denotes stronger negative correlations. Dark green, orange, and dark purple correspond to visits 1, 2, and 5, respectively. Light purple and light green highlight nutrients and oral microbiota features, respectively.
Blood Immune Transcriptome
Longitudinal blood transcriptome analysis was performed across visits 1-4. The analysis focused on immune function and inflammatory pathways to assess the immunomodulatory effect of diet and microbiome. RD regimen revealed a pronounced immunomodulatory shift at V3, characterized by coordinated downregulation of pro-inflammatory pathways including TNF signaling, interferon-stimulated genes, and interleukin cascades alongside upregulation of immunoregulatory mediators (TGF-β isoforms, cytokine/chemokine ligands) (Figure 6a). This transient reprogramming corresponded with significant immunological changes including a reduced activity of macrophages M1 and M2 and increased activity of T cells CD4+, CD8+, and Tregs at visit 3 followed by a partial reversion at V4 (Figure 6b). Pathway analysis confirmed the downregulation of toll-like receptors (TLR), apoptosis, and insulin pathways, among others, and the upregulation of gap junction assembly, and dopamine, norepinephrine, and serotonin neurotransmitters at V3, which were restored at V4 (Figure 6c). The V4 restoration trend suggests this immune-metabolic reset was diet-dependent, highlighting the RD’s capacity to transiently rebalance inflammatory-adaptive immune crosstalk while modulating neuro-immune axes, a phenomenon potentially relevant to the observed clinical remission.
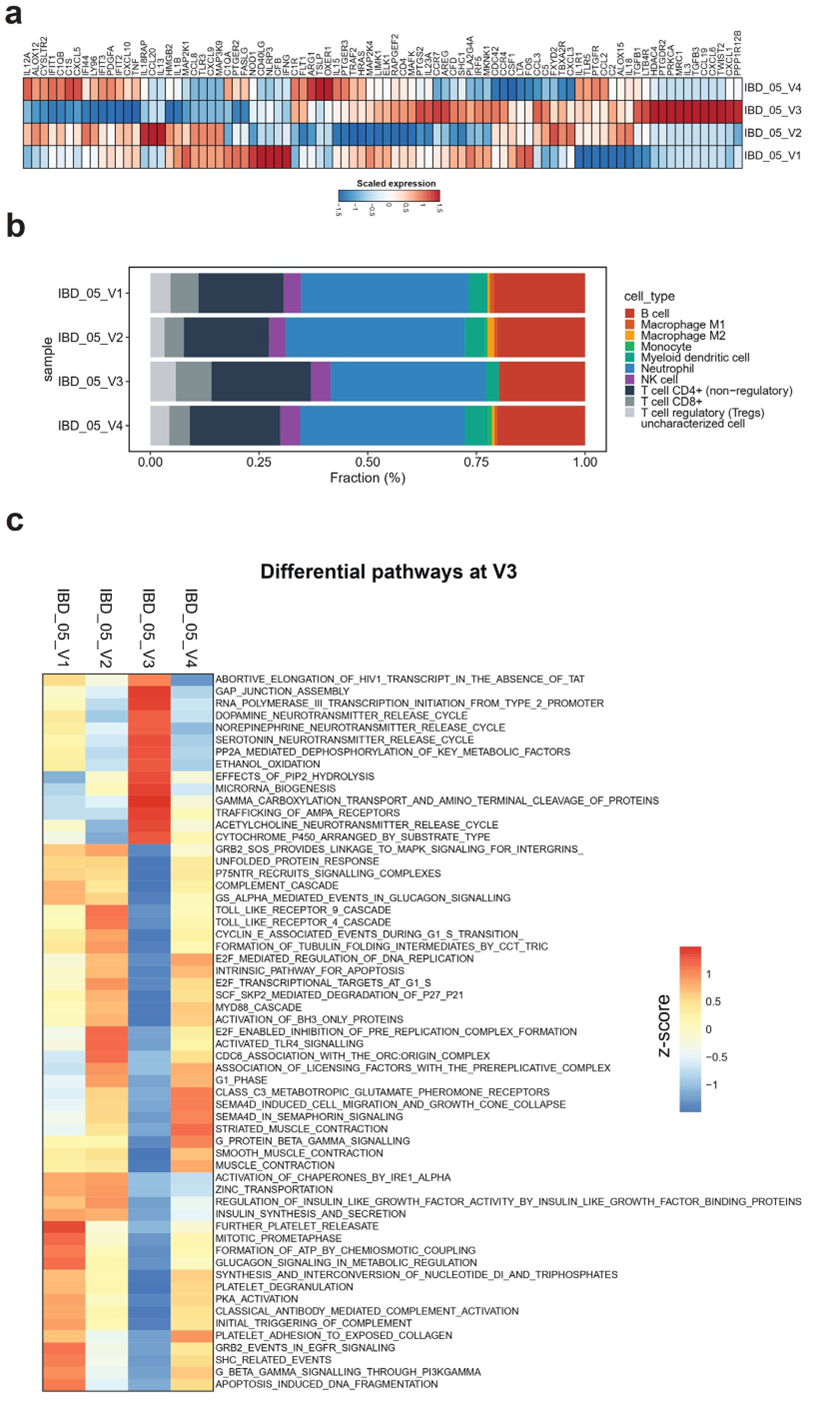
Figure 6: Blood transcriptomic and immunological profiles across study visits. Panel a: Heatmap of transcriptomic expression showing the correlation of gene expression profiles with each visit. Only genes with ≥2-fold change are displayed. Darker red indicates stronger positive associations, while darker blue indicates stronger negative associations. Panel b: Bar plots showing the estimated fraction percentages of immune cell subtypes corresponding to each visit. Panel c: Heatmap of differential pathway activity at visit 3 compared to other visits. Color intensity reflects correlation strength: darker red denotes higher positive correlation; darker blue indicates stronger negative correlation.
Discussion
This case report describes a pediatric patient with CD and comorbid autism who experienced sustained remission during a two-year, self-prescribed RD characterized by the consumption of cooked vegetables, fresh fruits, legumes and beans, healthy fats, an adequate amount of water, reduced intake of animal products, and null intake of white bread, rice, pasta, cereal, fresh vegetables, caffeine, processed foods, milk, fast food, and fizzy drinks. Two years of such a self-prescribed dietary regime coincided with a long period with no disease relapse. The restricted diet induced a strongly anti-inflammatory profile, as reflected by the low DII score (-2.97), which may be associated with the observed remission status. While causation cannot be established, the temporal association between dietary adherence and disease remission coupled with parallel improvements in microbial and immunological profiles. This suggests that the RD may have modulated disease activity through microbiome-immune crosstalk.
The observed clinical benefits align with established dietary therapies for CD, including CDED and CD-TREAT either as alternatives to EEN or in combination with PEN [52, 53]. SCD is efficient in decreasing symptoms in people with mild to moderate Crohn’s disease [19, 20]. The SCD, as described, limits or excludes grains, fiber, sugars, refined and processed foods, and certain vegetables [16]. The reported case followed a 2-year diet that resembled an SCD and confirmed the beneficial effect on the clinical outcomes. The molecular mechanism behind it is still not fully clarified, however, diet is well known to be a major modulator of the microbiome composition [54]. Other dietary regimens, such as CDED, have shown beneficial effects on the gut microbiota composition and metabolites [29, 55]. In the case of our patient, we evaluated changes in the oral and gut microbiota, as well as the blood immune transcriptome, during adherence to and discontinuation of the RD regimen to identify potential biomarkers and pathways involved in disease progression. Gut microbiome analysis indicated a progressive change across the three visits, with a reduction in Bacteroidota and an increase in Firmicutes, particularly species from Lachnospiraceae, Faecalibacterium, and Bifidobacterium, which aligns with expectations following a high-fiber diet modification [56-58]. These species are recognized as short-chain fatty acids (SCFA) producers known for their role in reducing intestinal inflammation, enhancing insulin sensitivity, and promoting satiety [59-62]. Likewise, our observations indicated an improvement in oral microbiome composition during the RD period. Specifically, there was a gradual increase in the phylum Firmicutes, reaching a peak at V4, accompanied by an enrichment of species from the Lactobacillus and Streptococcus genera. Conversely, Proteobacteria levels decreased until they rose again with the introduction of the FD diet at V5. The eubiotic status of both gut and oral microbiota has probably contributed to maintaining the remission status of the patient. Oral microbiome is associated with CD oral manifestations, and it has been indicated as a diagnostic tool for CD [30, 63]. The change in the dietary regimen showed a clear effect on the oral microbiome, with many species from the genera Streptococcus, Prevotella and Neisseria showing a negative correlation with the intake of carbohydrates, vitamins D and E, niacin, and a few amino acids during RD, which changed to a positive correlation in FD. A study investigating the impact of a vegan diet showed similar results, with Neisseria species negatively correlated with intake of starch and fibers [64], which are measured together in our dataset as total digestible and undigestible carbohydrates. When we measured the specific intake of fibers in RD, our data showed a higher intake of total and crude fibers only, and no difference in the total carbohydrates, not allowing us to discriminate between the effects of starch and fibers. Moreover, the fibers did not correlate with any species in the oral microbiome.
Gut microbiome and immune system function in a synchronized manner to maintain the host-microbe symbiosis [65]. In our study, we observed a parallel shift in the expression of genes mainly involved in the immune response and inflammation, with a reduction of the macrophages and an increase in the Treg lymphocytes, controlling the immune response, at V3, and reversed at V4. We have no records of any clinical signs or symptoms that can explain the change in the immune response at V3. This immunological modulation may reflect microbiome-mediated effects, as supported by animal studies demonstrating Bifidobacterium infantis-induced Treg expansion [66]. The deregulation of T cell response and macrophage modifications is associated with IBD [67, 68] through the activation of the TLR signal [65]. At confirmation, we observed a downregulation of multiple TLR and insulin pathways at V3 compared to the other time points. TLR pathways, mediated by microbial elements, are crucial for bacterial clearance and inflammatory responses. Dysregulation of these pathways during early and chronic intestinal inflammation may contribute to the persistent inflammation underlying IBD pathogenesis [69]. In parallel, the pathways analysis showed an enrichment of the release of three major neurotransmitters at V3: serotonin, norepinephrine, and dopamine. It has been found that elevated serotonin levels are implicated in gut inflammation associated with IBD [70] in autistic children and mice models [71-73]. This finding is highly relevant for our patient, who is co-affected by autism along with CD. The risk of coexistence of these two phenotypes was found to be in 47% of children [74]. Unfortunately, we do not have clinical data on the autism progression, however, the family reported behavioral improvements during the RD period and worsening symptoms after FD reintroduction which is consistent with established gutbrain axis mechanisms. This could be due to gut dysbiosis as a result of diet change, as Fulceri et al. showed that gastrointestinal dysfunction in children with ASD has been linked to increased incidences of irritability, anger, and aggressive behavior [75]. The gut-brain axis has been deeply investigated and explains the beneficial effects of a healthy diet and eubiosis on brain function [76]. Research suggests that Bifidobacterium and Lactobacillus species, and butyrate, a SCFA, can help manage neurological disorders, including autism, by reducing neuroinflammation, enhancing neurotransmitter modulation, and improving histone acetylation [77, 78]. In line with these findings, in our patient case, we observed an increased level of various species of Bifidobacteria in the gut and Lactobacilli in the saliva after about 1 year under RD. Microbiome-based therapeutic approaches, both probiotics and fecal material transfer, show promising beneficial effects on autism, reducing gastrointestinal symptoms as well. These observations underscore the potential of precision medicine approaches, utilizing multi-omics data, to enable early diagnosis and intervention in IBD and ASD before the conditions progress to more severe stages. As a major outcome of our investigation, the personalized nutritional approach of this patient confirmed the importance of the diet regimen tailored to personal needs and the baseline microbial and immune profiles. The field of personalized nutrition is receiving growing attention and is being incorporated into clinical practice, demonstrating notable improvements in IBD management [79-81].
This study has both strengths and limitations. It is the first CD case report to combine dietary data assessment with molecular investigations using a multi-omics approach. Additionally, the patient was monitored through multiple visits over approximately 2 years, allowing for analysis of long-term changes in diet regimens, clinical parameters, and the collection of prospective samples for omics analyses. There are some limitations due to sample and data availability. The study lacks gut microbiome data at time points V4 and V5, transcriptome data at V5, and clinical reports on autism diagnosis and progression status across all time points. These missing data points are critical for elucidating the potential role of dietary factors in shaping the microbiome-transcriptome crosstalk and identifying key contributors to the observed molecular and microbial alterations in both phenotypes. Moreover, the dietary data may be affected by bias since it relies on self-reports from the patient’s mother.
Conclusion
In conclusion, while our study cannot establish causality, the concordance of clinical, microbial, and immunological improvements during RD supports the hypothesis that personalized nutrition may beneficially reshape host-microbiome-immune axes in CD. Future prospective cohort studies are needed to confirm these findings on a bigger scale, and clinical trials are required to introduce a personalized nutrition approach as a gold standard in the treatment of CD.
Declarations
Acknowledgments
We thank the study participant and the guardians for their contribution.
We acknowledge the Omics Core Facility at Sidra Medicine for providing mRNA-sequencing service on the Illumina NextSeq 500 platform.
Contributors: SA: Dietary data collection, Investigation, Data Curation, Writing – Original Draft. NMD: Omics and Data Integration Analysis, Visualization. SHA and NS: Dietary Data Analysis. MK, DE and MS: Microbiome and Transcriptome Processing. NI and ME: Investigation, Clinical Data Curation, Writing – Review & Editing. SK: Funding Acquisition, Resources, Supervision, Writing – Review & Editing. AT: Conceptualization, Methodology, Investigation, Resources, Supervision, Writing – Review & Editing.
Conflict of interest
The Authors have no conflicts to declare
Patient consent for publication: Informed consent was obtained from the patient, consent form available upon request.
Ethics approval: The study was approved by Sidra Medicine IRB committee (protocol #2003768 approved on 23/Jan/2023.
Availability of data and materials: Data are available upon request.
Funds: This project was supported by a grant from the Qatar National Research Fund (grant no. NPRP10-0125-170242) to SK.
References
- Saleh L. (2023). Imaging Features of Gastrointestinal Neoplasms Complicating Inflammatory Bowel Diseases. Curr Probl Diagn Radiol. 52: 570-575.
- da Silva JR. (2023). Crohn’s disease and clinical management today: How it does? World J Methodol. 13: 399-413.
- Elhag DA. (2022). Inflammatory Bowel Disease Treatments and Predictive Biomarkers of Therapeutic Response. International Journal of Molecular Sciences. 2022: 23.
- Van Assche G. (2010). The second European evidence-based Consensus on the diagnosis and management of Crohn’s disease: Definitions and diagnosis. J Crohns Colitis. 4: 7-27.
- Godala M. (2022). Dietary Interventions in Inflammatory Bowel Disease. Nutrients, 14: 20.
- Verburgt CM. (2021). Nutritional Therapy Strategies in Pediatric Crohn’s Disease. Nutrients. 13.
- Hacker D. (2024). Exclusive enteral nutrition initiates individual protective microbiome changes to induce remission in pediatric Crohn’s disease. Cell Host Microbe. 32: 2019-2034.
- Xiao F. (2022). Exclusive Enteral Nutrition Exerts Anti-Inflammatory Effects through Modulating Microbiota, Bile Acid Metabolism, and Immune Activities. Nutrients. 14.
- Gong D. (2017). Exclusive Enteral Nutrition Induces Remission in Pediatric Crohn’s Disease via Modulation of the Gut Microbiota. Biomed Res Int, 2017: 8102589.
- Svolos V. (2019). Treatment of Active Crohn’s Disease With an Ordinary Food-based Diet That Replicates Exclusive Enteral Nutrition. Gastroenterology. 156: 1354-1367.
- Sasson AN, Ananthakrishnan AN, Raman M. (2021). Diet in Treatment of Inflammatory Bowel Diseases. Clin Gastroenterol Hepatol. 19: 425435.
- He P. (2022). Dietary Patterns and Gut Microbiota: The Crucial Actors in Inflammatory Bowel Disease. Adv Nutr, 13: 1628-1651.
- Levine A, W El-Matary, Van LJ. (2020). A Case-Based Approach to New Directions in Dietary Therapy of Crohn’s Disease: Food for Thought. Nutrients. 12.
- Levine A. (2019). Crohn’s Disease Exclusion Diet Plus Partial Enteral Nutrition Induces Sustained Remission in a Randomized Controlled Trial. Gastroenterology. 157: 440-450.
- van Rheenen PF, Aloi M, Assa A, Bronsky J, Escher JC. (2021). The Medical Management of Paediatric Crohn’s Disease: an ECCOESPGHAN Guideline Update. J Crohns Colitis. 15: 161.
- Suskind DL. (2014). Nutritional therapy in pediatric Crohn disease: the specific carbohydrate diet. J Pediatr Gastroenterol Nutr. 58: 87-91.
- Haas SV, Haas MP. (1955). The treatment of celiac disease with the specific carbohydrate diet; report on 191 additional cases. Am J Gastroenterol. 23: 344-60.
- Lewis JD. (2021). A Randomized Trial Comparing the Specific Carbohydrate Diet to a Mediterranean Diet in Adults With Crohn’s Disease. Gastroenterology. 161: 837-852.
- Suskind DL. (2018). Clinical and Fecal Microbial Changes With Diet Therapy in Active Inflammatory Bowel Disease. J Clin Gastroenterol. 52: 155-163.
- Suskind DL. (2020). The Specific Carbohydrate Diet and Diet Modification as Induction Therapy for Pediatric Crohn’s Disease: A Randomized Diet Controlled Trial. Nutrients. 12.
- Hou K. (2022). Microbiota in health and diseases. Signal Transduct Target Ther. 7: 135.
- Kumar M, M. Garand, Al Khodor A. (2019). Integrating omics for a better understanding of Inflammatory Bowel Disease: a step towards personalized medicine. Journal of Translational Medicine. 17: 419.
- Takiishi T, C.I.M. Fenero, N.O.S. Camara. (2017). Intestinal barrier and gut microbiota: Shaping our immune responses throughout life. Tissue Barriers, 5: e1373208.
- Zheng D, T Liwinski, E Elinav. (2020). Interaction between microbiota and immunity in health and disease. Cell Res. 30: 492-506.
- Wang X. (2024). The emerging role of the gut microbiota and its application in inflammatory bowel disease. Biomed Pharmacother. 179: 117302.
- Nunez-Sanchez M.A. (2022). Crohn’s Disease, Host-Microbiota Interactions, and Immunonutrition: Dietary Strategies Targeting Gut Microbiome as Novel Therapeutic Approaches. Int J Mol Sci. 23.
- Xu Y. (2025). Role and mechanism of gut microbiota-host interactions in the pathogenesis of Crohn’s disease. Int J Colorectal Dis. 40: 130.
- Fetter K. (2023). The microbiome landscape in pediatric Crohn’s disease and therapeutic implications. Gut Microbes,. 15: 2247019.
- Verburgt CM. (2023). Successful Dietary Therapy in Paediatric Crohn’s Disease is Associated with Shifts in Bacterial Dysbiosis and Inflammatory Metabotype Towards Healthy Controls. J Crohns Colitis. 17: 61-72.
- Hu S. (2022). Oral Microbiome of Crohn’s Disease Patients With and Without Oral Manifestations. J Crohns Colitis. 16: 1628-1636.
- Shin SY. (2022). The Common and Unique Pattern of Microbiome Profiles among Saliva, Tissue, and Stool Samples in Patients with Crohn’s Disease. Microorganisms. 10.
- Danneskiold-Samsoe NB. (2019). Interplay between food and gut microbiota in health and disease. Food Res Int. 115: 23-31.
- Santacroce L. (2023). Oral microbiota in human health and disease: A perspective. Exp Biol Med (Maywood). 248: 1288-1301.
- Zapala B. (2022). The Role of the Western Diet and Oral Microbiota in Parkinson’s Disease. Nutrients, 14.
- Venter C. (2020). Nutrition and the Immune System: A Complicated Tango. Nutrients, 12.
- Satsangi J. (2006). The Montreal classification of inflammatory bowel disease: controversies, consensus, and implications. Gut, 55: 749-53.
- Krebs-Smith SM. (2018). Update of the Healthy Eating Index: HEI2015. J Acad Nutr Diet. 118: 1591-1602.
- Shivappa N. (2014). Designing and developing a literature-derived, population-based dietary inflammatory index. Public Health Nutr. 17: 1689-96.
- Andrews S. (2010). FastQC: a quality control tool for high throughput sequence data. 2010: 10.
- Xu S. (2023). MicrobiotaProcess: A comprehensive R package for deep mining microbiome. Innovation (Camb), 2023. 4: 100388.
- Ernst F SS, Borman T, Lahti L. (2024). mia: Microbiome analysis. R package version 1.12.0. 2024; Available in Online.
- Dobin A. (2013). STAR: ultrafast universal RNA-seq aligner. Bioinformatics. 29: 15-21.
- Robinson MD, DJ McCarthy, GK Smyth. (2010). edgeR: a Bioconductor package for differential expression analysis of digital gene expression data. Bioinformatics, 26: 139-40.
- Genomics C. (2025). Custom Human Inflammation Panel. 2025.
- Finotello F. (2019). Molecular and pharmacological modulators of the tumor immune contexture revealed by deconvolution of RNA-seq data. Genome Med, 11: 34.
- Hanzelmann S, R Castelo, J Guinney. (2013). GSVA: gene set variation analysis for microarray and RNA-seq data. BMC Bioinformatics. 14: 7.
- Liberzon A. (2015). The Molecular Signatures Data base (MSigDB) hallmark gene set collection. Cell Syst. 1: 417-425.
- Rohart F. (2017). mixOmics: An R package for ‘omics feature selection and multiple data integration. PLoS Comput Biol, 13: e1005752.
- Singh A. (2019). DIABLO: an integrative approach for identifying key molecular drivers from multi-omics assays. Bioinformatics. 35: 30553062.
- Gonzalez I. (2022). Visualising associations between paired ‘omics’ data sets. BioData Min. 5: 19.
- Gu Z. (2022). Complex heatmap visualization. Imeta. 1: e43.
- Jijon Andrade MC. (2023). Efficacy of Crohn’s disease exclusion diet in treatment -naive children and children progressed on biological therapy: a retrospective chart review. BMC Gastroenterol. 23: 225.
- Xu D. (2024). Progress and Clinical Applications of Crohn’s Disease Exclusion Diet in Crohn’s Disease. Gut Liver. 18: 404-413.
- Ross FC. (2024). The interplay between diet and the gut microbiome: implications for health and disease. Nat Rev Microbiol, 22: 671-686.
- Ghiboub M. (2022). Metabolome Changes With Diet-Induced Remission in Pediatric Crohn’s Disease. Gastroenterology. 163: 922936 e15.
- Macia L, Tan J, Vieira AT, Leach katie. (2015). Metabolite-sensing receptors GPR43 and GPR109A facilitate dietary fibre-induced gut homeostasis through regulation of the inflammasome. Nat Commun. 6: 6734.
- Lin D, Peters BA, Friedlander C, Freiman HJ. (2018). Association of dietary fibre intake and gut microbiota in adults. Br J Nutr, 2018. 120: 1014-1022.
- So D, Whelan K, Rossi M, Morrison M. (2018). Dietary fiber intervention on gut microbiota composition in healthy adults: a systematic review and meta-analysis. Am J Clin Nutr. 107: 965-983.
- Venegas PD, Fuente MK. (2019). Short Chain Fatty Acids (SCFAs)Mediated Gut Epithelial and Immune Regulation and Its Relevance for Inflammatory Bowel Diseases. Front Immunol, 10: 277.
- Zhou Y, Xu H, Xu J, Guo X. (2021). F. prausnitzii and its supernatant increase SCFAs-producing bacteria to restore gut dysbiosis in TNBSinduced colitis. AMB Express, 11: 33.
- Usta-Gorgun B, L Yilmaz-Ersan. (2020). Short-chain fatty acids production by Bifidobacterium species in the presence of salep. Electronic Journal of Biotechnology. 47: 29-35.
- Salamone D, AA Rivellese, C Vetrani. (2021). The relationship between gut microbiota, short-chain fatty acids and type 2 diabetes mellitus: the possible role of dietary fibre. Acta Diabetol. 58: 1131-1138.
- Xun Z, Zhang Q, Xu T. (2018). Dysbiosis and Ecotypes of the Salivary Microbiome Associated With Inflammatory Bowel Diseases and the Assistance in Diagnosis of Diseases Using Oral Bacterial Profiles. Front Microbiol, 9: 1136.
- Hansen TH. (2018). Impact of a vegan diet on the human salivary microbiota. Sci Rep, 8: 5847.
- Chen L, Zhang L, Hua H, Liu L. (2024). Interactions between toll-like receptors signaling pathway and gut microbiota in host homeostasis. Immun Inflamm Dis,. 12: e1356.
Zhou L, Liu D, Xie Y. Bifidobacterium infantis Induces Protective Colonic PD-L1 and Foxp3 Regulatory T Cells in an Acute Murine Experimental Model of Inflammatory Bowel Disease. Gut Liver. 13: 430-439.- Chandwaskar R, Dalal R, Gupta S, Sharma A. (2024). Dysregulation of T cell response in the pathogenesis of inflammatory bowel disease. Scand J Immunol, 100: e13412.
- Meng EX, GN Verne, Q Zhou. (2024). Macrophages and Gut Barrier Function: Guardians of Gastrointestinal Health in Post-Inflammatory and Post-Infection Responses. Int J Mol Sci, 25.
- Elia PP, Tolentino YFM. (2015). The role of innate immunity receptors in the pathogenesis of inflammatory bowel disease. Mediators Inflamm. 2015: 936193.
- Gonzalez Delgado S, (2022). Interplay between Serotonin, Immune Response, and Intestinal Dysbiosis in Inflammatory Bowel Disease. Int J Mol Sci, 23.
- Siemann JK, Muller CL, Forsberg CG. (2017). An autism-associated serotonin transporter variant disrupts multisensory processing. Transl Psychiatry. 7: e1067.
- Abdulamir HA, OF Abdul-Rasheed, EA Abdulghani. (2018). Serotonin and serotonin transporter levels in autistic children. Saudi Med J. 39: 487-494.
- Muller CL, AMJ Anacker, J Veenstra-VanderWeele. (2016). The serotonin system in autism spectrum disorder: From biomarker to animal models. Neuroscience. 321: 24-41.
- Zhu J, Meng H, Zhang L. (2023). Exploring the molecular mechanism of comorbidity of autism spectrum disorder and inflammatory bowel disease by combining multiple data sets. J Transl Med. 21: 372.
- Fulceri F, Morelli M, Santocchi E, Cena H, Del Bianco T, et al., (2016). Gastrointestinal symptoms and behavioral problems in preschoolers with Autism Spectrum Disorder. Dig Liver Dis. 48: 248-54.
- Berding K, Vlckova K, Marx W, Schellekens H. (2021). Diet and the Microbiota-Gut-Brain Axis: Sowing the Seeds of Good Mental Health. Adv Nutr. 12: 1239-1285.
- Kalkan AE, BinMowyna MN, Raposo A. (2025). Beyond the Gut: Unveiling Butyrate’s Global Health Impact Through Gut Health and Dysbiosis-Related Conditions: A Narrative Review. Nutrients, 17.
- Canada K, TM Evans, KA Pelphrey. (2025). Microbiome’s effect on white matter in autism. J Neurophysiol. 133: 1150-1158.
- Collins CB, HM Roche. (2020). Personalized Nutrition for Inflammatory Bowel Disease. Crohns Colitis 360. 2: otaa042.
- Livingstone K, OR Lopez, Pérusse L, Kato H, Ordovas JM, et al. (2022). Precision nutrition: A review of current approaches and future endeavors. Trends in Food Science & Technology. 128: 253-264.
- Vakadaris G, Stefais C, Giorgi E, Brouvalis M, Voidarou CC, et al. (2023). The Role of Probiotics in Inducing and Maintaining Remission in Crohn’s Disease and Ulcerative Colitis: A Systematic Review of the Literature. Biomedicines, 11: 494.
© by the Authors & Gavin Publishers. This is an Open Access Journal Article Published Under Attribution-Share Alike CC BY-SA: Creative Commons Attribution-Share Alike 4.0 International License. Read More About Open Access Policy.