Antiproliferative and Antimigratory Effects of mTOR Inhibitors in Paediatric Low-grade Gliomas Models. A Comparison between Rapamycin and Sapanisertib
by Pizzoferrato M1, Ferraro C1, Graziano M1, Ciotti GMP2, Ruggiero A3, Navarra P1, Lisi L1*
1Department of Healthcare Surveillance and Bioethics, Section of Pharmacology, Catholic University Medical School, Fondazione Policlinico Universitario A. Gemelli-IRCCS, Rome, Italy.
2Pathology Unit, Department of Woman and Child’s Health and Public Health Sciences. Fondazione Policlinico Universitario Agostino Gemelli IRCCS, Rome, Italy.
3Pediatric Oncology Unit, Catholic University Medical School, Fondazione Policlinico Universitario Agostino Gemelli IRCCS, Rome,
Italy.
*Corresponding author: Lisi L, Department of Healthcare Surveillance and Bioethics, Section of Pharmacology, Catholic University Medical School, Fondazione Policlinico Universitario A. Gemelli-IRCCS, Rome, Italy.
Received Date: 24 February, 2025
Accepted Date: 10 March, 2025
Published Date: 13 March, 2025.
Citation: Pizzoferrato M, Ferraro C, Graziano M, Ciotti GMP, Ruggero A, et al. (2025) Antiproliferative and antimigratory effects of mTOR inhibitors in paediatric low-grade gliomas models. A comparison between Rapamycin and Sapanisertib. J Oncol Res Ther 10: 10268. https://doi.org/10.29011/2574-710X.10268.
Abstract
Low-grade gliomas (LGG) are the most common brain tumors in children. Surgical resection followed by chemo-radiotherapy currently remains the optimal treatment although many tumors are not suitable for surgical intervention and/or they do progress despite conventional chemotherapy. Considering the significant role of the mTOR signalling pathway in carcinogenesis and glioma progression, extensive efforts have been dedicated to counteracting its hyperactivation in cancer cells, leading to the development of various mTOR inhibitors for cancer treatment. This study aimed to investigate the effects of two mTOR inhibitors (Rapamycin and Sapanisertib) on cell viability, toxicity and tumor invasiveness in two well-established human paediatric low-grade glioma models. Our data show that mTOR inhibitors are effective in reducing the proliferation of both RES 186 and 259 cell lines. However, after long-term treatments an activation of MAPK kinase pathway occurs. In addition RAPA and SAP are able to reduce cell migration, through the reduction of Nf-Kb and S6 protein. Some differences emerged between the drugs. Sapanisertib was found to be more effective than rapamycin, as antiproliferative but not as antimigratory drug.
Introduction
Paediatric-type diffuse gliomas have been recognized as distinct from those affecting adults, leading to a separate classification in the 2021 WHO guidelines. These tumours are categorized into low-grade and high-grade groups [1]. Low-grade gliomas (LGG) are the most common brain tumors in children. They include four primary types: a) diffuse astrocytoma with MYB/MYBL1 alteration; b) angiocentric glioma; c) diffuse low-grade glioma with alterations of the mitogen-activated protein kinase (MAPK) signaling pathway; d) polymorphic low-grade neuroepithelial tumors of the young (PLNTY) [2].
Regarding the treatment of paediatric gliomas, various therapeutic options are available. Surgical resection, followed by chemotherapy and/or radiotherapy in selected patients, remains the optimal treatment [3], although many tumors are not suitable for surgical intervention and/or they do progress despite conventional chemotherapy. Furthermore, there is no standard treatment regimen for relapsed disease, although several regimens have been evaluated.
Considering such unmet medical need, it is crucial to explore and develop effective novel strategies for paediatric refractory and/or recurrent low-grade gliomas (pLGG), addressed to ensure longterm control of tumor growth while minimizing toxicity. These strategies should also aim to avoid neurological, cognitive, and endocrine side effects, thus enhancing the overall quality of life [4].
The molecular pathology of pLGGs often involves the dysregulation of MAPK pathway, which is crucial in the control of cell growth, differentiation, and survival.
Both sporadic pediatric and neurofibromatosis type 1 (NF1)associated LGGs exhibit abnormal signaling upstream of mTOR, caused by mutations in receptor tyrosine kinases, or, more commonly in the case of sporadic LGGs, through alterations in BRAF [5].
In fact, almost all pLGGs exhibit aberrant activation of the RAS/MAPK pathway, commonly associated to alterations of BRAF and FGFR1 genes [6]. Such dysregulation in the MAPK pathway may result in downstream hyperactivation of the mammalian target of rapamycin (mTOR) pathway, which further contributes to tumor growth and progression [7].
The mammalian target of rapamycin, mTOR is an intracellular serine/threonine kinase consisting of 2550 amino acids. [8]. mTOR is considered a member of the phosphoinositide 3-kinase (PI3K) family, due to the presence of a catalytic domain similar to those of PI3K lipid kinases. mTOR plays a crucial role in regulating various biological processes such as cell growth, proliferation, protein synthesis [9], immunity, autophagy, apoptosis, metabolism, and cell survival, integrating various extracellular and intracellular signals to maintain cellular homeostasis [10]. Considering the significant role of the mTOR signalling pathway in carcinogenesis and glioma progression, extensive efforts have been dedicated to counteracting its hyperactivation in cancer cells, leading to the development of various mTOR inhibitors for cancer treatment [11].
mTOR can form two distinct functional complexes: mTORC1, which is involved in the control of cell growth and metabolism, and mTORC2, which mainly regulates cell proliferation and survival. These complexes differ in their sensitivity to rapamycin and its analogues, as well as in their ability to interact with different ligands [12]. Despite the well-documented anti-neoplastic properties of the selective mTORC1 inhibitor rapamycin, its use as antitumor agent has been hampered by various reasons, including its inability to inhibit survival pathways regulated by mTORC2–Akt [13], and its poor solubility and poorly predictable pharmacokinetic profile [14]. These limitations have been partially overcome by the introduction of some rapamycin analogs, called “rapalogs”, which are currently used in the treatment of some solid tumors [11]. In the field of pLGGs, the rapalog Everolimus is now being tested for progressive/recurrent pLGGs, showing a high tolerability profile [15]. Despite promising preliminary results, the rapamycin analogues had limited use, mainly because of the development of resistance [16].
To address the above-described limitations of rapamycin and its analogues, second-generation mTOR inhibitors have been developed, which target both mTORC1 and mTORC2 complexes by competing with ATP at the mTOR kinase active site [17]. Dual inhibition of mTORC1 and -2 could effectively block the PI3K/ Akt signaling pathway and prevent its reactivation after treatment by simultaneously targeting three key enzymes: PI3K, Akt, and mTOR [18].
Sapanisertib (CB-228, TAK-228, MLN0128) is among the most promising dual mTOR inhibitors. Administered orally, it shows a high safety and tolerability profile and is currently in phase II clinical development. Sapanisertib is under investigation in patients with glioblastoma [19], renal, pancreatic [20], endometrial, bladder, and breast cancers [21], as well as sarcoma and non-Hodgkin B-cell lymphoma [10]. Some studies have shown that sapanisertib not only inhibits the growth of hepatocellular carcinoma (HCC) but also increases its susceptibility to sorafenib and cabozantinib [22].
Given the high unmet medical need in the treatment of paediatric recurrent and refractory LGGs, and the significant involvement of mTOR pathway in the pathogenesis of the disease, this study aimed to investigate the effects of Sapanisertib on cell viability, toxicity and tumor invasiveness in well-established human paediatric glioma models [23]. The effects of sapanisertib were compared to those of the first-in-class mTOR inhibitor Rapamycin.
Materials and Methods
Cell Lines
Low-grade pediatric glioma cell lines, RES 186 (RRID:CVCL_ DG03) and RES 259 (RRID:CVCL_DG10), were kindly provided by Professor Antonio Ruggiero. RES186 and RES 259 were derived from a 3-year-old female patient with pilocytic astrocytoma and a 4-year-old female patient with diffuse astrocytoma, respectively [23]. Pediatric glioma cell lines were cultured in DMEM F12 (Corning, New York, NY, USA) supplemented with 10% FBS (Gibco, Thermo Fisher Scientific Inc., Waltham, MA, USA), 100 U/mL penicillin-streptomycin (Gibco, Thermo Fisher Scientific Inc., Waltham, MA, USA) and 2 mM L-glutamine (Corning, New York, NY, USA) and were maintained at 37 °C and 5% CO₂. All experiments were performed in a culture medium also containing 1% FBS.
Reagents
Rapamycin (RAPA) was purchased from Sigma-Aldrich (St. Louis, MO, USA), while Sapanisertib (SAP) was provided by Merck & Co (Kenilworth, NJ, USA). Both drugs were dissolved in DMSO to obtain a 10 mM stock solutions.
Cell Viability Assay
The XTT assay (TACS® XTT Cell Proliferation Assay Kit, R&D Systems, Inc. Minneapolis, MN) was performed following the manufacturer’s instructions. RES 186 and RES 259 cell lines were seeded in a 96-well plate at a density of 10,000 cells/well. After 24 h of seeding, cells were treated with various concentrations of Sapanisertib, ranging from 10 pM to 100 nM, and Rapamycin, ranging from 100 pM to 100 nM. The concentrations were chosen based on previously published data [24]. The XTT assay was performed at 72 hours and at 6 days. Cell viability was assessed by measuring absorbance at 490 nm using a microplate reader (Victor 4, PerkinElmer, Waltham, MA, USA) and was expressed as a percentage of viability relative to untreated controls.
Bradford Assay
The Bradford assay (Quick Start™ Bradford Protein Assay Kit, Biorad, Hercules, CA, USA) was performed to quantify protein levels following treatments with RAPA and SAP at the same concentrations used in the cell viability assay. A standard curve was generated ranging from 1 mg/ml to 0 mg/ml using bovine serum albumin (BSA) as a standard. Cells were lysed in 100 μL of Triton with the addition of a protease inhibitor (Sigma Aldrich) diluted 1:500. Subsequently, 10 μL of each treatment were assayed to calculate the amount of protein present in each well, measured as a function of absorbance at 570 nm using a microplate reader (Victor 4, PerkinElmer, Waltham, MA, USA).
Cytotoxicity Assay
The LDH assay (CytoTox 96® Non-Radioactive Cytotoxicity Assay, Promega, Madison, WI, USA) was performed following the manufacturer’s instructions. Paediatric glioma cell lines were seeded and treated using the same paradigm used for the XTT assay. The amount of extracellular and intracellular LDH was assayed by measuring absorbance at 490 nm using a microplate reader (Victor 4, PerkinElmer, Waltham, MA, USA). Extracellular LDH was measured in the culture medium collected at the end of the treatment, while intracellular LDH was measured in the cell lysate obtained after adding 100 μL of Triton with a protease inhibitor diluted 1:500. Results were expressed as a percentage of extracellular LDH over total LDH (where the total LDH is calculated as extracellular + intracellular content).
Cell Migration
RES 186 and RES 259 were seeded on a membrane of a 12-well transwell filter (Corning, New York, NY, USA) at a density of 20,000 cells/well under serum-free conditions. RAPA (10nM), SAP (10nM and 100nM), both diluted in 10% FBS medium, were added to the bottom of the well, directly in contact with the membrane on which the cells were seeded. After approximately 18 hours in the incubator, the cells were washed with PBS containing Ca+2 and Mg+2 and then fixed with 4% formaldehyde. After washing with PBS containing Ca+2 and Mg+2 and with 100X methanol, the cells were stained with Giemsa, previously diluted 1:20 in distilled water, and incubated for 45 minutes. Subsequently, the cells were washed with acidified distilled water, and the well membrane was fixed on a slide. Then, cells were counted using a microscope (Zeiss Axiofot, East Lyme, CT, USA).
RNA Extraction and Quantification
Pediatric glioma cell lines were seeded in a 6-well plate at a density of 500,000 cells/well. RES 186 and 259 were treated with RAPA (1 nM and 10 nM) and SAP (1 nM, 10 nM, 100 nM) for 24 hours. RNA was extracted using Trizol (TRI Reagent®, Sigma-Aldrich, St. Louis, MO, USA). Subsequently, the total amount of extracted RNA was measured using a Qubit fluorometer (Invitrogen, Carlsbad, CA, USA) according to the manufacturer’s instructions. For each sample, 1 µg of RNA was retro-transcripted using the
PrimeScript™ RT Reagent Kit. After retro- transcription, DNase/
RNase-free distilled water (UltraPure™ DNase/RNase-Free Distilled Water, Invitrogen, Carlsbad, CA, USA) was added to each sample to obtain a final concentration of 10 μg/ml of cDNA.
RT-PCR
The previously retro-transcripted amount of cDNA was measured using real-time RT-PCR on an AriaMx system (Agilent Technologies, Santa Clara, CA, USA), employing the Brilliant III Ultra-Fast SYBR Green QPCR Master Mix (Agilent Technologies, Santa Clara, CA, USA). The RT-PCR was conducted under the following conditions: 35 cycles of denaturation at 95°C for 20 seconds; annealing and extension at 60°C for 20 seconds. The primers used to evaluate gene expression were: a) h β-actin: C12 F (50-ACG TTG CTA TCC AGG CTG TGC TAT-30) and D01 R (50-TTA ATG TCA CGC ACG ATT TCC CGC-30) b) h ADAM17: R1744 (50-AAG GAC TGT TCC TGT CAC TGT-30) and F1612 (50-GTT TGT GGG AAC TGC AGG GT-30); c) hADAM 10: R507 (50-ATA CTG ACC TCC CAT CCC CG-30) and F 375 (50TTC TCC CTC CGG ATC GAT GT-30).
Western Blot
RES 186 and RES 259 cells were seeded at a density of 15,000 cells/cm² in 25 cm² flasks and treated for 6 days with RAPA 10 nM and SAP 10 nM and 100 nM, with a medium change after 3 days. At the end of the treatments, cells were scraped in PBS without Ca+2 and Mg+2 and centrifuged at 1200 rpm for 5 minutes. Subsequently, after aspirating the supernatant, the cells were lysed in RIPA buffer [1 mM EDTA, 150 mM NaCl, 1% igepal, 0.5% sodium deoxycholate, 50 mM Tris-HCl, pH 8.0, and 0.1% SDS (Sigma-Aldrich, St. Louis, MO, USA)], supplemented with a protease inhibitor, diluted 1:250 (Sigma–Aldrich, St. Louis, MO, USA). The samples were then subjected to an additional centrifugation cycle at 4 °C, 13000 rpm, for 10 minutes. At the end of this procedure, protein quantification was performed using the Bradford method to evaluate the total amount of protein present in each sample. For our experiments, 7% polyacrylamide home-made gels and precast gels (Invitrogen, Carlsbad, CA, USA) were used, on which 80 μg of protein were loaded. Samples were previously mixed with an LDS buffer [4X Bolt™ LDS Sample Buffer (Cat.
No.: B0007—Novex, Carlsbad, CA, USA)] and a reducing agent [10X Bolt™ Sample Reducing Agent (Cat. No.: B0009—Novex, Carlsbad, CA, USA)] and placed at 95 °C for 5 minutes before performing electrophoresis. At the end of the electrophoretic run, the proteins were transferred to a polyvinylidene fluoride (PVDF) membrane (Invitrogen, Carlsbad, CA, USA) using an iBlot™ transfer device (Invitrogen, Carlsbad, CA, USA), and incubated with gentle shaking with various primary antibodies, either at 4 °C overnight or at room temperature for 2 hours. At the end of the incubation, the primary antibody was removed and, after washing with TBS-T, the secondary antibody was added and incubated with the membrane for one hour. Both primary and secondary antibodies were diluted in Flex solution (iBind™Flex Solution Kit, Invitrogen, Carlsbad, CA, USA) and are reported in Table 1. After further washes in TBS-T, the bands were detected by chemiluminescence (ChemiDoc™ XRS, Biorad, Hercules, CA, USA), by immersing the membrane in ECL (SuperSignal™ West Pico PLUS Chemiluminescent Substrate, Thermo Scientific™, Rockford, IL, USA, and Pierce™ ECL Western Blotting Substrate). In table 1 a description of antibodies used.
|
Antibody |
Diluition |
Producer |
|
Total S6 Ribosomal Protein |
1/1000 |
Cell Signaling |
|
p-S6 Ribosomal Protein (Ser 235/236) |
1/1000 |
Cell signaling |
|
Total EGF Receptor |
1/1000 |
Cell signaling |
|
N-Cadherin |
1/1000 |
BD Bioscience |
|
p-CREB (Ser 133) |
1/1000 |
ThermoFisher |
|
Total Creb |
1/500 |
ThermoFisher |
|
Total Erk 1/2 |
1/1000 |
Cell signaling |
|
p-Erk1/2 (Thr202/Tyr204) |
1/1000 |
Cell signaling |
|
Total MEK |
1/1000 |
Cell signaling |
|
p- MEK (Ser 217/221) |
1/1000 |
Cell signaling |
|
NFκB |
1/1000 |
Cell signaling |
|
β-actin |
1/1000 |
Sigma |
|
Anti-mouse |
1/3000 |
Sigma |
|
Anti- rabbit |
1/15000 |
Jackson Immuno Research |
Table 1: Antibodies used for western blot analysis.
Statistical Analysis
Each experiment was repeated at least three times. All statistical analyses were performed using PrismTM software (GraphPad, San Diego, CA, USA- RRID:SCR_002798). Data were analysed using a one-way ANOVA, followed by Dunnett’s test. Statistical significance was determined at the α = 0.05 level.
Results
Effect of RAPA and SAP on Cell Viability in Two Paediatric pLGG Cell Lines
The effects of RAPA and SAP on cell viability in RES 186 and RES 259 were evaluated following 72-hour and 6-day treatments. RAPA and SAP caused a dose-dependent decrease in RES 186 cell viability. This effect was observed both by the XTT assay and by the measurement of protein levels (Fig 1A and B). Nevertheless, RAPA and SAP showed differences. In fact, at the maximum concentration tested (100 nM), after 72 hours RAPA reduced cell viability by 20% while SAP reached 50% cell death. Similarly, the differences remain marked after 6 days: RAPA 100 nM reduced by 40% while SAP100 nM reduced cell viability by 60%. (Fig 1D and E).
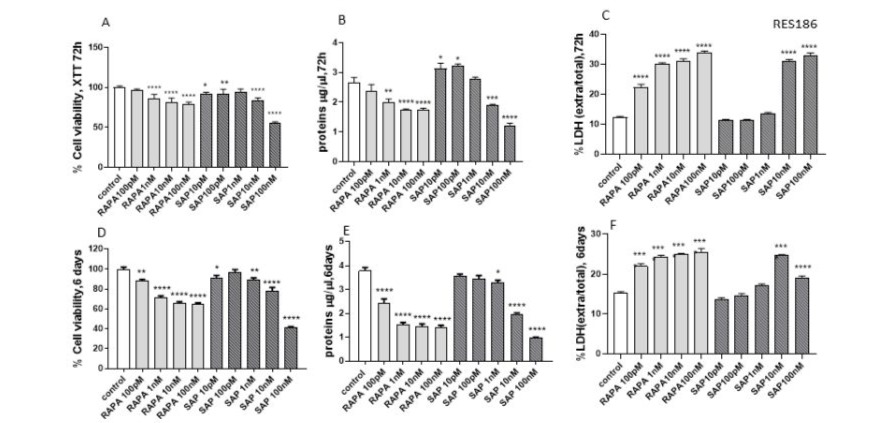
Figure 1: Evaluation of treatment toxicity and the effect on cell survival in RES 186 with RAPA by XTT assay (A: 72h, D:6 days), protein quantity (B: 72h, F:6 days) and LDH assay (C: 72h, E: 6 days). XTT data (A, D) are expressed as a percentage relative to the untreated cells (control = 100%) and are means ± SEM. One-way ANOVA analysis, followed by Dunnett’s post-test, was conducted. * p < 0.05, ** p < 0.01, **** p < 0.0001. Panel B and E show protein quantity expressed as µg/µl at 72 h and 6 days, respectively. Data are means ± SEM and one-way ANOVA analysis, followed by Dunnett’s post-test, was carried out. * p < 0.05, ** p <0.01, *** < 0.005, **** < 0.0001. Panel C and F show the extracellular/total LDH ratio treated for 72 h (C) and 6 days (F) Data are means ±SEM and oneway ANOVA analysis, followed by Dunnett’s post-test, was carried out. **** < 0.0001. All p values were calculated versus the control sample.
In addition, an evaluation of the cellular damage induced by the two drugs was performed. The extracellular LDH/total LDH ratio, an index of cytotoxicity, was found to increase with RAPA and SAP at both 72 hours and 6 days (Fig 1 C and F). In this context there are no differences between the two drugs.
In RES 259 cells, both RAPA and SAP showed lower efficacy. At 72 hours, all doses of RAPA reduced viability by about 10%, while only with SAP 100nM was able to reduce by 20% (Fig 2A and B). Regarding the evaluation of treatment cytotoxicity, at 72 hours a slight increase in the extracellular LDH/total LDH ratio can be appreciated, reaching the highest percentage with RAPA 10nM and SAP 100nM (Fig 2C).
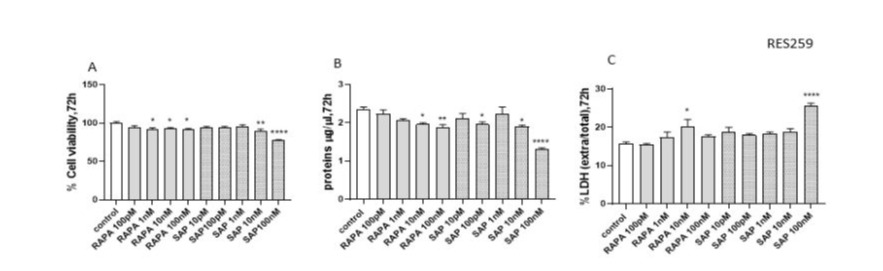
Figure 2: Evaluation of treatment toxicity and the effect on cell survival in RES 259 with RAPA, by XTT assay (A: 72h), protein quantity (B: 72h) and LDH assay (C: 72h). XTT data (A) are expressed as a percentage relative to the untreated cells (control = 100%) and are means ± SEM. One-way ANOVA analysis, followed by Dunnett’s post-test, was conducted* p < 0.05, ** p < 0.01, *** p < 0.005, **** p < 0.0001. Panel B shows protein quantity expressed as µg/µl at 72 h, respectively. Data are means ± SEM and one-way ANOVA analysis, followed by Dunnett’s post-test, was carried out. * p < 0.05, ** p < 0.01, **** < 0.0001. Panel C shows the extracellular/total LDH ratio treated for 72 h (C) Data are means ±SEM and one-way ANOVA analysis, followed by Dunnett’s post-test, was carried out. * p < 0.05, ** p < 0.01, **** p < 0.0001. All p values were calculated versus the control sample.
Effect of RAPA and SAP on the MAP kinase pathway
The effect of RAPA and SAP was also evaluated on the MAP kinase pathway (Fig 3), which, as above described, is frequently altered in pediatric gliomas [25]. In RES186, although the phosphorylation of MEK at Ser 217/222 was increased, the total MEK levels were significantly reduced without differences by both treatments. In turn, the target of MEK, the ERK kinase (p42/ p44), showed the same trend as MEK, with a significant increase in its phosphorylation following treatment with SAP 100nM, and with a decrease in total MEK levels that do not vary particularly among the three pharmacological treatments. Finally, regarding the levels of total and phosphorylated CREB, an increase in its expression can be observed with RAPA 10nM and more so with SAP 100nM (Fig 3A).
In RES259, for pERK an increase was noted with RAPA 10nM and SAP 100nM, while SAP 10 nM show a decrease by at least 40%. Both total and phosphorylated Creb follow the same trend: no effects with RAPA 10nM, while SAP 10 nM and SAP 100 nM cause a dose-dependent increase. Interestingly some differences were found in the expression of MEK protein, which could explain the lower antiproliferative efficacy of treatments in the RES259 comparison RES186. In fact, in RES 259 cells, no significant changes in the total expression levels of the MEK kinase were observed, while its phosphorylated form was not present (Fig 3B).
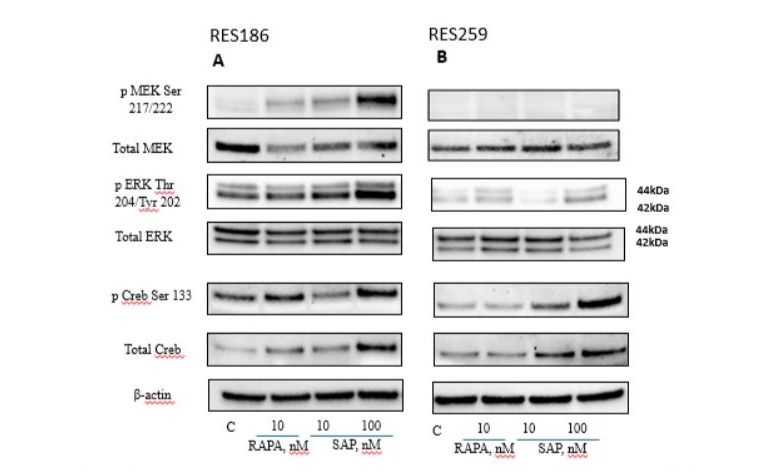
Figure 3: Western blot analysis in RES 186 (3A) and RES 259 (3B) of the main proteins involved in the MAPK pathway after 6 days of the following treatments: Lane 1, control, Lane 2, Rapamycin 10nM, Lane 3, Sapanisertib 10nM, Lane 4, Sapanisertib 100nM. For every protein set β actin is reported as the normalizer gene.
Effect of RAPA and SAP on migration and wound healing capacity of RES 186 and RES 259
Due to the cell migration assay, it was possible to measure the impact of RAPA and SAP on the invasive potential of paediatric glioma cells. Both drugs are able to reduce the migration of RES 186 following an 18-hour treatment. For both cell lines, the effect of RAPA 10 nM and SAP 10 nM was very similar, while SAP 100nM proves to be more effective in reducing the number of migrated cells, especially in RES186 (Fig 4).
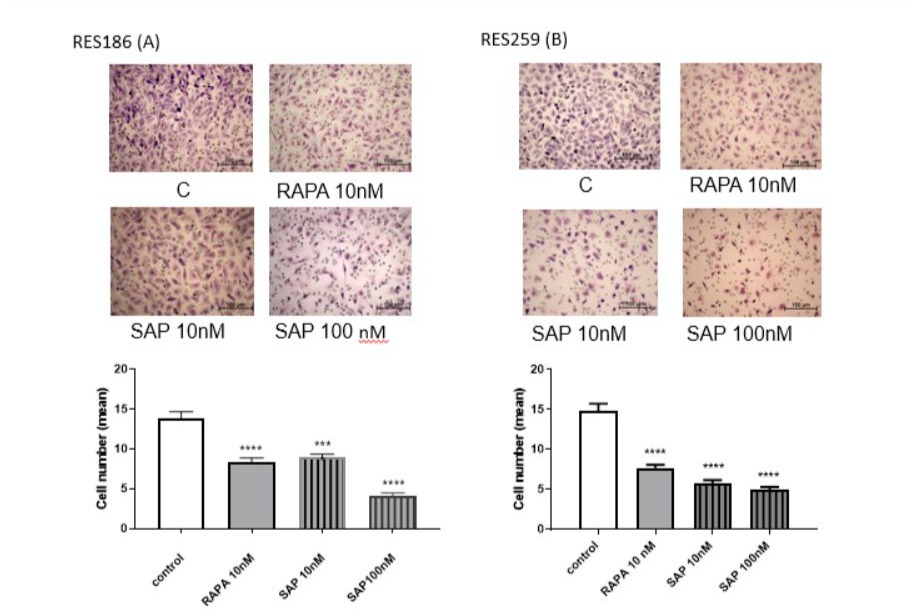
Figure 4: Effect of RAPA and SAP on RES 186 (A) and RES 259 migration (B). The images show the untreated cells, cells treated with 10 nM Rapamycin, cells treated with 10nM Sapanisertib and with Sapanisertib 100nM, respectively. Cell number count was calculated as mean ± SEM and one-way ANOVA analysis, followed by Dunnett’s post-test, was carried out. *** p < 0.005.
Effect of RAPA and SAP on epithelial-mesenchymal transition in RES 186 and RES 259
In light of the evidence found in the cell migration assay, we sought to further investigate the mechanism through which RAPA and SAP could counteract migration and, consequently, reduce the potential phenomenon of epithelial-mesenchymal transition, which characterizes more invasive tumors [26]. Therefore, we verified how the expression of some invasion markers, such as N-cadherin [27], NF-κB, the EGF receptor and ribosomal protein S6, was influenced by RAPA and SAP after 6 days of treatment both in RES 186 (Fig 5A) and RES 259 (Fig 5B). In RES 186 an increase in N-cadherin expression levels was observed with RAPA 10nM and SAP, while in RES 259 no effects was reported. In both cell lines, the dose of SAP 100nM was able to significantly reduce NF-κB levels. Regarding the EGF receptor a tendence to reduction was reported. Finally, in line with the migration data, RAPA and SAP in both cell line significantly reduced the levels of phosphorylated S6 protein, which seems to be the main target through drugs block migration.
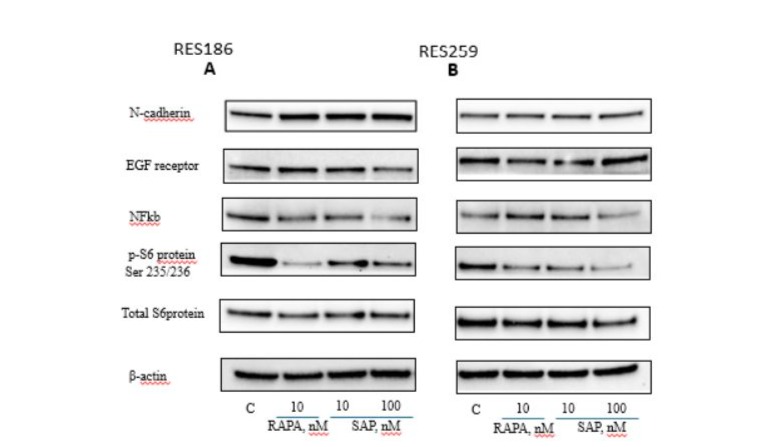
Figure 5: Western blot analysis in RES 186 (A) and RES 259 (B) of the main proteins involved in the EMT mechanism after 6 days of the following treatments: Lane 1, control, Lane 2, Rapamycin 10nM, Lane 3, Sapanisertib 10nM, Lane 4, Sapanisertib 100nM. For every protein set β actin is reported as the normalizer gene.
In addition to assessing the expression of the previously mentioned invasion markers, we also analyzed the gene expression levels of two metalloproteinases, ADAM 10 and ADAM 17, which are critically involved in promoting tumor invasiveness [28]. This analysis was performed at 24 hours in both pediatric glioma cell lines (Fig. 6). In RES 186, hADAM 10 showed a significant increase with both drugs, whereas in RES 259, this increase was only observed with SAP at 100 nM, with no significant changes noted for other treatments. Conversely, hADAM 17 levels decreased in both cell lines following treatment with either RAPA or SAP (Fig. 6).
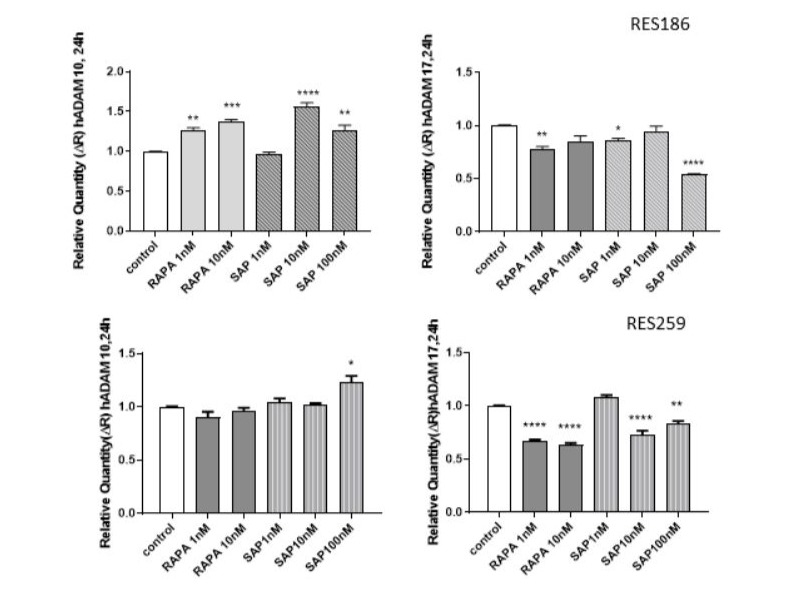
Figure 6: Effect of RAPA and SAP on hADAM 10, hADAM 17 gene expression after 24 h treatment with RAPA 1,10 nM and SAP 1,10,100 nM. Data are expressed as a fold change of treated samples versus control, considered as a calibrator. Data are means ± SEM, and were analyzed by one-way ANOVA, followed by Dunnett’s post-test. * p < 0.05, ** p <0.01 *** p < 0.005, **** p < 0.0001.
Discussion
Our data demonstrate that mTOR inhibitors effectively reduce the proliferation of pediatric low-grade gliomas in two distinct cell lines. However, long-term treatments lead to activation of the MAPK kinase pathway. Furthermore, both RAPA and SAP reduce cell migration by decreasing NF-κB and pS6 protein levels. Notably, differences between the drugs were observed: SAP proved to be more effective than RAPA as an antiproliferative agent, but not as an antimigratory drug. Additionally, the two cell lines exhibited varying responses to the treatments, particularly in the proliferation assays. Various studies have reported an anti-proliferative effect of mTOR inhibition in vitro after long-term treatments. However, in vivo, this effect was sustained only with short-term treatments. This discrepancy may be attributed to compensatory mechanisms within the mTOR pathway or other related signaling pathways, which enable the tumor to bypass the drug's inhibitory effects. To test this hypothesis, an analysis of the impact of mTOR inhibitors on the MAP kinase pathway, a signaling cascade that closely interacts with mTOR [29], could be informative. In both pediatric glioma cell lines, a 6-day treatment with SAP at 100 nM led to increased phosphorylation levels of ERK and CREB.
Thus, mTOR inhibition is correlated with the activation of the MAP kinase (MAPK) pathway through compensatory feedback mechanisms, an event that occurs in various types of tumors [30]. In addition, in both tumor lines, SAP 10 nM and RAPA have an opposite effect on Creb phosphorylation. In fact, in RES 186 RAPA increases the levels of phosphorylated Creb, while SAP 10nM tends to reduce; in RES 259 RAPA has no effect on phosphorylated Creb, while SAP 10nM increases it. SAP 100 nM, on the other hand, always induces an increase in the levels of Creb phosphorylation. This effect could represent a mechanism of resistance to the administered treatment, considering that numerous signaling pathways and various stimuli converge on Creb and could therefore cause opposite effects [31].
Acquiring migratory and invasive capacity is a hallmark of advanced cancers. The epithelial-mesenchymal transition (EMT) is a finely regulated biological process that leads to a reversible change in cellular phenotype, involving the loss of epithelial characteristics and the acquisition of a mesenchymal phenotype, rendering the tumor more invasive and aggressive (Tam et Weinberg, 2013). mTOR is actively involved in inducing the EMT [32]: once activated by TGF-β, a well-known factor responsible for promoting EMT in many cancers, mTOR increases protein synthesis rates and induces an increase in cell size [32]. Considering the highly invasive nature of gliomas [33], our study evaluated the effect of mTOR inhibition on this aspect, demonstrating its remarkable efficacy in reducing cell migration, in both pediatric glioma cell lines. This data was also supported by the analysis of the protein expression of some typical EMT markers, including NF-κB, a factor particularly known for its role in inflammatory processes but also involved in promoting EMT [34], the EGF receptor, and the ribosomal protein S6 [35].
Regarding these markers, we observed a reduction in the expression of: a) NF-κB, induced by SAP in a dose-dependent manner in both RES 186 and RES 259; b) ribosomal protein S6 in its phosphorylated form on Ser 235/236. According to the data reported in the literature, the activation of the EGF receptor acts as a signal for the activation of NF-κB [36] and ribosomal protein S6 [35], which then predicts its phosphorylation, our study would confirm that the inhibition of the EGF receptor, induced by the inactivation of mTOR [37], is therefore responsible for the inactivation of NF-κB and ribosomal protein S6.
To further explore the effects of Sapanisertib on EMT, we measured the expression levels of ADAM 10 and ADAM 17, two metalloproteinases implicated in extracellular matrix remodelling, a hallmark of EMT. Given the established link between elevated MMP levels and tumor aggressiveness, we hypothesized that mTOR inhibition might influence MMP expression and, consequently, tumor cell invasiveness [38]. As emerged from the analysis of mRNA levels of the two metalloproteinases considered, a significant reduction in ADAM 17 can be observed as early as 24 hours with both drugs, but especially with SAP 100nM. As for ADAM 10, both RAPA and SAP tend to increase its expression levels in a time-dependent manner, without showing differences between the two cell lines.
Conclusion
The present study demonstrates the efficacy of mTOR inhibitors in reducing the proliferative and invasive potential of pediatric LGGs. In some cases, dual-specific mTOR inhibition emerged as a potentially more effective strategy compared to selective inhibitors. However, the mechanisms underlying resistance, likely due to activation of the MAP kinase pathway, require further investigation.
Conflict of interest statement
The authors declare no potential conflicts of interest.
References
- Komori T (2021) The molecular framework of pediatric-type diffuse gliomas: shifting toward the revision of the WHO classification of tumors of the central nervous system. Brain Tumor Pathol 38:1-3.
- Kurokawa R, Kurokawa M, Baba A, Ota Y, Pinarbasi E, et al. (2022) Major Changes in 2021 World Health Organization Classification of Central Nervous System Tumors. Radiographics 42:1474-1493.
- Nikitović M, Stanić D, Pekmezović T, Gazibara MS, Bokun J, et al. (2016) Pediatric glioblastoma: A single institution experience. Childs Nerv Syst 32:97-103.
- Al-Jilaihawi S, Lowis S (2023) A Molecular Update and Review of Current Trials in Paediatric Low-Grade Gliomas. Pediatr Neurosurg 58:290-298.
- Wright KD, Yao X, London WB, Kao PC, Gore L, et al. (2021) A POETIC Phase II study of continuous oral everolimus in recurrent, radiographically progressive pediatric low-grade glioma. Pediatr Blood Cancer 68:e28787.
- Park YW, Vollmuth P, Foltyn-Dumitru M, Sahm F, Chang JH, et al. (2023) The 2021 WHO Classification for Gliomas and Implications on Imaging Diagnosis: Part 2-Summary of Imaging Findings on Pediatric-Type Diffuse High-Grade Gliomas, Pediatric-Type Diffuse Low-Grade Gliomas, and Circumscribed Astrocytic Gliomas. J Magn Reson Imaging 58:690-708.
- Cacchione A, Lodi M, Carai A, Miele E, Tartaglia M, et al. (2021)Upfront treatment with mTOR inhibitor everolimus in pediatric low-grade gliomas: A single-center experience. Int J Cancer 148:2522-2534.
- Murugan AK (2019) mTOR: Role in cancer, metastasis and drug resistance. Semin Cancer Biol 59:92-111.
- Bjornsti MA, Houghton PJ (2004) The TOR pathway: a target for cancer therapy. Nat Rev Cancer 4:335-48.
- Panwar V, Singh A, Bhatt M, Tonk RK, Azizov S, et al. (2023) Multifaceted role of mTOR (mammalian target of rapamycin) signaling pathway in human health and disease. Signal Transduct Target Ther 8:375.
- Conciatori F, Ciuffreda L, Bazzichetto C, Falcone I, Pilotto S, et al. (2018) mTOR Crosstalk in Cancer and Potential for Combination Therapy. Cancers 10:23.
- Loewith R, Jacinto E, Wullschleger S, Lorberg A, Crespo JL, et al. (2002) Two TOR complexes, only one of which is rapamycin sensitive, have distinct roles in cell growth control. Mol Cell 10:457-68.
- Joly MM, Williams MM, Hicks DJ, Jones B, Sanchez V, et al. (2017) Two distinct mTORC2-dependent pathways converge on Rac1 to drive breast cancer metastasis. Breast Cancer Res 19:74.
- Kuerec AH, Maier AB (2023) Why Is Rapamycin Not a Rapalog? Gerontology 69:657-659.
- Haas-Kogan DA, Aboian MS, Minturn JE, Leary SES, Abdelbaki MS, et al. (2024) Everolimus for Children With Recurrent or Progressive Low-Grade Glioma: Results From the Phase II PNOC001 Trial. J Clin Oncol 42:441-451.
- Hua H, Kong Q, Zhang H, Wang J, Luo T, et al. (2019) Targeting mTOR for cancer therapy. J Hematol Oncol 12:71.
- Sabatini DM (2006) mTOR and cancer: insights into a complex relationship. Nat Rev Cancer 6:729-34.
- Zheng B, Mao J H, Qian L, Zhu H, Gu D H, et al. Pre-clinical evaluation of AZD-2014, a novel mTORC1/2 dual inhibitor, against renal cell carcinoma. Cancer Lett 357:468–475.
- Moore KN, Bauer TM, Falchook GS, Chowdhury S, Patel C, et al. (2018) Phase I study of the investigational oral mTORC1/2 inhibitor sapanisertib (TAK-228): tolerability and food effects of a milled formulation in patients with advanced solid tumours. ESMO Open 3:e000291.
- Rajdev L, Lee JW, Libutti SK, Benson AB, Kunz PL, et al. (2022) A phase II study of sapanisertib (TAK-228) a mTORC1/2 inhibitor in rapalog-resistant advanced pancreatic neuroendocrine tumors (PNET): ECOG-ACRIN EA2161. Invest New Drugs 40:1306-1314.
- Voss MH, Gordon MS, Mita M, Rini B, Makker V, et al. (2020) Phase 1 study of mTORC1/2 inhibitor sapanisertib (TAK-228) in advanced solid tumours, with an expansion phase in renal, endometrial or bladder cancer. Br J Cancer 123:1590-1598.
- Shang R, Song X, Wang P, Zhou Y, Lu X, et al. (2021) Cabozantinib-based combination therapy for the treatment of hepatocellular carcinoma. Gut 70:1746-1757.
- Bax DA, Little SE, Gaspar N, Perryman L, Marshall L, et al. (2009) Molecular and phenotypic characterisation of paediatric glioma cell lines as models for preclinical drug development. PLoS One 4:e5209.
- Lisi L, Pizzoferrato M, Ciotti GMP, Martire M, Navarra P (2023) mTOR Inhibition Is Effective against Growth, Survival and Migration, but Not against Microglia Activation in Preclinical Glioma Models. Int J Mol Sci 24:9834.
- Banerjee S, Crouse NR, Emnett RJ, Gianino SM, Gutmann DH (2011) Neurofibromatosis-1 regulates mTOR-mediated astrocyte growth and glioma formation in a TSC/Rheb-independent manner. Proc. Natl Acad. Sci. USA 108:15996–6001.
- Ning W, Qiu Z, Ji X, Wang X, An Y, et al. (2020) The Prognostic Value of EMT in Glioma and its Role in the Glioma Immune Microenvironment. J Mol Neurosci 70:1501-1511.
- Loh CY, Chai JY, Tang TF, Wong WF, Sethi G, et al. (2019) The E-Cadherin and N-Cadherin Switch in Epithelial-to-Mesenchymal Transition: Signaling, Therapeutic Implications, and Challenges. Cells 8:1118.
- Wetzel S, Seipold L, Saftig P (2017) The metalloproteinase ADAM10: A useful therapeutic target?. Biochim Biophys Acta Mol Cell Res 1864:2071-2081.
- Mendoza MC, Blenis JEEE (2011) The Ras-ERK and PI3K-mTOR pathways: cross-talk and compensation. Trends Biochem Sci 36:320-8.
- Shimizu T, Tolcher AW, Papadopoulos KP, Beeram M, Rasco DW, et al. (2012) The clinical effect of the dual-targeting strategy involving PI3K/AKT/mTOR and RAS/MEK/ERK pathways in patients with advanced cancer. Clin Cancer Res 18:2316-25.
- Wang H, Xu J, Lazarovici P, Quirion R, Zheng W (2018) cAMP Response Element-Binding Protein (CREB): A Possible Signaling Molecule Link in the Pathophysiology of Schizophrenia. Front Mol Neurosci 11:255.
- Kwasnicki A, Jeevan D, Braun A, Murali R, Jhanwar-Uniyal M (2015) Involvement of mTOR signaling pathways in regulating growth and dissemination of metastatic brain tumors via EMT. Anticancer Res 35:689-96.
- Erices JI, Bizama C, Niechi I, Uribe D, Rosales A, et al. (2023) Glioblastoma Microenvironment and Invasiveness: New 113. Int J Mol Sci 24:7047.
- Huber MA, Azoitei N, Baumann B, Grünert S, Sommer A, et al. (2004) NF-kappaB is essential for epithelial-mesenchymal transition and metastasis in a model of breast cancer progression. J Clin Invest 114:569-81.
- Yi YW, You KS, Park JS, Lee SG, Seong YS (2021) Ribosomal Protein S6: A Potential Therapeutic Target against Cancer?. Int J Mol Sci 23:48.
- Sethi G, Ahn KS, Chaturvedi MM, Aggarwal BB (2007) Epidermal growth factor (EGF) activates nuclear factor-kappaB through IkappaBalpha kinase-independent but EGF receptor-kinase dependent tyrosine 42 phosphorylation of IkappaBalpha. Oncogene 26:7324-32.
- Colella B, Colardo M, Iannone G, Contadini C, Saiz-Ladera C, et al. (2020) mTOR Inhibition Leads to Src-Mediated EGFR Internalisation and Degradation in Glioma Cells. Cancers (Basel) 12:2266.
- Cabral-Pacheco GA, Garza-Veloz I, Rosa CCDL, Ramirez-Acuña JM, Perez-Romero BA, et al. (2020) The Roles of Matrix Metalloproteinases and Their Inhibitors in Human Diseases. Int J Mol Sci 21:9739.
© by the Authors & Gavin Publishers. This is an Open Access Journal Article Published Under Attribution-Share Alike CC BY-SA: Creative Commons Attribution-Share Alike 4.0 International License. Read More About Open Access Policy.